Free Statistics

of Irreproducible Research!

Author's title

Author*Unverified author*
R Software Modulerwasp_autocorrelation.wasp
Title produced by software(Partial) Autocorrelation Function
Date of computationThu, 16 Mar 2017 12:13:41 +0000
Cite this page as followsStatistical Computations at FreeStatistics.org, Office for Research Development and Education, URL https://freestatistics.org/blog/index.php?v=date/2017/Mar/16/t1489666476gxfaehvb06h9u65.htm/, Retrieved Tue, 14 May 2024 17:02:12 +0200
Statistical Computations at FreeStatistics.org, Office for Research Development and Education, URL https://freestatistics.org/blog/index.php?pk=, Retrieved Tue, 14 May 2024 17:02:12 +0200
QR Codes:

Original text written by user:
IsPrivate?No (this computation is public)
User-defined keywords
Estimated Impact0
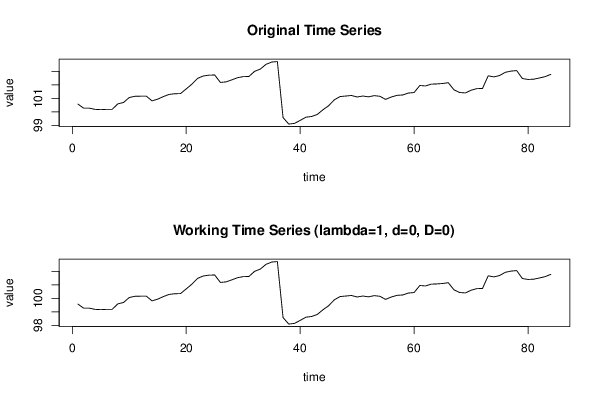
Dataseries X:
100,57
100,27
100,27
100,18
100,16
100,18
100,18
100,59
100,69
101,06
101,15
101,16
101,16
100,81
100,94
101,13
101,29
101,34
101,35
101,7
102,05
102,48
102,66
102,72
102,73
102,18
102,22
102,37
102,53
102,61
102,62
103
103,17
103,52
103,69
103,73
99,57
99,09
99,14
99,36
99,6
99,65
99,8
100,15
100,45
100,89
101,13
101,17
101,21
101,1
101,17
101,11
101,2
101,15
100,92
101,1
101,22
101,25
101,39
101,43
101,95
101,92
102,05
102,07
102,1
102,16
101,63
101,43
101,4
101,6
101,72
101,73
102,67
102,59
102,69
102,93
103,02
103,06
102,47
102,4
102,42
102,51
102,61
102,78


Summary of computational transaction
Raw Inputview raw input (R code)
Raw Outputview raw output of R engine
Computing time2 seconds
R Server'Gwilym Jenkins' @ jenkins.wessa.net

\begin{tabular}{lllllllll}
\hline
Summary of computational transaction \tabularnewline
Raw Input & view raw input (R code)  \tabularnewline
Raw Output & view raw output of R engine  \tabularnewline
Computing time & 2 seconds \tabularnewline
R Server & 'Gwilym Jenkins' @ jenkins.wessa.net \tabularnewline
\hline
\end{tabular}
%Source: https://freestatistics.org/blog/index.php?pk=&T=0

[TABLE]
[ROW][C]Summary of computational transaction[/C][/ROW]
[ROW][C]Raw Input[/C][C]view raw input (R code) [/C][/ROW]
[ROW][C]Raw Output[/C][C]view raw output of R engine [/C][/ROW]
[ROW][C]Computing time[/C][C]2 seconds[/C][/ROW]
[ROW][C]R Server[/C][C]'Gwilym Jenkins' @ jenkins.wessa.net[/C][/ROW]
[/TABLE]
Source: https://freestatistics.org/blog/index.php?pk=&T=0

Globally Unique Identifier (entire table): ba.freestatistics.org/blog/index.php?pk=&T=0

As an alternative you can also use a QR Code:  

The GUIDs for individual cells are displayed in the table below:

Summary of computational transaction
Raw Inputview raw input (R code)
Raw Outputview raw output of R engine
Computing time2 seconds
R Server'Gwilym Jenkins' @ jenkins.wessa.net


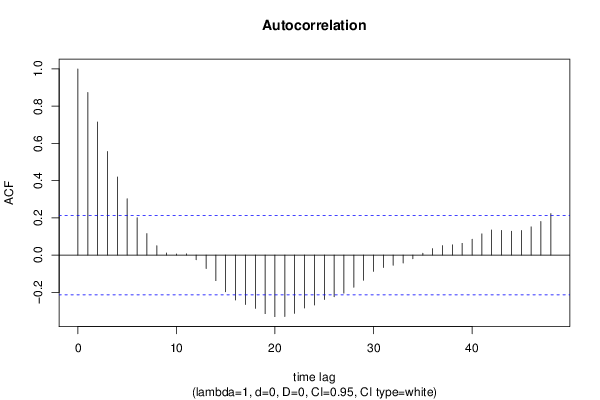
Autocorrelation Function
Time lag kACF(k)T-STATP-value
10.873818.00860
20.7149436.55260
30.5564485.09991e-06
40.4194063.84390.000117
50.3025272.77270.003423
60.2002941.83570.034969
70.1152931.05670.146843
80.050560.46340.322143
90.0115430.10580.458001
100.0057920.05310.478894
110.0064270.05890.476585
12-0.024842-0.22770.410224
13-0.07251-0.66460.254075
14-0.137081-1.25640.106232
15-0.197239-1.80770.037114
16-0.241076-2.20950.014931
17-0.265544-2.43370.008532
18-0.286252-2.62350.005167
19-0.31452-2.88260.002503
20-0.330731-3.03120.001619
21-0.330058-3.0250.001649
22-0.313112-2.86970.002598
23-0.284204-2.60480.005436
24-0.268048-2.45670.00804
25-0.238984-2.19030.015636
26-0.22388-2.05190.021647
27-0.204291-1.87240.032318
28-0.172776-1.58350.05853
29-0.135459-1.24150.108939
30-0.087722-0.8040.211837
31-0.067132-0.61530.27002
32-0.055062-0.50460.307564
33-0.042409-0.38870.349248
34-0.020068-0.18390.427258
350.0102680.09410.462625
360.0348710.31960.375034
370.05090.46650.321031
380.0549970.50410.307772
390.0631510.57880.28214
400.0850790.77980.218861
410.1139471.04430.149663
420.13511.23820.109543
430.1326511.21580.113739
440.1285331.1780.121058
450.1323291.21280.1143
460.1515051.38860.084319
470.1807431.65650.050672
480.2227032.04110.02219

\begin{tabular}{lllllllll}
\hline
Autocorrelation Function \tabularnewline
Time lag k & ACF(k) & T-STAT & P-value \tabularnewline
1 & 0.87381 & 8.0086 & 0 \tabularnewline
2 & 0.714943 & 6.5526 & 0 \tabularnewline
3 & 0.556448 & 5.0999 & 1e-06 \tabularnewline
4 & 0.419406 & 3.8439 & 0.000117 \tabularnewline
5 & 0.302527 & 2.7727 & 0.003423 \tabularnewline
6 & 0.200294 & 1.8357 & 0.034969 \tabularnewline
7 & 0.115293 & 1.0567 & 0.146843 \tabularnewline
8 & 0.05056 & 0.4634 & 0.322143 \tabularnewline
9 & 0.011543 & 0.1058 & 0.458001 \tabularnewline
10 & 0.005792 & 0.0531 & 0.478894 \tabularnewline
11 & 0.006427 & 0.0589 & 0.476585 \tabularnewline
12 & -0.024842 & -0.2277 & 0.410224 \tabularnewline
13 & -0.07251 & -0.6646 & 0.254075 \tabularnewline
14 & -0.137081 & -1.2564 & 0.106232 \tabularnewline
15 & -0.197239 & -1.8077 & 0.037114 \tabularnewline
16 & -0.241076 & -2.2095 & 0.014931 \tabularnewline
17 & -0.265544 & -2.4337 & 0.008532 \tabularnewline
18 & -0.286252 & -2.6235 & 0.005167 \tabularnewline
19 & -0.31452 & -2.8826 & 0.002503 \tabularnewline
20 & -0.330731 & -3.0312 & 0.001619 \tabularnewline
21 & -0.330058 & -3.025 & 0.001649 \tabularnewline
22 & -0.313112 & -2.8697 & 0.002598 \tabularnewline
23 & -0.284204 & -2.6048 & 0.005436 \tabularnewline
24 & -0.268048 & -2.4567 & 0.00804 \tabularnewline
25 & -0.238984 & -2.1903 & 0.015636 \tabularnewline
26 & -0.22388 & -2.0519 & 0.021647 \tabularnewline
27 & -0.204291 & -1.8724 & 0.032318 \tabularnewline
28 & -0.172776 & -1.5835 & 0.05853 \tabularnewline
29 & -0.135459 & -1.2415 & 0.108939 \tabularnewline
30 & -0.087722 & -0.804 & 0.211837 \tabularnewline
31 & -0.067132 & -0.6153 & 0.27002 \tabularnewline
32 & -0.055062 & -0.5046 & 0.307564 \tabularnewline
33 & -0.042409 & -0.3887 & 0.349248 \tabularnewline
34 & -0.020068 & -0.1839 & 0.427258 \tabularnewline
35 & 0.010268 & 0.0941 & 0.462625 \tabularnewline
36 & 0.034871 & 0.3196 & 0.375034 \tabularnewline
37 & 0.0509 & 0.4665 & 0.321031 \tabularnewline
38 & 0.054997 & 0.5041 & 0.307772 \tabularnewline
39 & 0.063151 & 0.5788 & 0.28214 \tabularnewline
40 & 0.085079 & 0.7798 & 0.218861 \tabularnewline
41 & 0.113947 & 1.0443 & 0.149663 \tabularnewline
42 & 0.1351 & 1.2382 & 0.109543 \tabularnewline
43 & 0.132651 & 1.2158 & 0.113739 \tabularnewline
44 & 0.128533 & 1.178 & 0.121058 \tabularnewline
45 & 0.132329 & 1.2128 & 0.1143 \tabularnewline
46 & 0.151505 & 1.3886 & 0.084319 \tabularnewline
47 & 0.180743 & 1.6565 & 0.050672 \tabularnewline
48 & 0.222703 & 2.0411 & 0.02219 \tabularnewline
\hline
\end{tabular}
%Source: https://freestatistics.org/blog/index.php?pk=&T=1

[TABLE]
[ROW][C]Autocorrelation Function[/C][/ROW]
[ROW][C]Time lag k[/C][C]ACF(k)[/C][C]T-STAT[/C][C]P-value[/C][/ROW]
[ROW][C]1[/C][C]0.87381[/C][C]8.0086[/C][C]0[/C][/ROW]
[ROW][C]2[/C][C]0.714943[/C][C]6.5526[/C][C]0[/C][/ROW]
[ROW][C]3[/C][C]0.556448[/C][C]5.0999[/C][C]1e-06[/C][/ROW]
[ROW][C]4[/C][C]0.419406[/C][C]3.8439[/C][C]0.000117[/C][/ROW]
[ROW][C]5[/C][C]0.302527[/C][C]2.7727[/C][C]0.003423[/C][/ROW]
[ROW][C]6[/C][C]0.200294[/C][C]1.8357[/C][C]0.034969[/C][/ROW]
[ROW][C]7[/C][C]0.115293[/C][C]1.0567[/C][C]0.146843[/C][/ROW]
[ROW][C]8[/C][C]0.05056[/C][C]0.4634[/C][C]0.322143[/C][/ROW]
[ROW][C]9[/C][C]0.011543[/C][C]0.1058[/C][C]0.458001[/C][/ROW]
[ROW][C]10[/C][C]0.005792[/C][C]0.0531[/C][C]0.478894[/C][/ROW]
[ROW][C]11[/C][C]0.006427[/C][C]0.0589[/C][C]0.476585[/C][/ROW]
[ROW][C]12[/C][C]-0.024842[/C][C]-0.2277[/C][C]0.410224[/C][/ROW]
[ROW][C]13[/C][C]-0.07251[/C][C]-0.6646[/C][C]0.254075[/C][/ROW]
[ROW][C]14[/C][C]-0.137081[/C][C]-1.2564[/C][C]0.106232[/C][/ROW]
[ROW][C]15[/C][C]-0.197239[/C][C]-1.8077[/C][C]0.037114[/C][/ROW]
[ROW][C]16[/C][C]-0.241076[/C][C]-2.2095[/C][C]0.014931[/C][/ROW]
[ROW][C]17[/C][C]-0.265544[/C][C]-2.4337[/C][C]0.008532[/C][/ROW]
[ROW][C]18[/C][C]-0.286252[/C][C]-2.6235[/C][C]0.005167[/C][/ROW]
[ROW][C]19[/C][C]-0.31452[/C][C]-2.8826[/C][C]0.002503[/C][/ROW]
[ROW][C]20[/C][C]-0.330731[/C][C]-3.0312[/C][C]0.001619[/C][/ROW]
[ROW][C]21[/C][C]-0.330058[/C][C]-3.025[/C][C]0.001649[/C][/ROW]
[ROW][C]22[/C][C]-0.313112[/C][C]-2.8697[/C][C]0.002598[/C][/ROW]
[ROW][C]23[/C][C]-0.284204[/C][C]-2.6048[/C][C]0.005436[/C][/ROW]
[ROW][C]24[/C][C]-0.268048[/C][C]-2.4567[/C][C]0.00804[/C][/ROW]
[ROW][C]25[/C][C]-0.238984[/C][C]-2.1903[/C][C]0.015636[/C][/ROW]
[ROW][C]26[/C][C]-0.22388[/C][C]-2.0519[/C][C]0.021647[/C][/ROW]
[ROW][C]27[/C][C]-0.204291[/C][C]-1.8724[/C][C]0.032318[/C][/ROW]
[ROW][C]28[/C][C]-0.172776[/C][C]-1.5835[/C][C]0.05853[/C][/ROW]
[ROW][C]29[/C][C]-0.135459[/C][C]-1.2415[/C][C]0.108939[/C][/ROW]
[ROW][C]30[/C][C]-0.087722[/C][C]-0.804[/C][C]0.211837[/C][/ROW]
[ROW][C]31[/C][C]-0.067132[/C][C]-0.6153[/C][C]0.27002[/C][/ROW]
[ROW][C]32[/C][C]-0.055062[/C][C]-0.5046[/C][C]0.307564[/C][/ROW]
[ROW][C]33[/C][C]-0.042409[/C][C]-0.3887[/C][C]0.349248[/C][/ROW]
[ROW][C]34[/C][C]-0.020068[/C][C]-0.1839[/C][C]0.427258[/C][/ROW]
[ROW][C]35[/C][C]0.010268[/C][C]0.0941[/C][C]0.462625[/C][/ROW]
[ROW][C]36[/C][C]0.034871[/C][C]0.3196[/C][C]0.375034[/C][/ROW]
[ROW][C]37[/C][C]0.0509[/C][C]0.4665[/C][C]0.321031[/C][/ROW]
[ROW][C]38[/C][C]0.054997[/C][C]0.5041[/C][C]0.307772[/C][/ROW]
[ROW][C]39[/C][C]0.063151[/C][C]0.5788[/C][C]0.28214[/C][/ROW]
[ROW][C]40[/C][C]0.085079[/C][C]0.7798[/C][C]0.218861[/C][/ROW]
[ROW][C]41[/C][C]0.113947[/C][C]1.0443[/C][C]0.149663[/C][/ROW]
[ROW][C]42[/C][C]0.1351[/C][C]1.2382[/C][C]0.109543[/C][/ROW]
[ROW][C]43[/C][C]0.132651[/C][C]1.2158[/C][C]0.113739[/C][/ROW]
[ROW][C]44[/C][C]0.128533[/C][C]1.178[/C][C]0.121058[/C][/ROW]
[ROW][C]45[/C][C]0.132329[/C][C]1.2128[/C][C]0.1143[/C][/ROW]
[ROW][C]46[/C][C]0.151505[/C][C]1.3886[/C][C]0.084319[/C][/ROW]
[ROW][C]47[/C][C]0.180743[/C][C]1.6565[/C][C]0.050672[/C][/ROW]
[ROW][C]48[/C][C]0.222703[/C][C]2.0411[/C][C]0.02219[/C][/ROW]
[/TABLE]
Source: https://freestatistics.org/blog/index.php?pk=&T=1

Globally Unique Identifier (entire table): ba.freestatistics.org/blog/index.php?pk=&T=1

As an alternative you can also use a QR Code:  

The GUIDs for individual cells are displayed in the table below:

Autocorrelation Function
Time lag kACF(k)T-STATP-value
10.873818.00860
20.7149436.55260
30.5564485.09991e-06
40.4194063.84390.000117
50.3025272.77270.003423
60.2002941.83570.034969
70.1152931.05670.146843
80.050560.46340.322143
90.0115430.10580.458001
100.0057920.05310.478894
110.0064270.05890.476585
12-0.024842-0.22770.410224
13-0.07251-0.66460.254075
14-0.137081-1.25640.106232
15-0.197239-1.80770.037114
16-0.241076-2.20950.014931
17-0.265544-2.43370.008532
18-0.286252-2.62350.005167
19-0.31452-2.88260.002503
20-0.330731-3.03120.001619
21-0.330058-3.0250.001649
22-0.313112-2.86970.002598
23-0.284204-2.60480.005436
24-0.268048-2.45670.00804
25-0.238984-2.19030.015636
26-0.22388-2.05190.021647
27-0.204291-1.87240.032318
28-0.172776-1.58350.05853
29-0.135459-1.24150.108939
30-0.087722-0.8040.211837
31-0.067132-0.61530.27002
32-0.055062-0.50460.307564
33-0.042409-0.38870.349248
34-0.020068-0.18390.427258
350.0102680.09410.462625
360.0348710.31960.375034
370.05090.46650.321031
380.0549970.50410.307772
390.0631510.57880.28214
400.0850790.77980.218861
410.1139471.04430.149663
420.13511.23820.109543
430.1326511.21580.113739
440.1285331.1780.121058
450.1323291.21280.1143
460.1515051.38860.084319
470.1807431.65650.050672
480.2227032.04110.02219


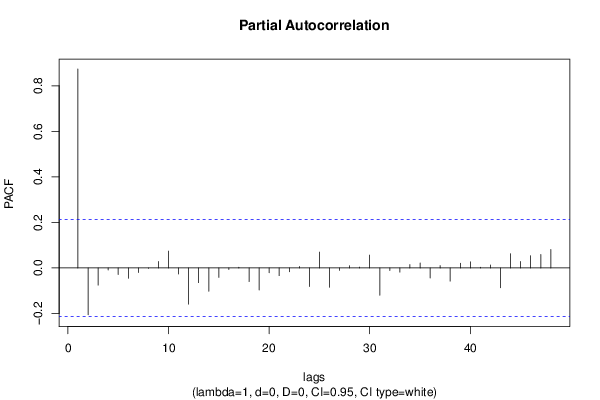
Partial Autocorrelation Function
Time lag kPACF(k)T-STATP-value
10.873818.00860
2-0.205542-1.88380.031524
3-0.075415-0.69120.245676
4-0.009268-0.08490.466254
5-0.029005-0.26580.395508
6-0.04492-0.41170.340803
7-0.020302-0.18610.426419
8-0.001942-0.01780.49292
90.0282490.25890.398169
100.0739350.67760.249936
11-0.026974-0.24720.402671
12-0.158985-1.45710.074405
13-0.06453-0.59140.277913
14-0.102468-0.93910.175177
15-0.041544-0.38080.352173
16-0.006646-0.06090.475789
170.0034180.03130.487541
18-0.059932-0.54930.292133
19-0.096595-0.88530.18926
20-0.020766-0.19030.424759
21-0.033849-0.31020.378577
22-0.017071-0.15650.438022
230.0065910.06040.475989
24-0.081827-0.750.227689
250.0694230.63630.263166
26-0.084514-0.77460.22038
27-0.010588-0.0970.461464
280.0093530.08570.465946
290.0035750.03280.486968
300.0563380.51630.303486
31-0.12012-1.10090.137039
32-0.01121-0.10270.459206
33-0.018451-0.16910.433061
340.0147370.13510.446443
350.0220520.20210.42016
36-0.044311-0.40610.342846
370.0104230.09550.46206
38-0.058001-0.53160.298207
390.0206110.18890.425312
400.026890.24650.402967
410.0034280.03140.487506
420.0130730.11980.452458
43-0.087061-0.79790.213581
440.0624610.57250.28427
450.0282890.25930.398031
460.0533360.48880.313118
470.0593950.54440.293815
480.080740.740.230683

\begin{tabular}{lllllllll}
\hline
Partial Autocorrelation Function \tabularnewline
Time lag k & PACF(k) & T-STAT & P-value \tabularnewline
1 & 0.87381 & 8.0086 & 0 \tabularnewline
2 & -0.205542 & -1.8838 & 0.031524 \tabularnewline
3 & -0.075415 & -0.6912 & 0.245676 \tabularnewline
4 & -0.009268 & -0.0849 & 0.466254 \tabularnewline
5 & -0.029005 & -0.2658 & 0.395508 \tabularnewline
6 & -0.04492 & -0.4117 & 0.340803 \tabularnewline
7 & -0.020302 & -0.1861 & 0.426419 \tabularnewline
8 & -0.001942 & -0.0178 & 0.49292 \tabularnewline
9 & 0.028249 & 0.2589 & 0.398169 \tabularnewline
10 & 0.073935 & 0.6776 & 0.249936 \tabularnewline
11 & -0.026974 & -0.2472 & 0.402671 \tabularnewline
12 & -0.158985 & -1.4571 & 0.074405 \tabularnewline
13 & -0.06453 & -0.5914 & 0.277913 \tabularnewline
14 & -0.102468 & -0.9391 & 0.175177 \tabularnewline
15 & -0.041544 & -0.3808 & 0.352173 \tabularnewline
16 & -0.006646 & -0.0609 & 0.475789 \tabularnewline
17 & 0.003418 & 0.0313 & 0.487541 \tabularnewline
18 & -0.059932 & -0.5493 & 0.292133 \tabularnewline
19 & -0.096595 & -0.8853 & 0.18926 \tabularnewline
20 & -0.020766 & -0.1903 & 0.424759 \tabularnewline
21 & -0.033849 & -0.3102 & 0.378577 \tabularnewline
22 & -0.017071 & -0.1565 & 0.438022 \tabularnewline
23 & 0.006591 & 0.0604 & 0.475989 \tabularnewline
24 & -0.081827 & -0.75 & 0.227689 \tabularnewline
25 & 0.069423 & 0.6363 & 0.263166 \tabularnewline
26 & -0.084514 & -0.7746 & 0.22038 \tabularnewline
27 & -0.010588 & -0.097 & 0.461464 \tabularnewline
28 & 0.009353 & 0.0857 & 0.465946 \tabularnewline
29 & 0.003575 & 0.0328 & 0.486968 \tabularnewline
30 & 0.056338 & 0.5163 & 0.303486 \tabularnewline
31 & -0.12012 & -1.1009 & 0.137039 \tabularnewline
32 & -0.01121 & -0.1027 & 0.459206 \tabularnewline
33 & -0.018451 & -0.1691 & 0.433061 \tabularnewline
34 & 0.014737 & 0.1351 & 0.446443 \tabularnewline
35 & 0.022052 & 0.2021 & 0.42016 \tabularnewline
36 & -0.044311 & -0.4061 & 0.342846 \tabularnewline
37 & 0.010423 & 0.0955 & 0.46206 \tabularnewline
38 & -0.058001 & -0.5316 & 0.298207 \tabularnewline
39 & 0.020611 & 0.1889 & 0.425312 \tabularnewline
40 & 0.02689 & 0.2465 & 0.402967 \tabularnewline
41 & 0.003428 & 0.0314 & 0.487506 \tabularnewline
42 & 0.013073 & 0.1198 & 0.452458 \tabularnewline
43 & -0.087061 & -0.7979 & 0.213581 \tabularnewline
44 & 0.062461 & 0.5725 & 0.28427 \tabularnewline
45 & 0.028289 & 0.2593 & 0.398031 \tabularnewline
46 & 0.053336 & 0.4888 & 0.313118 \tabularnewline
47 & 0.059395 & 0.5444 & 0.293815 \tabularnewline
48 & 0.08074 & 0.74 & 0.230683 \tabularnewline
\hline
\end{tabular}
%Source: https://freestatistics.org/blog/index.php?pk=&T=2

[TABLE]
[ROW][C]Partial Autocorrelation Function[/C][/ROW]
[ROW][C]Time lag k[/C][C]PACF(k)[/C][C]T-STAT[/C][C]P-value[/C][/ROW]
[ROW][C]1[/C][C]0.87381[/C][C]8.0086[/C][C]0[/C][/ROW]
[ROW][C]2[/C][C]-0.205542[/C][C]-1.8838[/C][C]0.031524[/C][/ROW]
[ROW][C]3[/C][C]-0.075415[/C][C]-0.6912[/C][C]0.245676[/C][/ROW]
[ROW][C]4[/C][C]-0.009268[/C][C]-0.0849[/C][C]0.466254[/C][/ROW]
[ROW][C]5[/C][C]-0.029005[/C][C]-0.2658[/C][C]0.395508[/C][/ROW]
[ROW][C]6[/C][C]-0.04492[/C][C]-0.4117[/C][C]0.340803[/C][/ROW]
[ROW][C]7[/C][C]-0.020302[/C][C]-0.1861[/C][C]0.426419[/C][/ROW]
[ROW][C]8[/C][C]-0.001942[/C][C]-0.0178[/C][C]0.49292[/C][/ROW]
[ROW][C]9[/C][C]0.028249[/C][C]0.2589[/C][C]0.398169[/C][/ROW]
[ROW][C]10[/C][C]0.073935[/C][C]0.6776[/C][C]0.249936[/C][/ROW]
[ROW][C]11[/C][C]-0.026974[/C][C]-0.2472[/C][C]0.402671[/C][/ROW]
[ROW][C]12[/C][C]-0.158985[/C][C]-1.4571[/C][C]0.074405[/C][/ROW]
[ROW][C]13[/C][C]-0.06453[/C][C]-0.5914[/C][C]0.277913[/C][/ROW]
[ROW][C]14[/C][C]-0.102468[/C][C]-0.9391[/C][C]0.175177[/C][/ROW]
[ROW][C]15[/C][C]-0.041544[/C][C]-0.3808[/C][C]0.352173[/C][/ROW]
[ROW][C]16[/C][C]-0.006646[/C][C]-0.0609[/C][C]0.475789[/C][/ROW]
[ROW][C]17[/C][C]0.003418[/C][C]0.0313[/C][C]0.487541[/C][/ROW]
[ROW][C]18[/C][C]-0.059932[/C][C]-0.5493[/C][C]0.292133[/C][/ROW]
[ROW][C]19[/C][C]-0.096595[/C][C]-0.8853[/C][C]0.18926[/C][/ROW]
[ROW][C]20[/C][C]-0.020766[/C][C]-0.1903[/C][C]0.424759[/C][/ROW]
[ROW][C]21[/C][C]-0.033849[/C][C]-0.3102[/C][C]0.378577[/C][/ROW]
[ROW][C]22[/C][C]-0.017071[/C][C]-0.1565[/C][C]0.438022[/C][/ROW]
[ROW][C]23[/C][C]0.006591[/C][C]0.0604[/C][C]0.475989[/C][/ROW]
[ROW][C]24[/C][C]-0.081827[/C][C]-0.75[/C][C]0.227689[/C][/ROW]
[ROW][C]25[/C][C]0.069423[/C][C]0.6363[/C][C]0.263166[/C][/ROW]
[ROW][C]26[/C][C]-0.084514[/C][C]-0.7746[/C][C]0.22038[/C][/ROW]
[ROW][C]27[/C][C]-0.010588[/C][C]-0.097[/C][C]0.461464[/C][/ROW]
[ROW][C]28[/C][C]0.009353[/C][C]0.0857[/C][C]0.465946[/C][/ROW]
[ROW][C]29[/C][C]0.003575[/C][C]0.0328[/C][C]0.486968[/C][/ROW]
[ROW][C]30[/C][C]0.056338[/C][C]0.5163[/C][C]0.303486[/C][/ROW]
[ROW][C]31[/C][C]-0.12012[/C][C]-1.1009[/C][C]0.137039[/C][/ROW]
[ROW][C]32[/C][C]-0.01121[/C][C]-0.1027[/C][C]0.459206[/C][/ROW]
[ROW][C]33[/C][C]-0.018451[/C][C]-0.1691[/C][C]0.433061[/C][/ROW]
[ROW][C]34[/C][C]0.014737[/C][C]0.1351[/C][C]0.446443[/C][/ROW]
[ROW][C]35[/C][C]0.022052[/C][C]0.2021[/C][C]0.42016[/C][/ROW]
[ROW][C]36[/C][C]-0.044311[/C][C]-0.4061[/C][C]0.342846[/C][/ROW]
[ROW][C]37[/C][C]0.010423[/C][C]0.0955[/C][C]0.46206[/C][/ROW]
[ROW][C]38[/C][C]-0.058001[/C][C]-0.5316[/C][C]0.298207[/C][/ROW]
[ROW][C]39[/C][C]0.020611[/C][C]0.1889[/C][C]0.425312[/C][/ROW]
[ROW][C]40[/C][C]0.02689[/C][C]0.2465[/C][C]0.402967[/C][/ROW]
[ROW][C]41[/C][C]0.003428[/C][C]0.0314[/C][C]0.487506[/C][/ROW]
[ROW][C]42[/C][C]0.013073[/C][C]0.1198[/C][C]0.452458[/C][/ROW]
[ROW][C]43[/C][C]-0.087061[/C][C]-0.7979[/C][C]0.213581[/C][/ROW]
[ROW][C]44[/C][C]0.062461[/C][C]0.5725[/C][C]0.28427[/C][/ROW]
[ROW][C]45[/C][C]0.028289[/C][C]0.2593[/C][C]0.398031[/C][/ROW]
[ROW][C]46[/C][C]0.053336[/C][C]0.4888[/C][C]0.313118[/C][/ROW]
[ROW][C]47[/C][C]0.059395[/C][C]0.5444[/C][C]0.293815[/C][/ROW]
[ROW][C]48[/C][C]0.08074[/C][C]0.74[/C][C]0.230683[/C][/ROW]
[/TABLE]
Source: https://freestatistics.org/blog/index.php?pk=&T=2

Globally Unique Identifier (entire table): ba.freestatistics.org/blog/index.php?pk=&T=2

As an alternative you can also use a QR Code:  

The GUIDs for individual cells are displayed in the table below:

Partial Autocorrelation Function
Time lag kPACF(k)T-STATP-value
10.873818.00860
2-0.205542-1.88380.031524
3-0.075415-0.69120.245676
4-0.009268-0.08490.466254
5-0.029005-0.26580.395508
6-0.04492-0.41170.340803
7-0.020302-0.18610.426419
8-0.001942-0.01780.49292
90.0282490.25890.398169
100.0739350.67760.249936
11-0.026974-0.24720.402671
12-0.158985-1.45710.074405
13-0.06453-0.59140.277913
14-0.102468-0.93910.175177
15-0.041544-0.38080.352173
16-0.006646-0.06090.475789
170.0034180.03130.487541
18-0.059932-0.54930.292133
19-0.096595-0.88530.18926
20-0.020766-0.19030.424759
21-0.033849-0.31020.378577
22-0.017071-0.15650.438022
230.0065910.06040.475989
24-0.081827-0.750.227689
250.0694230.63630.263166
26-0.084514-0.77460.22038
27-0.010588-0.0970.461464
280.0093530.08570.465946
290.0035750.03280.486968
300.0563380.51630.303486
31-0.12012-1.10090.137039
32-0.01121-0.10270.459206
33-0.018451-0.16910.433061
340.0147370.13510.446443
350.0220520.20210.42016
36-0.044311-0.40610.342846
370.0104230.09550.46206
38-0.058001-0.53160.298207
390.0206110.18890.425312
400.026890.24650.402967
410.0034280.03140.487506
420.0130730.11980.452458
43-0.087061-0.79790.213581
440.0624610.57250.28427
450.0282890.25930.398031
460.0533360.48880.313118
470.0593950.54440.293815
480.080740.740.230683


Parameters (Session):
par1 = 48 ; par2 = 1 ; par3 = 0 ; par4 = 0 ; par5 = 12 ; par6 = White Noise ; par7 = 0.95 ;
Parameters (R input):
par1 = 48 ; par2 = 1 ; par3 = 0 ; par4 = 0 ; par5 = 12 ; par6 = White Noise ; par7 = 0.95 ; par8 = ;
R code (references can be found in the software module):
if (par1 == 'Default') {
par1 = 10*log10(length(x))
} else {
par1 <- as.numeric(par1)
}
par2 <- as.numeric(par2)
par3 <- as.numeric(par3)
par4 <- as.numeric(par4)
par5 <- as.numeric(par5)
if (par6 == 'White Noise') par6 <- 'white' else par6 <- 'ma'
par7 <- as.numeric(par7)
if (par8 != '') par8 <- as.numeric(par8)
x <- na.omit(x)
ox <- x
if (par8 == '') {
if (par2 == 0) {
x <- log(x)
} else {
x <- (x ^ par2 - 1) / par2
}
} else {
x <- log(x,base=par8)
}
if (par3 > 0) x <- diff(x,lag=1,difference=par3)
if (par4 > 0) x <- diff(x,lag=par5,difference=par4)
bitmap(file='picts.png')
op <- par(mfrow=c(2,1))
plot(ox,type='l',main='Original Time Series',xlab='time',ylab='value')
if (par8=='') {
mytitle <- paste('Working Time Series (lambda=',par2,', d=',par3,', D=',par4,')',sep='')
mysub <- paste('(lambda=',par2,', d=',par3,', D=',par4,', CI=', par7, ', CI type=',par6,')',sep='')
} else {
mytitle <- paste('Working Time Series (base=',par8,', d=',par3,', D=',par4,')',sep='')
mysub <- paste('(base=',par8,', d=',par3,', D=',par4,', CI=', par7, ', CI type=',par6,')',sep='')
}
plot(x,type='l', main=mytitle,xlab='time',ylab='value')
par(op)
dev.off()
bitmap(file='pic1.png')
racf <- acf(x, par1, main='Autocorrelation', xlab='time lag', ylab='ACF', ci.type=par6, ci=par7, sub=mysub)
dev.off()
bitmap(file='pic2.png')
rpacf <- pacf(x,par1,main='Partial Autocorrelation',xlab='lags',ylab='PACF',sub=mysub)
dev.off()
(myacf <- c(racf$acf))
(mypacf <- c(rpacf$acf))
lengthx <- length(x)
sqrtn <- sqrt(lengthx)
load(file='createtable')
a<-table.start()
a<-table.row.start(a)
a<-table.element(a,'Autocorrelation Function',4,TRUE)
a<-table.row.end(a)
a<-table.row.start(a)
a<-table.element(a,'Time lag k',header=TRUE)
a<-table.element(a,hyperlink('basics.htm','ACF(k)','click here for more information about the Autocorrelation Function'),header=TRUE)
a<-table.element(a,'T-STAT',header=TRUE)
a<-table.element(a,'P-value',header=TRUE)
a<-table.row.end(a)
for (i in 2:(par1+1)) {
a<-table.row.start(a)
a<-table.element(a,i-1,header=TRUE)
a<-table.element(a,round(myacf[i],6))
mytstat <- myacf[i]*sqrtn
a<-table.element(a,round(mytstat,4))
a<-table.element(a,round(1-pt(abs(mytstat),lengthx),6))
a<-table.row.end(a)
}
a<-table.end(a)
table.save(a,file='mytable.tab')
a<-table.start()
a<-table.row.start(a)
a<-table.element(a,'Partial Autocorrelation Function',4,TRUE)
a<-table.row.end(a)
a<-table.row.start(a)
a<-table.element(a,'Time lag k',header=TRUE)
a<-table.element(a,hyperlink('basics.htm','PACF(k)','click here for more information about the Partial Autocorrelation Function'),header=TRUE)
a<-table.element(a,'T-STAT',header=TRUE)
a<-table.element(a,'P-value',header=TRUE)
a<-table.row.end(a)
for (i in 1:par1) {
a<-table.row.start(a)
a<-table.element(a,i,header=TRUE)
a<-table.element(a,round(mypacf[i],6))
mytstat <- mypacf[i]*sqrtn
a<-table.element(a,round(mytstat,4))
a<-table.element(a,round(1-pt(abs(mytstat),lengthx),6))
a<-table.row.end(a)
}
a<-table.end(a)
table.save(a,file='mytable1.tab')