Free Statistics

of Irreproducible Research!

Author's title

Autocorrelatie zonder trend-consumptieprijsindex kleding&schoeisel-Charlott...

Author*Unverified author*
R Software Modulerwasp_autocorrelation.wasp
Title produced by software(Partial) Autocorrelation Function
Date of computationThu, 16 Mar 2017 12:21:46 +0000
Cite this page as followsStatistical Computations at FreeStatistics.org, Office for Research Development and Education, URL https://freestatistics.org/blog/index.php?v=date/2017/Mar/16/t148966695945fssjaimpdzwe6.htm/, Retrieved Mon, 13 May 2024 22:28:56 +0200
Statistical Computations at FreeStatistics.org, Office for Research Development and Education, URL https://freestatistics.org/blog/index.php?pk=, Retrieved Mon, 13 May 2024 22:28:56 +0200
QR Codes:

Original text written by user:
IsPrivate?No (this computation is public)
User-defined keywords
Estimated Impact0
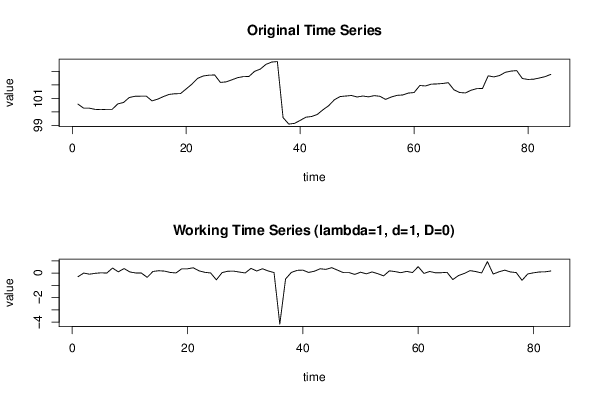
Dataseries X:
100.57
100.27
100.27
100.18
100.16
100.18
100.18
100.59
100.69
101.06
101.15
101.16
101.16
100.81
100.94
101.13
101.29
101.34
101.35
101.7
102.05
102.48
102.66
102.72
102.73
102.18
102.22
102.37
102.53
102.61
102.62
103
103.17
103.52
103.69
103.73
99.57
99.09
99.14
99.36
99.6
99.65
99.8
100.15
100.45
100.89
101.13
101.17
101.21
101.1
101.17
101.11
101.2
101.15
100.92
101.1
101.22
101.25
101.39
101.43
101.95
101.92
102.05
102.07
102.1
102.16
101.63
101.43
101.4
101.6
101.72
101.73
102.67
102.59
102.69
102.93
103.02
103.06
102.47
102.4
102.42
102.51
102.61
102.78


Summary of computational transaction
Raw Inputview raw input (R code)
Raw Outputview raw output of R engine
Computing time2 seconds
R Server'Gwilym Jenkins' @ jenkins.wessa.net

\begin{tabular}{lllllllll}
\hline
Summary of computational transaction \tabularnewline
Raw Input & view raw input (R code)  \tabularnewline
Raw Output & view raw output of R engine  \tabularnewline
Computing time & 2 seconds \tabularnewline
R Server & 'Gwilym Jenkins' @ jenkins.wessa.net \tabularnewline
\hline
\end{tabular}
%Source: https://freestatistics.org/blog/index.php?pk=&T=0

[TABLE]
[ROW][C]Summary of computational transaction[/C][/ROW]
[ROW][C]Raw Input[/C][C]view raw input (R code) [/C][/ROW]
[ROW][C]Raw Output[/C][C]view raw output of R engine [/C][/ROW]
[ROW][C]Computing time[/C][C]2 seconds[/C][/ROW]
[ROW][C]R Server[/C][C]'Gwilym Jenkins' @ jenkins.wessa.net[/C][/ROW]
[/TABLE]
Source: https://freestatistics.org/blog/index.php?pk=&T=0

Globally Unique Identifier (entire table): ba.freestatistics.org/blog/index.php?pk=&T=0

As an alternative you can also use a QR Code:  

The GUIDs for individual cells are displayed in the table below:

Summary of computational transaction
Raw Inputview raw input (R code)
Raw Outputview raw output of R engine
Computing time2 seconds
R Server'Gwilym Jenkins' @ jenkins.wessa.net


Autocorrelation Function
Time lag kACF(k)T-STATP-value
10.1381021.25820.105929
20.0012490.01140.495473
3-0.096436-0.87860.191085
4-0.091677-0.83520.202995
5-0.07074-0.64450.260524
6-0.113255-1.03180.152582
7-0.072579-0.66120.255149
8-0.107152-0.97620.1659
9-0.119544-1.08910.139632
10-0.020687-0.18850.425485
110.1347141.22730.111589
120.1246491.13560.129695
130.0584890.53290.297778
14-0.008288-0.07550.469997
15-0.053316-0.48570.314218
16-0.081008-0.7380.231293
17-0.026659-0.24290.404352
180.0022620.02060.491803
19-0.03572-0.32540.37284
20-0.058319-0.53130.298311
21-0.052187-0.47540.317858
22-0.037465-0.34130.366862
230.0574610.52350.301013
24-0.026351-0.24010.405433
250.0401280.36560.357801
26-0.009812-0.08940.464492
27-0.043939-0.40030.344979
28-0.011045-0.10060.460046
29-0.031249-0.28470.388296
300.108180.98560.163605
310.0525690.47890.316626
320.0113940.10380.458789
33-0.029174-0.26580.395531
34-0.021917-0.19970.421113
350.0227620.20740.418112
36-0.144319-1.31480.096098
370.0304140.27710.391204
38-0.005491-0.050.480113
39-0.028922-0.26350.396412
40-0.005158-0.0470.481317
410.0545960.49740.310114
420.1181761.07660.142382
430.0247530.22550.411069
44-0.0084-0.07650.469592
45-0.035651-0.32480.373076
46-0.030189-0.2750.391987
47-0.081246-0.74020.230638
480.0110220.10040.460129

\begin{tabular}{lllllllll}
\hline
Autocorrelation Function \tabularnewline
Time lag k & ACF(k) & T-STAT & P-value \tabularnewline
1 & 0.138102 & 1.2582 & 0.105929 \tabularnewline
2 & 0.001249 & 0.0114 & 0.495473 \tabularnewline
3 & -0.096436 & -0.8786 & 0.191085 \tabularnewline
4 & -0.091677 & -0.8352 & 0.202995 \tabularnewline
5 & -0.07074 & -0.6445 & 0.260524 \tabularnewline
6 & -0.113255 & -1.0318 & 0.152582 \tabularnewline
7 & -0.072579 & -0.6612 & 0.255149 \tabularnewline
8 & -0.107152 & -0.9762 & 0.1659 \tabularnewline
9 & -0.119544 & -1.0891 & 0.139632 \tabularnewline
10 & -0.020687 & -0.1885 & 0.425485 \tabularnewline
11 & 0.134714 & 1.2273 & 0.111589 \tabularnewline
12 & 0.124649 & 1.1356 & 0.129695 \tabularnewline
13 & 0.058489 & 0.5329 & 0.297778 \tabularnewline
14 & -0.008288 & -0.0755 & 0.469997 \tabularnewline
15 & -0.053316 & -0.4857 & 0.314218 \tabularnewline
16 & -0.081008 & -0.738 & 0.231293 \tabularnewline
17 & -0.026659 & -0.2429 & 0.404352 \tabularnewline
18 & 0.002262 & 0.0206 & 0.491803 \tabularnewline
19 & -0.03572 & -0.3254 & 0.37284 \tabularnewline
20 & -0.058319 & -0.5313 & 0.298311 \tabularnewline
21 & -0.052187 & -0.4754 & 0.317858 \tabularnewline
22 & -0.037465 & -0.3413 & 0.366862 \tabularnewline
23 & 0.057461 & 0.5235 & 0.301013 \tabularnewline
24 & -0.026351 & -0.2401 & 0.405433 \tabularnewline
25 & 0.040128 & 0.3656 & 0.357801 \tabularnewline
26 & -0.009812 & -0.0894 & 0.464492 \tabularnewline
27 & -0.043939 & -0.4003 & 0.344979 \tabularnewline
28 & -0.011045 & -0.1006 & 0.460046 \tabularnewline
29 & -0.031249 & -0.2847 & 0.388296 \tabularnewline
30 & 0.10818 & 0.9856 & 0.163605 \tabularnewline
31 & 0.052569 & 0.4789 & 0.316626 \tabularnewline
32 & 0.011394 & 0.1038 & 0.458789 \tabularnewline
33 & -0.029174 & -0.2658 & 0.395531 \tabularnewline
34 & -0.021917 & -0.1997 & 0.421113 \tabularnewline
35 & 0.022762 & 0.2074 & 0.418112 \tabularnewline
36 & -0.144319 & -1.3148 & 0.096098 \tabularnewline
37 & 0.030414 & 0.2771 & 0.391204 \tabularnewline
38 & -0.005491 & -0.05 & 0.480113 \tabularnewline
39 & -0.028922 & -0.2635 & 0.396412 \tabularnewline
40 & -0.005158 & -0.047 & 0.481317 \tabularnewline
41 & 0.054596 & 0.4974 & 0.310114 \tabularnewline
42 & 0.118176 & 1.0766 & 0.142382 \tabularnewline
43 & 0.024753 & 0.2255 & 0.411069 \tabularnewline
44 & -0.0084 & -0.0765 & 0.469592 \tabularnewline
45 & -0.035651 & -0.3248 & 0.373076 \tabularnewline
46 & -0.030189 & -0.275 & 0.391987 \tabularnewline
47 & -0.081246 & -0.7402 & 0.230638 \tabularnewline
48 & 0.011022 & 0.1004 & 0.460129 \tabularnewline
\hline
\end{tabular}
%Source: https://freestatistics.org/blog/index.php?pk=&T=1

[TABLE]
[ROW][C]Autocorrelation Function[/C][/ROW]
[ROW][C]Time lag k[/C][C]ACF(k)[/C][C]T-STAT[/C][C]P-value[/C][/ROW]
[ROW][C]1[/C][C]0.138102[/C][C]1.2582[/C][C]0.105929[/C][/ROW]
[ROW][C]2[/C][C]0.001249[/C][C]0.0114[/C][C]0.495473[/C][/ROW]
[ROW][C]3[/C][C]-0.096436[/C][C]-0.8786[/C][C]0.191085[/C][/ROW]
[ROW][C]4[/C][C]-0.091677[/C][C]-0.8352[/C][C]0.202995[/C][/ROW]
[ROW][C]5[/C][C]-0.07074[/C][C]-0.6445[/C][C]0.260524[/C][/ROW]
[ROW][C]6[/C][C]-0.113255[/C][C]-1.0318[/C][C]0.152582[/C][/ROW]
[ROW][C]7[/C][C]-0.072579[/C][C]-0.6612[/C][C]0.255149[/C][/ROW]
[ROW][C]8[/C][C]-0.107152[/C][C]-0.9762[/C][C]0.1659[/C][/ROW]
[ROW][C]9[/C][C]-0.119544[/C][C]-1.0891[/C][C]0.139632[/C][/ROW]
[ROW][C]10[/C][C]-0.020687[/C][C]-0.1885[/C][C]0.425485[/C][/ROW]
[ROW][C]11[/C][C]0.134714[/C][C]1.2273[/C][C]0.111589[/C][/ROW]
[ROW][C]12[/C][C]0.124649[/C][C]1.1356[/C][C]0.129695[/C][/ROW]
[ROW][C]13[/C][C]0.058489[/C][C]0.5329[/C][C]0.297778[/C][/ROW]
[ROW][C]14[/C][C]-0.008288[/C][C]-0.0755[/C][C]0.469997[/C][/ROW]
[ROW][C]15[/C][C]-0.053316[/C][C]-0.4857[/C][C]0.314218[/C][/ROW]
[ROW][C]16[/C][C]-0.081008[/C][C]-0.738[/C][C]0.231293[/C][/ROW]
[ROW][C]17[/C][C]-0.026659[/C][C]-0.2429[/C][C]0.404352[/C][/ROW]
[ROW][C]18[/C][C]0.002262[/C][C]0.0206[/C][C]0.491803[/C][/ROW]
[ROW][C]19[/C][C]-0.03572[/C][C]-0.3254[/C][C]0.37284[/C][/ROW]
[ROW][C]20[/C][C]-0.058319[/C][C]-0.5313[/C][C]0.298311[/C][/ROW]
[ROW][C]21[/C][C]-0.052187[/C][C]-0.4754[/C][C]0.317858[/C][/ROW]
[ROW][C]22[/C][C]-0.037465[/C][C]-0.3413[/C][C]0.366862[/C][/ROW]
[ROW][C]23[/C][C]0.057461[/C][C]0.5235[/C][C]0.301013[/C][/ROW]
[ROW][C]24[/C][C]-0.026351[/C][C]-0.2401[/C][C]0.405433[/C][/ROW]
[ROW][C]25[/C][C]0.040128[/C][C]0.3656[/C][C]0.357801[/C][/ROW]
[ROW][C]26[/C][C]-0.009812[/C][C]-0.0894[/C][C]0.464492[/C][/ROW]
[ROW][C]27[/C][C]-0.043939[/C][C]-0.4003[/C][C]0.344979[/C][/ROW]
[ROW][C]28[/C][C]-0.011045[/C][C]-0.1006[/C][C]0.460046[/C][/ROW]
[ROW][C]29[/C][C]-0.031249[/C][C]-0.2847[/C][C]0.388296[/C][/ROW]
[ROW][C]30[/C][C]0.10818[/C][C]0.9856[/C][C]0.163605[/C][/ROW]
[ROW][C]31[/C][C]0.052569[/C][C]0.4789[/C][C]0.316626[/C][/ROW]
[ROW][C]32[/C][C]0.011394[/C][C]0.1038[/C][C]0.458789[/C][/ROW]
[ROW][C]33[/C][C]-0.029174[/C][C]-0.2658[/C][C]0.395531[/C][/ROW]
[ROW][C]34[/C][C]-0.021917[/C][C]-0.1997[/C][C]0.421113[/C][/ROW]
[ROW][C]35[/C][C]0.022762[/C][C]0.2074[/C][C]0.418112[/C][/ROW]
[ROW][C]36[/C][C]-0.144319[/C][C]-1.3148[/C][C]0.096098[/C][/ROW]
[ROW][C]37[/C][C]0.030414[/C][C]0.2771[/C][C]0.391204[/C][/ROW]
[ROW][C]38[/C][C]-0.005491[/C][C]-0.05[/C][C]0.480113[/C][/ROW]
[ROW][C]39[/C][C]-0.028922[/C][C]-0.2635[/C][C]0.396412[/C][/ROW]
[ROW][C]40[/C][C]-0.005158[/C][C]-0.047[/C][C]0.481317[/C][/ROW]
[ROW][C]41[/C][C]0.054596[/C][C]0.4974[/C][C]0.310114[/C][/ROW]
[ROW][C]42[/C][C]0.118176[/C][C]1.0766[/C][C]0.142382[/C][/ROW]
[ROW][C]43[/C][C]0.024753[/C][C]0.2255[/C][C]0.411069[/C][/ROW]
[ROW][C]44[/C][C]-0.0084[/C][C]-0.0765[/C][C]0.469592[/C][/ROW]
[ROW][C]45[/C][C]-0.035651[/C][C]-0.3248[/C][C]0.373076[/C][/ROW]
[ROW][C]46[/C][C]-0.030189[/C][C]-0.275[/C][C]0.391987[/C][/ROW]
[ROW][C]47[/C][C]-0.081246[/C][C]-0.7402[/C][C]0.230638[/C][/ROW]
[ROW][C]48[/C][C]0.011022[/C][C]0.1004[/C][C]0.460129[/C][/ROW]
[/TABLE]
Source: https://freestatistics.org/blog/index.php?pk=&T=1

Globally Unique Identifier (entire table): ba.freestatistics.org/blog/index.php?pk=&T=1

As an alternative you can also use a QR Code:  

The GUIDs for individual cells are displayed in the table below:

Autocorrelation Function
Time lag kACF(k)T-STATP-value
10.1381021.25820.105929
20.0012490.01140.495473
3-0.096436-0.87860.191085
4-0.091677-0.83520.202995
5-0.07074-0.64450.260524
6-0.113255-1.03180.152582
7-0.072579-0.66120.255149
8-0.107152-0.97620.1659
9-0.119544-1.08910.139632
10-0.020687-0.18850.425485
110.1347141.22730.111589
120.1246491.13560.129695
130.0584890.53290.297778
14-0.008288-0.07550.469997
15-0.053316-0.48570.314218
16-0.081008-0.7380.231293
17-0.026659-0.24290.404352
180.0022620.02060.491803
19-0.03572-0.32540.37284
20-0.058319-0.53130.298311
21-0.052187-0.47540.317858
22-0.037465-0.34130.366862
230.0574610.52350.301013
24-0.026351-0.24010.405433
250.0401280.36560.357801
26-0.009812-0.08940.464492
27-0.043939-0.40030.344979
28-0.011045-0.10060.460046
29-0.031249-0.28470.388296
300.108180.98560.163605
310.0525690.47890.316626
320.0113940.10380.458789
33-0.029174-0.26580.395531
34-0.021917-0.19970.421113
350.0227620.20740.418112
36-0.144319-1.31480.096098
370.0304140.27710.391204
38-0.005491-0.050.480113
39-0.028922-0.26350.396412
40-0.005158-0.0470.481317
410.0545960.49740.310114
420.1181761.07660.142382
430.0247530.22550.411069
44-0.0084-0.07650.469592
45-0.035651-0.32480.373076
46-0.030189-0.2750.391987
47-0.081246-0.74020.230638
480.0110220.10040.460129


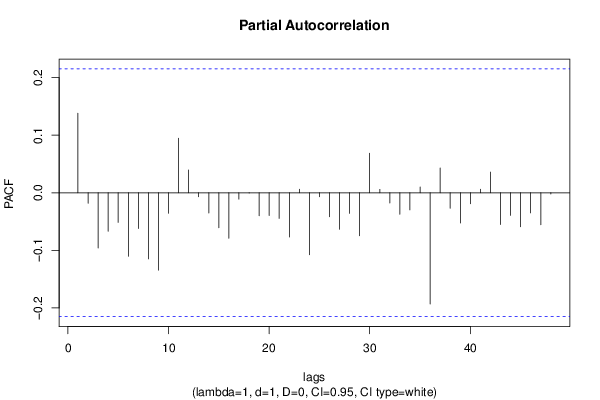
Partial Autocorrelation Function
Time lag kPACF(k)T-STATP-value
10.1381021.25820.105929
2-0.018169-0.16550.434464
3-0.095963-0.87430.192248
4-0.06693-0.60980.271844
5-0.051412-0.46840.320367
6-0.110092-1.0030.15939
7-0.062163-0.56630.286347
8-0.114825-1.04610.149275
9-0.134383-1.22430.112154
10-0.035612-0.32440.373212
110.0947610.86330.195225
120.0394960.35980.359944
13-0.006736-0.06140.475608
14-0.035009-0.31890.375284
15-0.060771-0.55360.290654
16-0.07905-0.72020.236719
17-0.01097-0.09990.460317
18-0.000477-0.00430.498273
19-0.039905-0.36350.35856
20-0.039461-0.35950.360064
21-0.044472-0.40520.3432
22-0.076879-0.70040.242818
230.006270.05710.477293
24-0.107515-0.97950.165088
25-0.006913-0.0630.474968
26-0.04151-0.37820.353133
27-0.06346-0.57820.282363
28-0.035691-0.32520.372938
29-0.074606-0.67970.249294
300.0688620.62740.266072
310.0060060.05470.478248
32-0.017773-0.16190.43588
33-0.037357-0.34030.367232
34-0.029675-0.27040.393779
350.0101760.09270.463181
36-0.193218-1.76030.041021
370.0430910.39260.347819
38-0.026813-0.24430.40381
39-0.052351-0.47690.31733
40-0.018964-0.17280.431626
410.0061140.05570.477856
420.035880.32690.37229
43-0.054974-0.50080.308904
44-0.039236-0.35750.360829
45-0.058924-0.53680.296414
46-0.034855-0.31750.375814
47-0.055397-0.50470.307557
48-0.002165-0.01970.492156

\begin{tabular}{lllllllll}
\hline
Partial Autocorrelation Function \tabularnewline
Time lag k & PACF(k) & T-STAT & P-value \tabularnewline
1 & 0.138102 & 1.2582 & 0.105929 \tabularnewline
2 & -0.018169 & -0.1655 & 0.434464 \tabularnewline
3 & -0.095963 & -0.8743 & 0.192248 \tabularnewline
4 & -0.06693 & -0.6098 & 0.271844 \tabularnewline
5 & -0.051412 & -0.4684 & 0.320367 \tabularnewline
6 & -0.110092 & -1.003 & 0.15939 \tabularnewline
7 & -0.062163 & -0.5663 & 0.286347 \tabularnewline
8 & -0.114825 & -1.0461 & 0.149275 \tabularnewline
9 & -0.134383 & -1.2243 & 0.112154 \tabularnewline
10 & -0.035612 & -0.3244 & 0.373212 \tabularnewline
11 & 0.094761 & 0.8633 & 0.195225 \tabularnewline
12 & 0.039496 & 0.3598 & 0.359944 \tabularnewline
13 & -0.006736 & -0.0614 & 0.475608 \tabularnewline
14 & -0.035009 & -0.3189 & 0.375284 \tabularnewline
15 & -0.060771 & -0.5536 & 0.290654 \tabularnewline
16 & -0.07905 & -0.7202 & 0.236719 \tabularnewline
17 & -0.01097 & -0.0999 & 0.460317 \tabularnewline
18 & -0.000477 & -0.0043 & 0.498273 \tabularnewline
19 & -0.039905 & -0.3635 & 0.35856 \tabularnewline
20 & -0.039461 & -0.3595 & 0.360064 \tabularnewline
21 & -0.044472 & -0.4052 & 0.3432 \tabularnewline
22 & -0.076879 & -0.7004 & 0.242818 \tabularnewline
23 & 0.00627 & 0.0571 & 0.477293 \tabularnewline
24 & -0.107515 & -0.9795 & 0.165088 \tabularnewline
25 & -0.006913 & -0.063 & 0.474968 \tabularnewline
26 & -0.04151 & -0.3782 & 0.353133 \tabularnewline
27 & -0.06346 & -0.5782 & 0.282363 \tabularnewline
28 & -0.035691 & -0.3252 & 0.372938 \tabularnewline
29 & -0.074606 & -0.6797 & 0.249294 \tabularnewline
30 & 0.068862 & 0.6274 & 0.266072 \tabularnewline
31 & 0.006006 & 0.0547 & 0.478248 \tabularnewline
32 & -0.017773 & -0.1619 & 0.43588 \tabularnewline
33 & -0.037357 & -0.3403 & 0.367232 \tabularnewline
34 & -0.029675 & -0.2704 & 0.393779 \tabularnewline
35 & 0.010176 & 0.0927 & 0.463181 \tabularnewline
36 & -0.193218 & -1.7603 & 0.041021 \tabularnewline
37 & 0.043091 & 0.3926 & 0.347819 \tabularnewline
38 & -0.026813 & -0.2443 & 0.40381 \tabularnewline
39 & -0.052351 & -0.4769 & 0.31733 \tabularnewline
40 & -0.018964 & -0.1728 & 0.431626 \tabularnewline
41 & 0.006114 & 0.0557 & 0.477856 \tabularnewline
42 & 0.03588 & 0.3269 & 0.37229 \tabularnewline
43 & -0.054974 & -0.5008 & 0.308904 \tabularnewline
44 & -0.039236 & -0.3575 & 0.360829 \tabularnewline
45 & -0.058924 & -0.5368 & 0.296414 \tabularnewline
46 & -0.034855 & -0.3175 & 0.375814 \tabularnewline
47 & -0.055397 & -0.5047 & 0.307557 \tabularnewline
48 & -0.002165 & -0.0197 & 0.492156 \tabularnewline
\hline
\end{tabular}
%Source: https://freestatistics.org/blog/index.php?pk=&T=2

[TABLE]
[ROW][C]Partial Autocorrelation Function[/C][/ROW]
[ROW][C]Time lag k[/C][C]PACF(k)[/C][C]T-STAT[/C][C]P-value[/C][/ROW]
[ROW][C]1[/C][C]0.138102[/C][C]1.2582[/C][C]0.105929[/C][/ROW]
[ROW][C]2[/C][C]-0.018169[/C][C]-0.1655[/C][C]0.434464[/C][/ROW]
[ROW][C]3[/C][C]-0.095963[/C][C]-0.8743[/C][C]0.192248[/C][/ROW]
[ROW][C]4[/C][C]-0.06693[/C][C]-0.6098[/C][C]0.271844[/C][/ROW]
[ROW][C]5[/C][C]-0.051412[/C][C]-0.4684[/C][C]0.320367[/C][/ROW]
[ROW][C]6[/C][C]-0.110092[/C][C]-1.003[/C][C]0.15939[/C][/ROW]
[ROW][C]7[/C][C]-0.062163[/C][C]-0.5663[/C][C]0.286347[/C][/ROW]
[ROW][C]8[/C][C]-0.114825[/C][C]-1.0461[/C][C]0.149275[/C][/ROW]
[ROW][C]9[/C][C]-0.134383[/C][C]-1.2243[/C][C]0.112154[/C][/ROW]
[ROW][C]10[/C][C]-0.035612[/C][C]-0.3244[/C][C]0.373212[/C][/ROW]
[ROW][C]11[/C][C]0.094761[/C][C]0.8633[/C][C]0.195225[/C][/ROW]
[ROW][C]12[/C][C]0.039496[/C][C]0.3598[/C][C]0.359944[/C][/ROW]
[ROW][C]13[/C][C]-0.006736[/C][C]-0.0614[/C][C]0.475608[/C][/ROW]
[ROW][C]14[/C][C]-0.035009[/C][C]-0.3189[/C][C]0.375284[/C][/ROW]
[ROW][C]15[/C][C]-0.060771[/C][C]-0.5536[/C][C]0.290654[/C][/ROW]
[ROW][C]16[/C][C]-0.07905[/C][C]-0.7202[/C][C]0.236719[/C][/ROW]
[ROW][C]17[/C][C]-0.01097[/C][C]-0.0999[/C][C]0.460317[/C][/ROW]
[ROW][C]18[/C][C]-0.000477[/C][C]-0.0043[/C][C]0.498273[/C][/ROW]
[ROW][C]19[/C][C]-0.039905[/C][C]-0.3635[/C][C]0.35856[/C][/ROW]
[ROW][C]20[/C][C]-0.039461[/C][C]-0.3595[/C][C]0.360064[/C][/ROW]
[ROW][C]21[/C][C]-0.044472[/C][C]-0.4052[/C][C]0.3432[/C][/ROW]
[ROW][C]22[/C][C]-0.076879[/C][C]-0.7004[/C][C]0.242818[/C][/ROW]
[ROW][C]23[/C][C]0.00627[/C][C]0.0571[/C][C]0.477293[/C][/ROW]
[ROW][C]24[/C][C]-0.107515[/C][C]-0.9795[/C][C]0.165088[/C][/ROW]
[ROW][C]25[/C][C]-0.006913[/C][C]-0.063[/C][C]0.474968[/C][/ROW]
[ROW][C]26[/C][C]-0.04151[/C][C]-0.3782[/C][C]0.353133[/C][/ROW]
[ROW][C]27[/C][C]-0.06346[/C][C]-0.5782[/C][C]0.282363[/C][/ROW]
[ROW][C]28[/C][C]-0.035691[/C][C]-0.3252[/C][C]0.372938[/C][/ROW]
[ROW][C]29[/C][C]-0.074606[/C][C]-0.6797[/C][C]0.249294[/C][/ROW]
[ROW][C]30[/C][C]0.068862[/C][C]0.6274[/C][C]0.266072[/C][/ROW]
[ROW][C]31[/C][C]0.006006[/C][C]0.0547[/C][C]0.478248[/C][/ROW]
[ROW][C]32[/C][C]-0.017773[/C][C]-0.1619[/C][C]0.43588[/C][/ROW]
[ROW][C]33[/C][C]-0.037357[/C][C]-0.3403[/C][C]0.367232[/C][/ROW]
[ROW][C]34[/C][C]-0.029675[/C][C]-0.2704[/C][C]0.393779[/C][/ROW]
[ROW][C]35[/C][C]0.010176[/C][C]0.0927[/C][C]0.463181[/C][/ROW]
[ROW][C]36[/C][C]-0.193218[/C][C]-1.7603[/C][C]0.041021[/C][/ROW]
[ROW][C]37[/C][C]0.043091[/C][C]0.3926[/C][C]0.347819[/C][/ROW]
[ROW][C]38[/C][C]-0.026813[/C][C]-0.2443[/C][C]0.40381[/C][/ROW]
[ROW][C]39[/C][C]-0.052351[/C][C]-0.4769[/C][C]0.31733[/C][/ROW]
[ROW][C]40[/C][C]-0.018964[/C][C]-0.1728[/C][C]0.431626[/C][/ROW]
[ROW][C]41[/C][C]0.006114[/C][C]0.0557[/C][C]0.477856[/C][/ROW]
[ROW][C]42[/C][C]0.03588[/C][C]0.3269[/C][C]0.37229[/C][/ROW]
[ROW][C]43[/C][C]-0.054974[/C][C]-0.5008[/C][C]0.308904[/C][/ROW]
[ROW][C]44[/C][C]-0.039236[/C][C]-0.3575[/C][C]0.360829[/C][/ROW]
[ROW][C]45[/C][C]-0.058924[/C][C]-0.5368[/C][C]0.296414[/C][/ROW]
[ROW][C]46[/C][C]-0.034855[/C][C]-0.3175[/C][C]0.375814[/C][/ROW]
[ROW][C]47[/C][C]-0.055397[/C][C]-0.5047[/C][C]0.307557[/C][/ROW]
[ROW][C]48[/C][C]-0.002165[/C][C]-0.0197[/C][C]0.492156[/C][/ROW]
[/TABLE]
Source: https://freestatistics.org/blog/index.php?pk=&T=2

Globally Unique Identifier (entire table): ba.freestatistics.org/blog/index.php?pk=&T=2

As an alternative you can also use a QR Code:  

The GUIDs for individual cells are displayed in the table below:

Partial Autocorrelation Function
Time lag kPACF(k)T-STATP-value
10.1381021.25820.105929
2-0.018169-0.16550.434464
3-0.095963-0.87430.192248
4-0.06693-0.60980.271844
5-0.051412-0.46840.320367
6-0.110092-1.0030.15939
7-0.062163-0.56630.286347
8-0.114825-1.04610.149275
9-0.134383-1.22430.112154
10-0.035612-0.32440.373212
110.0947610.86330.195225
120.0394960.35980.359944
13-0.006736-0.06140.475608
14-0.035009-0.31890.375284
15-0.060771-0.55360.290654
16-0.07905-0.72020.236719
17-0.01097-0.09990.460317
18-0.000477-0.00430.498273
19-0.039905-0.36350.35856
20-0.039461-0.35950.360064
21-0.044472-0.40520.3432
22-0.076879-0.70040.242818
230.006270.05710.477293
24-0.107515-0.97950.165088
25-0.006913-0.0630.474968
26-0.04151-0.37820.353133
27-0.06346-0.57820.282363
28-0.035691-0.32520.372938
29-0.074606-0.67970.249294
300.0688620.62740.266072
310.0060060.05470.478248
32-0.017773-0.16190.43588
33-0.037357-0.34030.367232
34-0.029675-0.27040.393779
350.0101760.09270.463181
36-0.193218-1.76030.041021
370.0430910.39260.347819
38-0.026813-0.24430.40381
39-0.052351-0.47690.31733
40-0.018964-0.17280.431626
410.0061140.05570.477856
420.035880.32690.37229
43-0.054974-0.50080.308904
44-0.039236-0.35750.360829
45-0.058924-0.53680.296414
46-0.034855-0.31750.375814
47-0.055397-0.50470.307557
48-0.002165-0.01970.492156


Parameters (Session):
par1 = 48 ; par2 = 1 ; par3 = 1 ; par4 = 0 ; par5 = 12 ; par6 = White Noise ; par7 = 0.95 ;
Parameters (R input):
par1 = 48 ; par2 = 1 ; par3 = 1 ; par4 = 0 ; par5 = 12 ; par6 = White Noise ; par7 = 0.95 ; par8 = ;
R code (references can be found in the software module):
if (par1 == 'Default') {
par1 = 10*log10(length(x))
} else {
par1 <- as.numeric(par1)
}
par2 <- as.numeric(par2)
par3 <- as.numeric(par3)
par4 <- as.numeric(par4)
par5 <- as.numeric(par5)
if (par6 == 'White Noise') par6 <- 'white' else par6 <- 'ma'
par7 <- as.numeric(par7)
if (par8 != '') par8 <- as.numeric(par8)
x <- na.omit(x)
ox <- x
if (par8 == '') {
if (par2 == 0) {
x <- log(x)
} else {
x <- (x ^ par2 - 1) / par2
}
} else {
x <- log(x,base=par8)
}
if (par3 > 0) x <- diff(x,lag=1,difference=par3)
if (par4 > 0) x <- diff(x,lag=par5,difference=par4)
bitmap(file='picts.png')
op <- par(mfrow=c(2,1))
plot(ox,type='l',main='Original Time Series',xlab='time',ylab='value')
if (par8=='') {
mytitle <- paste('Working Time Series (lambda=',par2,', d=',par3,', D=',par4,')',sep='')
mysub <- paste('(lambda=',par2,', d=',par3,', D=',par4,', CI=', par7, ', CI type=',par6,')',sep='')
} else {
mytitle <- paste('Working Time Series (base=',par8,', d=',par3,', D=',par4,')',sep='')
mysub <- paste('(base=',par8,', d=',par3,', D=',par4,', CI=', par7, ', CI type=',par6,')',sep='')
}
plot(x,type='l', main=mytitle,xlab='time',ylab='value')
par(op)
dev.off()
bitmap(file='pic1.png')
racf <- acf(x, par1, main='Autocorrelation', xlab='time lag', ylab='ACF', ci.type=par6, ci=par7, sub=mysub)
dev.off()
bitmap(file='pic2.png')
rpacf <- pacf(x,par1,main='Partial Autocorrelation',xlab='lags',ylab='PACF',sub=mysub)
dev.off()
(myacf <- c(racf$acf))
(mypacf <- c(rpacf$acf))
lengthx <- length(x)
sqrtn <- sqrt(lengthx)
load(file='createtable')
a<-table.start()
a<-table.row.start(a)
a<-table.element(a,'Autocorrelation Function',4,TRUE)
a<-table.row.end(a)
a<-table.row.start(a)
a<-table.element(a,'Time lag k',header=TRUE)
a<-table.element(a,hyperlink('basics.htm','ACF(k)','click here for more information about the Autocorrelation Function'),header=TRUE)
a<-table.element(a,'T-STAT',header=TRUE)
a<-table.element(a,'P-value',header=TRUE)
a<-table.row.end(a)
for (i in 2:(par1+1)) {
a<-table.row.start(a)
a<-table.element(a,i-1,header=TRUE)
a<-table.element(a,round(myacf[i],6))
mytstat <- myacf[i]*sqrtn
a<-table.element(a,round(mytstat,4))
a<-table.element(a,round(1-pt(abs(mytstat),lengthx),6))
a<-table.row.end(a)
}
a<-table.end(a)
table.save(a,file='mytable.tab')
a<-table.start()
a<-table.row.start(a)
a<-table.element(a,'Partial Autocorrelation Function',4,TRUE)
a<-table.row.end(a)
a<-table.row.start(a)
a<-table.element(a,'Time lag k',header=TRUE)
a<-table.element(a,hyperlink('basics.htm','PACF(k)','click here for more information about the Partial Autocorrelation Function'),header=TRUE)
a<-table.element(a,'T-STAT',header=TRUE)
a<-table.element(a,'P-value',header=TRUE)
a<-table.row.end(a)
for (i in 1:par1) {
a<-table.row.start(a)
a<-table.element(a,i,header=TRUE)
a<-table.element(a,round(mypacf[i],6))
mytstat <- mypacf[i]*sqrtn
a<-table.element(a,round(mytstat,4))
a<-table.element(a,round(1-pt(abs(mytstat),lengthx),6))
a<-table.row.end(a)
}
a<-table.end(a)
table.save(a,file='mytable1.tab')