Free Statistics

of Irreproducible Research!

Author's title

Author*Unverified author*
R Software Modulerwasp_autocorrelation.wasp
Title produced by software(Partial) Autocorrelation Function
Date of computationThu, 16 Mar 2017 17:54:16 +0000
Cite this page as followsStatistical Computations at FreeStatistics.org, Office for Research Development and Education, URL https://freestatistics.org/blog/index.php?v=date/2017/Mar/16/t1489686940hew2kvp5wwzltb0.htm/, Retrieved Tue, 14 May 2024 17:15:51 +0200
Statistical Computations at FreeStatistics.org, Office for Research Development and Education, URL https://freestatistics.org/blog/index.php?pk=, Retrieved Tue, 14 May 2024 17:15:51 +0200
QR Codes:

Original text written by user:
IsPrivate?No (this computation is public)
User-defined keywords
Estimated Impact0
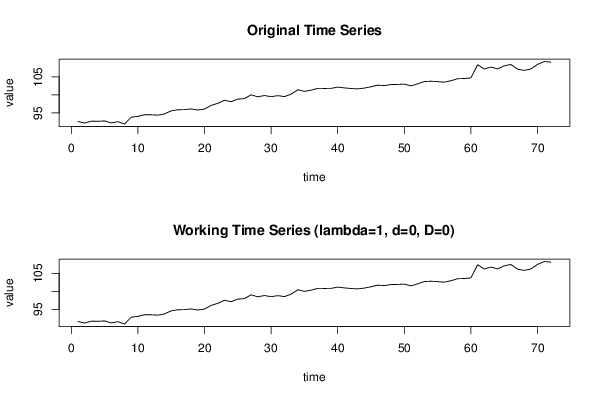
Dataseries X:
92,61
92,19
92,68
92,66
92,77
92,21
92,58
91,9
93,81
94,05
94,51
94,49
94,36
94,72
95,57
95,87
95,93
96,09
95,82
96,06
97,09
97,67
98,53
98,12
98,84
98,98
100,04
99,47
99,84
99,52
99,81
99,55
100,21
101,44
101
101,32
101,84
101,81
101,83
102,18
101,97
101,8
101,69
101,91
102,27
102,73
102,61
102,89
102,93
103,01
102,54
103,08
103,72
103,83
103,69
103,57
103,95
104,52
104,58
104,75
108,4
107,23
107,76
107,25
108,1
108,49
107,19
106,83
107,24
108,49
109,3
109,15


Summary of computational transaction
Raw Inputview raw input (R code)
Raw Outputview raw output of R engine
Computing time2 seconds
R Server'George Udny Yule' @ yule.wessa.net

\begin{tabular}{lllllllll}
\hline
Summary of computational transaction \tabularnewline
Raw Input & view raw input (R code)  \tabularnewline
Raw Output & view raw output of R engine  \tabularnewline
Computing time & 2 seconds \tabularnewline
R Server & 'George Udny Yule' @ yule.wessa.net \tabularnewline
\hline
\end{tabular}
%Source: https://freestatistics.org/blog/index.php?pk=&T=0

[TABLE]
[ROW][C]Summary of computational transaction[/C][/ROW]
[ROW][C]Raw Input[/C][C]view raw input (R code) [/C][/ROW]
[ROW][C]Raw Output[/C][C]view raw output of R engine [/C][/ROW]
[ROW][C]Computing time[/C][C]2 seconds[/C][/ROW]
[ROW][C]R Server[/C][C]'George Udny Yule' @ yule.wessa.net[/C][/ROW]
[/TABLE]
Source: https://freestatistics.org/blog/index.php?pk=&T=0

Globally Unique Identifier (entire table): ba.freestatistics.org/blog/index.php?pk=&T=0

As an alternative you can also use a QR Code:  

The GUIDs for individual cells are displayed in the table below:

Summary of computational transaction
Raw Inputview raw input (R code)
Raw Outputview raw output of R engine
Computing time2 seconds
R Server'George Udny Yule' @ yule.wessa.net


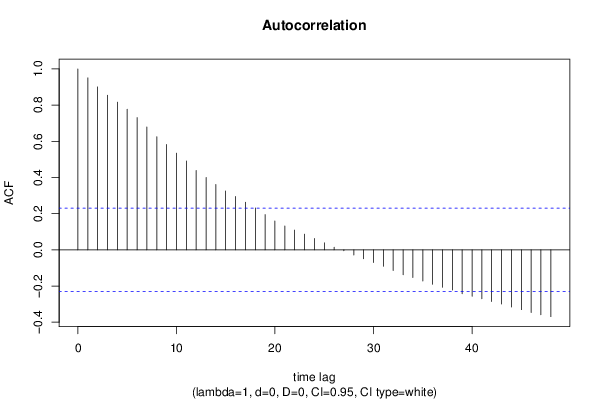
Autocorrelation Function
Time lag kACF(k)T-STATP-value
10.9505588.06580
20.9007877.64340
30.8545367.2510
40.8164576.92790
50.7772256.5950
60.7308646.20160
70.6790245.76170
80.6255835.30821e-06
90.5822454.94052e-06
100.5345664.53591.1e-05
110.4910494.16674.2e-05
120.4387953.72330.000194
130.4002023.39580.000558
140.360883.06220.001544
150.3256762.76350.003628
160.2946772.50040.007341
170.2633222.23440.014282
180.231111.9610.026872
190.1946581.65170.051472
200.1597361.35540.089763
210.1317951.11830.133575
220.1090380.92520.178971
230.0868350.73680.231813
240.062550.53080.298611
250.0386290.32780.372016
260.0142950.12130.451897
27-0.005422-0.0460.481717
28-0.02896-0.24570.403294
29-0.04941-0.41930.338137
30-0.069997-0.59390.277204
31-0.09081-0.77060.221747
32-0.114342-0.97020.167591
33-0.137984-1.17080.122764
34-0.152805-1.29660.099456
35-0.172018-1.45960.074372
36-0.190032-1.61250.055617
37-0.206456-1.75180.04203
38-0.222191-1.88540.031709
39-0.242677-2.05920.021547
40-0.256982-2.18060.016242
41-0.270486-2.29520.01232
42-0.285696-2.42420.008927
43-0.299132-2.53820.006653
44-0.315897-2.68050.004554
45-0.330306-2.80270.003253
46-0.346535-2.94050.002202
47-0.358681-3.04350.001632
48-0.369236-3.13310.001251

\begin{tabular}{lllllllll}
\hline
Autocorrelation Function \tabularnewline
Time lag k & ACF(k) & T-STAT & P-value \tabularnewline
1 & 0.950558 & 8.0658 & 0 \tabularnewline
2 & 0.900787 & 7.6434 & 0 \tabularnewline
3 & 0.854536 & 7.251 & 0 \tabularnewline
4 & 0.816457 & 6.9279 & 0 \tabularnewline
5 & 0.777225 & 6.595 & 0 \tabularnewline
6 & 0.730864 & 6.2016 & 0 \tabularnewline
7 & 0.679024 & 5.7617 & 0 \tabularnewline
8 & 0.625583 & 5.3082 & 1e-06 \tabularnewline
9 & 0.582245 & 4.9405 & 2e-06 \tabularnewline
10 & 0.534566 & 4.5359 & 1.1e-05 \tabularnewline
11 & 0.491049 & 4.1667 & 4.2e-05 \tabularnewline
12 & 0.438795 & 3.7233 & 0.000194 \tabularnewline
13 & 0.400202 & 3.3958 & 0.000558 \tabularnewline
14 & 0.36088 & 3.0622 & 0.001544 \tabularnewline
15 & 0.325676 & 2.7635 & 0.003628 \tabularnewline
16 & 0.294677 & 2.5004 & 0.007341 \tabularnewline
17 & 0.263322 & 2.2344 & 0.014282 \tabularnewline
18 & 0.23111 & 1.961 & 0.026872 \tabularnewline
19 & 0.194658 & 1.6517 & 0.051472 \tabularnewline
20 & 0.159736 & 1.3554 & 0.089763 \tabularnewline
21 & 0.131795 & 1.1183 & 0.133575 \tabularnewline
22 & 0.109038 & 0.9252 & 0.178971 \tabularnewline
23 & 0.086835 & 0.7368 & 0.231813 \tabularnewline
24 & 0.06255 & 0.5308 & 0.298611 \tabularnewline
25 & 0.038629 & 0.3278 & 0.372016 \tabularnewline
26 & 0.014295 & 0.1213 & 0.451897 \tabularnewline
27 & -0.005422 & -0.046 & 0.481717 \tabularnewline
28 & -0.02896 & -0.2457 & 0.403294 \tabularnewline
29 & -0.04941 & -0.4193 & 0.338137 \tabularnewline
30 & -0.069997 & -0.5939 & 0.277204 \tabularnewline
31 & -0.09081 & -0.7706 & 0.221747 \tabularnewline
32 & -0.114342 & -0.9702 & 0.167591 \tabularnewline
33 & -0.137984 & -1.1708 & 0.122764 \tabularnewline
34 & -0.152805 & -1.2966 & 0.099456 \tabularnewline
35 & -0.172018 & -1.4596 & 0.074372 \tabularnewline
36 & -0.190032 & -1.6125 & 0.055617 \tabularnewline
37 & -0.206456 & -1.7518 & 0.04203 \tabularnewline
38 & -0.222191 & -1.8854 & 0.031709 \tabularnewline
39 & -0.242677 & -2.0592 & 0.021547 \tabularnewline
40 & -0.256982 & -2.1806 & 0.016242 \tabularnewline
41 & -0.270486 & -2.2952 & 0.01232 \tabularnewline
42 & -0.285696 & -2.4242 & 0.008927 \tabularnewline
43 & -0.299132 & -2.5382 & 0.006653 \tabularnewline
44 & -0.315897 & -2.6805 & 0.004554 \tabularnewline
45 & -0.330306 & -2.8027 & 0.003253 \tabularnewline
46 & -0.346535 & -2.9405 & 0.002202 \tabularnewline
47 & -0.358681 & -3.0435 & 0.001632 \tabularnewline
48 & -0.369236 & -3.1331 & 0.001251 \tabularnewline
\hline
\end{tabular}
%Source: https://freestatistics.org/blog/index.php?pk=&T=1

[TABLE]
[ROW][C]Autocorrelation Function[/C][/ROW]
[ROW][C]Time lag k[/C][C]ACF(k)[/C][C]T-STAT[/C][C]P-value[/C][/ROW]
[ROW][C]1[/C][C]0.950558[/C][C]8.0658[/C][C]0[/C][/ROW]
[ROW][C]2[/C][C]0.900787[/C][C]7.6434[/C][C]0[/C][/ROW]
[ROW][C]3[/C][C]0.854536[/C][C]7.251[/C][C]0[/C][/ROW]
[ROW][C]4[/C][C]0.816457[/C][C]6.9279[/C][C]0[/C][/ROW]
[ROW][C]5[/C][C]0.777225[/C][C]6.595[/C][C]0[/C][/ROW]
[ROW][C]6[/C][C]0.730864[/C][C]6.2016[/C][C]0[/C][/ROW]
[ROW][C]7[/C][C]0.679024[/C][C]5.7617[/C][C]0[/C][/ROW]
[ROW][C]8[/C][C]0.625583[/C][C]5.3082[/C][C]1e-06[/C][/ROW]
[ROW][C]9[/C][C]0.582245[/C][C]4.9405[/C][C]2e-06[/C][/ROW]
[ROW][C]10[/C][C]0.534566[/C][C]4.5359[/C][C]1.1e-05[/C][/ROW]
[ROW][C]11[/C][C]0.491049[/C][C]4.1667[/C][C]4.2e-05[/C][/ROW]
[ROW][C]12[/C][C]0.438795[/C][C]3.7233[/C][C]0.000194[/C][/ROW]
[ROW][C]13[/C][C]0.400202[/C][C]3.3958[/C][C]0.000558[/C][/ROW]
[ROW][C]14[/C][C]0.36088[/C][C]3.0622[/C][C]0.001544[/C][/ROW]
[ROW][C]15[/C][C]0.325676[/C][C]2.7635[/C][C]0.003628[/C][/ROW]
[ROW][C]16[/C][C]0.294677[/C][C]2.5004[/C][C]0.007341[/C][/ROW]
[ROW][C]17[/C][C]0.263322[/C][C]2.2344[/C][C]0.014282[/C][/ROW]
[ROW][C]18[/C][C]0.23111[/C][C]1.961[/C][C]0.026872[/C][/ROW]
[ROW][C]19[/C][C]0.194658[/C][C]1.6517[/C][C]0.051472[/C][/ROW]
[ROW][C]20[/C][C]0.159736[/C][C]1.3554[/C][C]0.089763[/C][/ROW]
[ROW][C]21[/C][C]0.131795[/C][C]1.1183[/C][C]0.133575[/C][/ROW]
[ROW][C]22[/C][C]0.109038[/C][C]0.9252[/C][C]0.178971[/C][/ROW]
[ROW][C]23[/C][C]0.086835[/C][C]0.7368[/C][C]0.231813[/C][/ROW]
[ROW][C]24[/C][C]0.06255[/C][C]0.5308[/C][C]0.298611[/C][/ROW]
[ROW][C]25[/C][C]0.038629[/C][C]0.3278[/C][C]0.372016[/C][/ROW]
[ROW][C]26[/C][C]0.014295[/C][C]0.1213[/C][C]0.451897[/C][/ROW]
[ROW][C]27[/C][C]-0.005422[/C][C]-0.046[/C][C]0.481717[/C][/ROW]
[ROW][C]28[/C][C]-0.02896[/C][C]-0.2457[/C][C]0.403294[/C][/ROW]
[ROW][C]29[/C][C]-0.04941[/C][C]-0.4193[/C][C]0.338137[/C][/ROW]
[ROW][C]30[/C][C]-0.069997[/C][C]-0.5939[/C][C]0.277204[/C][/ROW]
[ROW][C]31[/C][C]-0.09081[/C][C]-0.7706[/C][C]0.221747[/C][/ROW]
[ROW][C]32[/C][C]-0.114342[/C][C]-0.9702[/C][C]0.167591[/C][/ROW]
[ROW][C]33[/C][C]-0.137984[/C][C]-1.1708[/C][C]0.122764[/C][/ROW]
[ROW][C]34[/C][C]-0.152805[/C][C]-1.2966[/C][C]0.099456[/C][/ROW]
[ROW][C]35[/C][C]-0.172018[/C][C]-1.4596[/C][C]0.074372[/C][/ROW]
[ROW][C]36[/C][C]-0.190032[/C][C]-1.6125[/C][C]0.055617[/C][/ROW]
[ROW][C]37[/C][C]-0.206456[/C][C]-1.7518[/C][C]0.04203[/C][/ROW]
[ROW][C]38[/C][C]-0.222191[/C][C]-1.8854[/C][C]0.031709[/C][/ROW]
[ROW][C]39[/C][C]-0.242677[/C][C]-2.0592[/C][C]0.021547[/C][/ROW]
[ROW][C]40[/C][C]-0.256982[/C][C]-2.1806[/C][C]0.016242[/C][/ROW]
[ROW][C]41[/C][C]-0.270486[/C][C]-2.2952[/C][C]0.01232[/C][/ROW]
[ROW][C]42[/C][C]-0.285696[/C][C]-2.4242[/C][C]0.008927[/C][/ROW]
[ROW][C]43[/C][C]-0.299132[/C][C]-2.5382[/C][C]0.006653[/C][/ROW]
[ROW][C]44[/C][C]-0.315897[/C][C]-2.6805[/C][C]0.004554[/C][/ROW]
[ROW][C]45[/C][C]-0.330306[/C][C]-2.8027[/C][C]0.003253[/C][/ROW]
[ROW][C]46[/C][C]-0.346535[/C][C]-2.9405[/C][C]0.002202[/C][/ROW]
[ROW][C]47[/C][C]-0.358681[/C][C]-3.0435[/C][C]0.001632[/C][/ROW]
[ROW][C]48[/C][C]-0.369236[/C][C]-3.1331[/C][C]0.001251[/C][/ROW]
[/TABLE]
Source: https://freestatistics.org/blog/index.php?pk=&T=1

Globally Unique Identifier (entire table): ba.freestatistics.org/blog/index.php?pk=&T=1

As an alternative you can also use a QR Code:  

The GUIDs for individual cells are displayed in the table below:

Autocorrelation Function
Time lag kACF(k)T-STATP-value
10.9505588.06580
20.9007877.64340
30.8545367.2510
40.8164576.92790
50.7772256.5950
60.7308646.20160
70.6790245.76170
80.6255835.30821e-06
90.5822454.94052e-06
100.5345664.53591.1e-05
110.4910494.16674.2e-05
120.4387953.72330.000194
130.4002023.39580.000558
140.360883.06220.001544
150.3256762.76350.003628
160.2946772.50040.007341
170.2633222.23440.014282
180.231111.9610.026872
190.1946581.65170.051472
200.1597361.35540.089763
210.1317951.11830.133575
220.1090380.92520.178971
230.0868350.73680.231813
240.062550.53080.298611
250.0386290.32780.372016
260.0142950.12130.451897
27-0.005422-0.0460.481717
28-0.02896-0.24570.403294
29-0.04941-0.41930.338137
30-0.069997-0.59390.277204
31-0.09081-0.77060.221747
32-0.114342-0.97020.167591
33-0.137984-1.17080.122764
34-0.152805-1.29660.099456
35-0.172018-1.45960.074372
36-0.190032-1.61250.055617
37-0.206456-1.75180.04203
38-0.222191-1.88540.031709
39-0.242677-2.05920.021547
40-0.256982-2.18060.016242
41-0.270486-2.29520.01232
42-0.285696-2.42420.008927
43-0.299132-2.53820.006653
44-0.315897-2.68050.004554
45-0.330306-2.80270.003253
46-0.346535-2.94050.002202
47-0.358681-3.04350.001632
48-0.369236-3.13310.001251


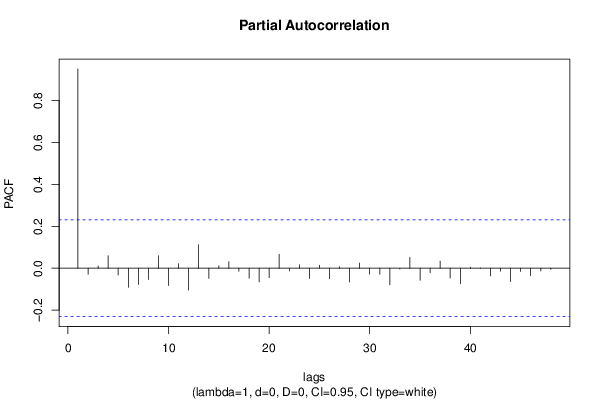
Partial Autocorrelation Function
Time lag kPACF(k)T-STATP-value
10.9505588.06580
2-0.028766-0.24410.403929
30.0103530.08780.46512
40.0595880.50560.307334
5-0.032699-0.27750.391112
6-0.090876-0.77110.221582
7-0.077728-0.65950.255826
8-0.053858-0.4570.324525
90.0593930.5040.307911
10-0.082049-0.69620.244269
110.0216880.1840.427253
12-0.103674-0.87970.190973
130.1120170.95050.17252
14-0.048403-0.41070.34125
150.0117420.09960.460455
160.0308750.2620.397042
17-0.014236-0.12080.452096
18-0.047364-0.40190.344474
19-0.065289-0.5540.29065
20-0.04499-0.38180.351884
210.0669970.56850.285736
22-0.012588-0.10680.457617
230.0168510.1430.44335
24-0.049329-0.41860.338387
250.013870.11770.45332
26-0.050628-0.42960.334387
270.0068460.05810.476919
28-0.065808-0.55840.289151
290.0253490.21510.415151
30-0.028089-0.23830.406147
31-0.029056-0.24650.402981
32-0.079148-0.67160.251996
33-0.003916-0.03320.486791
340.051010.43280.333214
35-0.057026-0.48390.314969
36-0.021793-0.18490.426908
370.0340380.28880.386773
38-0.046266-0.39260.347896
39-0.073735-0.62570.266757
400.0043750.03710.485243
41-0.000934-0.00790.496849
42-0.036532-0.310.378733
43-0.013852-0.11750.453379
44-0.063531-0.53910.295748
45-0.015363-0.13040.448322
46-0.035884-0.30450.380819
47-0.013533-0.11480.454449
48-0.005433-0.04610.481679

\begin{tabular}{lllllllll}
\hline
Partial Autocorrelation Function \tabularnewline
Time lag k & PACF(k) & T-STAT & P-value \tabularnewline
1 & 0.950558 & 8.0658 & 0 \tabularnewline
2 & -0.028766 & -0.2441 & 0.403929 \tabularnewline
3 & 0.010353 & 0.0878 & 0.46512 \tabularnewline
4 & 0.059588 & 0.5056 & 0.307334 \tabularnewline
5 & -0.032699 & -0.2775 & 0.391112 \tabularnewline
6 & -0.090876 & -0.7711 & 0.221582 \tabularnewline
7 & -0.077728 & -0.6595 & 0.255826 \tabularnewline
8 & -0.053858 & -0.457 & 0.324525 \tabularnewline
9 & 0.059393 & 0.504 & 0.307911 \tabularnewline
10 & -0.082049 & -0.6962 & 0.244269 \tabularnewline
11 & 0.021688 & 0.184 & 0.427253 \tabularnewline
12 & -0.103674 & -0.8797 & 0.190973 \tabularnewline
13 & 0.112017 & 0.9505 & 0.17252 \tabularnewline
14 & -0.048403 & -0.4107 & 0.34125 \tabularnewline
15 & 0.011742 & 0.0996 & 0.460455 \tabularnewline
16 & 0.030875 & 0.262 & 0.397042 \tabularnewline
17 & -0.014236 & -0.1208 & 0.452096 \tabularnewline
18 & -0.047364 & -0.4019 & 0.344474 \tabularnewline
19 & -0.065289 & -0.554 & 0.29065 \tabularnewline
20 & -0.04499 & -0.3818 & 0.351884 \tabularnewline
21 & 0.066997 & 0.5685 & 0.285736 \tabularnewline
22 & -0.012588 & -0.1068 & 0.457617 \tabularnewline
23 & 0.016851 & 0.143 & 0.44335 \tabularnewline
24 & -0.049329 & -0.4186 & 0.338387 \tabularnewline
25 & 0.01387 & 0.1177 & 0.45332 \tabularnewline
26 & -0.050628 & -0.4296 & 0.334387 \tabularnewline
27 & 0.006846 & 0.0581 & 0.476919 \tabularnewline
28 & -0.065808 & -0.5584 & 0.289151 \tabularnewline
29 & 0.025349 & 0.2151 & 0.415151 \tabularnewline
30 & -0.028089 & -0.2383 & 0.406147 \tabularnewline
31 & -0.029056 & -0.2465 & 0.402981 \tabularnewline
32 & -0.079148 & -0.6716 & 0.251996 \tabularnewline
33 & -0.003916 & -0.0332 & 0.486791 \tabularnewline
34 & 0.05101 & 0.4328 & 0.333214 \tabularnewline
35 & -0.057026 & -0.4839 & 0.314969 \tabularnewline
36 & -0.021793 & -0.1849 & 0.426908 \tabularnewline
37 & 0.034038 & 0.2888 & 0.386773 \tabularnewline
38 & -0.046266 & -0.3926 & 0.347896 \tabularnewline
39 & -0.073735 & -0.6257 & 0.266757 \tabularnewline
40 & 0.004375 & 0.0371 & 0.485243 \tabularnewline
41 & -0.000934 & -0.0079 & 0.496849 \tabularnewline
42 & -0.036532 & -0.31 & 0.378733 \tabularnewline
43 & -0.013852 & -0.1175 & 0.453379 \tabularnewline
44 & -0.063531 & -0.5391 & 0.295748 \tabularnewline
45 & -0.015363 & -0.1304 & 0.448322 \tabularnewline
46 & -0.035884 & -0.3045 & 0.380819 \tabularnewline
47 & -0.013533 & -0.1148 & 0.454449 \tabularnewline
48 & -0.005433 & -0.0461 & 0.481679 \tabularnewline
\hline
\end{tabular}
%Source: https://freestatistics.org/blog/index.php?pk=&T=2

[TABLE]
[ROW][C]Partial Autocorrelation Function[/C][/ROW]
[ROW][C]Time lag k[/C][C]PACF(k)[/C][C]T-STAT[/C][C]P-value[/C][/ROW]
[ROW][C]1[/C][C]0.950558[/C][C]8.0658[/C][C]0[/C][/ROW]
[ROW][C]2[/C][C]-0.028766[/C][C]-0.2441[/C][C]0.403929[/C][/ROW]
[ROW][C]3[/C][C]0.010353[/C][C]0.0878[/C][C]0.46512[/C][/ROW]
[ROW][C]4[/C][C]0.059588[/C][C]0.5056[/C][C]0.307334[/C][/ROW]
[ROW][C]5[/C][C]-0.032699[/C][C]-0.2775[/C][C]0.391112[/C][/ROW]
[ROW][C]6[/C][C]-0.090876[/C][C]-0.7711[/C][C]0.221582[/C][/ROW]
[ROW][C]7[/C][C]-0.077728[/C][C]-0.6595[/C][C]0.255826[/C][/ROW]
[ROW][C]8[/C][C]-0.053858[/C][C]-0.457[/C][C]0.324525[/C][/ROW]
[ROW][C]9[/C][C]0.059393[/C][C]0.504[/C][C]0.307911[/C][/ROW]
[ROW][C]10[/C][C]-0.082049[/C][C]-0.6962[/C][C]0.244269[/C][/ROW]
[ROW][C]11[/C][C]0.021688[/C][C]0.184[/C][C]0.427253[/C][/ROW]
[ROW][C]12[/C][C]-0.103674[/C][C]-0.8797[/C][C]0.190973[/C][/ROW]
[ROW][C]13[/C][C]0.112017[/C][C]0.9505[/C][C]0.17252[/C][/ROW]
[ROW][C]14[/C][C]-0.048403[/C][C]-0.4107[/C][C]0.34125[/C][/ROW]
[ROW][C]15[/C][C]0.011742[/C][C]0.0996[/C][C]0.460455[/C][/ROW]
[ROW][C]16[/C][C]0.030875[/C][C]0.262[/C][C]0.397042[/C][/ROW]
[ROW][C]17[/C][C]-0.014236[/C][C]-0.1208[/C][C]0.452096[/C][/ROW]
[ROW][C]18[/C][C]-0.047364[/C][C]-0.4019[/C][C]0.344474[/C][/ROW]
[ROW][C]19[/C][C]-0.065289[/C][C]-0.554[/C][C]0.29065[/C][/ROW]
[ROW][C]20[/C][C]-0.04499[/C][C]-0.3818[/C][C]0.351884[/C][/ROW]
[ROW][C]21[/C][C]0.066997[/C][C]0.5685[/C][C]0.285736[/C][/ROW]
[ROW][C]22[/C][C]-0.012588[/C][C]-0.1068[/C][C]0.457617[/C][/ROW]
[ROW][C]23[/C][C]0.016851[/C][C]0.143[/C][C]0.44335[/C][/ROW]
[ROW][C]24[/C][C]-0.049329[/C][C]-0.4186[/C][C]0.338387[/C][/ROW]
[ROW][C]25[/C][C]0.01387[/C][C]0.1177[/C][C]0.45332[/C][/ROW]
[ROW][C]26[/C][C]-0.050628[/C][C]-0.4296[/C][C]0.334387[/C][/ROW]
[ROW][C]27[/C][C]0.006846[/C][C]0.0581[/C][C]0.476919[/C][/ROW]
[ROW][C]28[/C][C]-0.065808[/C][C]-0.5584[/C][C]0.289151[/C][/ROW]
[ROW][C]29[/C][C]0.025349[/C][C]0.2151[/C][C]0.415151[/C][/ROW]
[ROW][C]30[/C][C]-0.028089[/C][C]-0.2383[/C][C]0.406147[/C][/ROW]
[ROW][C]31[/C][C]-0.029056[/C][C]-0.2465[/C][C]0.402981[/C][/ROW]
[ROW][C]32[/C][C]-0.079148[/C][C]-0.6716[/C][C]0.251996[/C][/ROW]
[ROW][C]33[/C][C]-0.003916[/C][C]-0.0332[/C][C]0.486791[/C][/ROW]
[ROW][C]34[/C][C]0.05101[/C][C]0.4328[/C][C]0.333214[/C][/ROW]
[ROW][C]35[/C][C]-0.057026[/C][C]-0.4839[/C][C]0.314969[/C][/ROW]
[ROW][C]36[/C][C]-0.021793[/C][C]-0.1849[/C][C]0.426908[/C][/ROW]
[ROW][C]37[/C][C]0.034038[/C][C]0.2888[/C][C]0.386773[/C][/ROW]
[ROW][C]38[/C][C]-0.046266[/C][C]-0.3926[/C][C]0.347896[/C][/ROW]
[ROW][C]39[/C][C]-0.073735[/C][C]-0.6257[/C][C]0.266757[/C][/ROW]
[ROW][C]40[/C][C]0.004375[/C][C]0.0371[/C][C]0.485243[/C][/ROW]
[ROW][C]41[/C][C]-0.000934[/C][C]-0.0079[/C][C]0.496849[/C][/ROW]
[ROW][C]42[/C][C]-0.036532[/C][C]-0.31[/C][C]0.378733[/C][/ROW]
[ROW][C]43[/C][C]-0.013852[/C][C]-0.1175[/C][C]0.453379[/C][/ROW]
[ROW][C]44[/C][C]-0.063531[/C][C]-0.5391[/C][C]0.295748[/C][/ROW]
[ROW][C]45[/C][C]-0.015363[/C][C]-0.1304[/C][C]0.448322[/C][/ROW]
[ROW][C]46[/C][C]-0.035884[/C][C]-0.3045[/C][C]0.380819[/C][/ROW]
[ROW][C]47[/C][C]-0.013533[/C][C]-0.1148[/C][C]0.454449[/C][/ROW]
[ROW][C]48[/C][C]-0.005433[/C][C]-0.0461[/C][C]0.481679[/C][/ROW]
[/TABLE]
Source: https://freestatistics.org/blog/index.php?pk=&T=2

Globally Unique Identifier (entire table): ba.freestatistics.org/blog/index.php?pk=&T=2

As an alternative you can also use a QR Code:  

The GUIDs for individual cells are displayed in the table below:

Partial Autocorrelation Function
Time lag kPACF(k)T-STATP-value
10.9505588.06580
2-0.028766-0.24410.403929
30.0103530.08780.46512
40.0595880.50560.307334
5-0.032699-0.27750.391112
6-0.090876-0.77110.221582
7-0.077728-0.65950.255826
8-0.053858-0.4570.324525
90.0593930.5040.307911
10-0.082049-0.69620.244269
110.0216880.1840.427253
12-0.103674-0.87970.190973
130.1120170.95050.17252
14-0.048403-0.41070.34125
150.0117420.09960.460455
160.0308750.2620.397042
17-0.014236-0.12080.452096
18-0.047364-0.40190.344474
19-0.065289-0.5540.29065
20-0.04499-0.38180.351884
210.0669970.56850.285736
22-0.012588-0.10680.457617
230.0168510.1430.44335
24-0.049329-0.41860.338387
250.013870.11770.45332
26-0.050628-0.42960.334387
270.0068460.05810.476919
28-0.065808-0.55840.289151
290.0253490.21510.415151
30-0.028089-0.23830.406147
31-0.029056-0.24650.402981
32-0.079148-0.67160.251996
33-0.003916-0.03320.486791
340.051010.43280.333214
35-0.057026-0.48390.314969
36-0.021793-0.18490.426908
370.0340380.28880.386773
38-0.046266-0.39260.347896
39-0.073735-0.62570.266757
400.0043750.03710.485243
41-0.000934-0.00790.496849
42-0.036532-0.310.378733
43-0.013852-0.11750.453379
44-0.063531-0.53910.295748
45-0.015363-0.13040.448322
46-0.035884-0.30450.380819
47-0.013533-0.11480.454449
48-0.005433-0.04610.481679


Parameters (Session):
par1 = 48 ; par2 = 1 ; par3 = 0 ; par4 = 0 ; par5 = 12 ; par6 = White Noise ; par7 = 0.95 ;
Parameters (R input):
par1 = 48 ; par2 = 1 ; par3 = 0 ; par4 = 0 ; par5 = 12 ; par6 = White Noise ; par7 = 0.95 ; par8 = ;
R code (references can be found in the software module):
if (par1 == 'Default') {
par1 = 10*log10(length(x))
} else {
par1 <- as.numeric(par1)
}
par2 <- as.numeric(par2)
par3 <- as.numeric(par3)
par4 <- as.numeric(par4)
par5 <- as.numeric(par5)
if (par6 == 'White Noise') par6 <- 'white' else par6 <- 'ma'
par7 <- as.numeric(par7)
if (par8 != '') par8 <- as.numeric(par8)
x <- na.omit(x)
ox <- x
if (par8 == '') {
if (par2 == 0) {
x <- log(x)
} else {
x <- (x ^ par2 - 1) / par2
}
} else {
x <- log(x,base=par8)
}
if (par3 > 0) x <- diff(x,lag=1,difference=par3)
if (par4 > 0) x <- diff(x,lag=par5,difference=par4)
bitmap(file='picts.png')
op <- par(mfrow=c(2,1))
plot(ox,type='l',main='Original Time Series',xlab='time',ylab='value')
if (par8=='') {
mytitle <- paste('Working Time Series (lambda=',par2,', d=',par3,', D=',par4,')',sep='')
mysub <- paste('(lambda=',par2,', d=',par3,', D=',par4,', CI=', par7, ', CI type=',par6,')',sep='')
} else {
mytitle <- paste('Working Time Series (base=',par8,', d=',par3,', D=',par4,')',sep='')
mysub <- paste('(base=',par8,', d=',par3,', D=',par4,', CI=', par7, ', CI type=',par6,')',sep='')
}
plot(x,type='l', main=mytitle,xlab='time',ylab='value')
par(op)
dev.off()
bitmap(file='pic1.png')
racf <- acf(x, par1, main='Autocorrelation', xlab='time lag', ylab='ACF', ci.type=par6, ci=par7, sub=mysub)
dev.off()
bitmap(file='pic2.png')
rpacf <- pacf(x,par1,main='Partial Autocorrelation',xlab='lags',ylab='PACF',sub=mysub)
dev.off()
(myacf <- c(racf$acf))
(mypacf <- c(rpacf$acf))
lengthx <- length(x)
sqrtn <- sqrt(lengthx)
load(file='createtable')
a<-table.start()
a<-table.row.start(a)
a<-table.element(a,'Autocorrelation Function',4,TRUE)
a<-table.row.end(a)
a<-table.row.start(a)
a<-table.element(a,'Time lag k',header=TRUE)
a<-table.element(a,hyperlink('basics.htm','ACF(k)','click here for more information about the Autocorrelation Function'),header=TRUE)
a<-table.element(a,'T-STAT',header=TRUE)
a<-table.element(a,'P-value',header=TRUE)
a<-table.row.end(a)
for (i in 2:(par1+1)) {
a<-table.row.start(a)
a<-table.element(a,i-1,header=TRUE)
a<-table.element(a,round(myacf[i],6))
mytstat <- myacf[i]*sqrtn
a<-table.element(a,round(mytstat,4))
a<-table.element(a,round(1-pt(abs(mytstat),lengthx),6))
a<-table.row.end(a)
}
a<-table.end(a)
table.save(a,file='mytable.tab')
a<-table.start()
a<-table.row.start(a)
a<-table.element(a,'Partial Autocorrelation Function',4,TRUE)
a<-table.row.end(a)
a<-table.row.start(a)
a<-table.element(a,'Time lag k',header=TRUE)
a<-table.element(a,hyperlink('basics.htm','PACF(k)','click here for more information about the Partial Autocorrelation Function'),header=TRUE)
a<-table.element(a,'T-STAT',header=TRUE)
a<-table.element(a,'P-value',header=TRUE)
a<-table.row.end(a)
for (i in 1:par1) {
a<-table.row.start(a)
a<-table.element(a,i,header=TRUE)
a<-table.element(a,round(mypacf[i],6))
mytstat <- mypacf[i]*sqrtn
a<-table.element(a,round(mytstat,4))
a<-table.element(a,round(1-pt(abs(mytstat),lengthx),6))
a<-table.row.end(a)
}
a<-table.end(a)
table.save(a,file='mytable1.tab')