Free Statistics

of Irreproducible Research!

Author's title

Author*Unverified author*
R Software Modulerwasp_autocorrelation.wasp
Title produced by software(Partial) Autocorrelation Function
Date of computationThu, 16 Mar 2017 18:47:57 +0000
Cite this page as followsStatistical Computations at FreeStatistics.org, Office for Research Development and Education, URL https://freestatistics.org/blog/index.php?v=date/2017/Mar/16/t1489690135rvi1gctk3rmgbkt.htm/, Retrieved Tue, 14 May 2024 11:56:22 +0200
Statistical Computations at FreeStatistics.org, Office for Research Development and Education, URL https://freestatistics.org/blog/index.php?pk=, Retrieved Tue, 14 May 2024 11:56:22 +0200
QR Codes:

Original text written by user:
IsPrivate?No (this computation is public)
User-defined keywords
Estimated Impact0
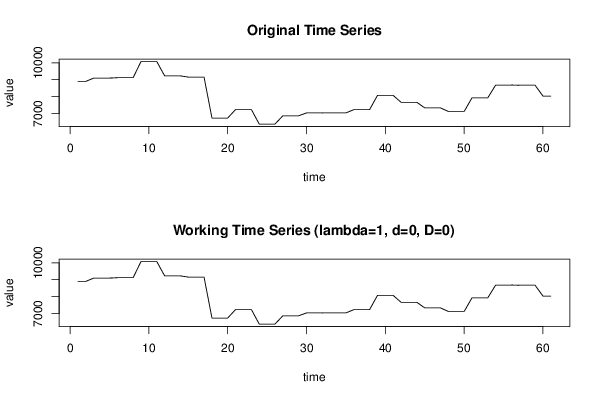
Dataseries X:
8899
8899
9093
9093
9093
9116
9116
9116
10073
10073
10073
9223
9223
9223
9151
9151
9151
6727
6727
6727
7232
7232
7232
6370
6370
6370
6862
6862
6862
7029
7029
7029
7031
7031
7031
7223
7223
7223
8065
8065
8065
7657
7657
7657
7328
7328
7328
7115
7115
7115
7926
7926
7926
8681
8681
8681
8670
8670
8670
8028
8028


Summary of computational transaction
Raw Inputview raw input (R code)
Raw Outputview raw output of R engine
Computing time2 seconds
R Server'Herman Ole Andreas Wold' @ wold.wessa.net

\begin{tabular}{lllllllll}
\hline
Summary of computational transaction \tabularnewline
Raw Input & view raw input (R code)  \tabularnewline
Raw Output & view raw output of R engine  \tabularnewline
Computing time & 2 seconds \tabularnewline
R Server & 'Herman Ole Andreas Wold' @ wold.wessa.net \tabularnewline
\hline
\end{tabular}
%Source: https://freestatistics.org/blog/index.php?pk=&T=0

[TABLE]
[ROW][C]Summary of computational transaction[/C][/ROW]
[ROW][C]Raw Input[/C][C]view raw input (R code) [/C][/ROW]
[ROW][C]Raw Output[/C][C]view raw output of R engine [/C][/ROW]
[ROW][C]Computing time[/C][C]2 seconds[/C][/ROW]
[ROW][C]R Server[/C][C]'Herman Ole Andreas Wold' @ wold.wessa.net[/C][/ROW]
[/TABLE]
Source: https://freestatistics.org/blog/index.php?pk=&T=0

Globally Unique Identifier (entire table): ba.freestatistics.org/blog/index.php?pk=&T=0

As an alternative you can also use a QR Code:  

The GUIDs for individual cells are displayed in the table below:

Summary of computational transaction
Raw Inputview raw input (R code)
Raw Outputview raw output of R engine
Computing time2 seconds
R Server'Herman Ole Andreas Wold' @ wold.wessa.net


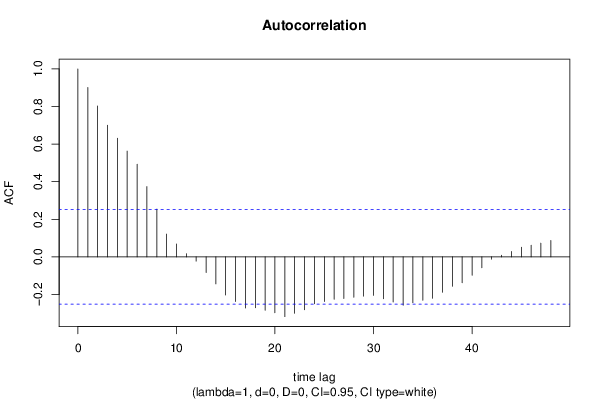
Autocorrelation Function
Time lag kACF(k)T-STATP-value
10.9013917.04010
20.8027826.26990
30.7005885.47180
40.6316074.9333e-06
50.5626264.39422.3e-05
60.493293.85270.000142
70.3737622.91920.002455
80.2542331.98560.025787
90.1212490.9470.173692
100.0687780.53720.296552
110.0163060.12740.449538
12-0.022617-0.17660.430187
13-0.083161-0.64950.259225
14-0.143705-1.12240.133052
15-0.203404-1.58860.058656
16-0.237748-1.85690.03408
17-0.272092-2.12510.018818
18-0.270647-2.11380.019314
19-0.283816-2.21670.015192
20-0.296986-2.31950.011865
21-0.318125-2.48460.007864
22-0.299787-2.34140.011247
23-0.281449-2.19820.01587
24-0.249351-1.94750.028041
25-0.237672-1.85630.034123
26-0.225993-1.76510.04128
27-0.221443-1.72950.044387
28-0.215131-1.68020.049014
29-0.208819-1.63090.054029
30-0.204995-1.60110.057265
31-0.222509-1.73780.043642
32-0.240023-1.87460.032816
33-0.257387-2.01030.024416
34-0.244101-1.90650.03065
35-0.230815-1.80270.038186
36-0.219861-1.71720.045511
37-0.187935-1.46780.073645
38-0.156009-1.21850.113868
39-0.137567-1.07440.14343
40-0.097972-0.76520.223555
41-0.058378-0.45590.325025
42-0.012155-0.09490.462338
430.0082960.06480.474276
440.0287460.22450.411553
450.0514910.40220.344486
460.0622380.48610.314321
470.0729850.570.285375
480.086830.67820.250116

\begin{tabular}{lllllllll}
\hline
Autocorrelation Function \tabularnewline
Time lag k & ACF(k) & T-STAT & P-value \tabularnewline
1 & 0.901391 & 7.0401 & 0 \tabularnewline
2 & 0.802782 & 6.2699 & 0 \tabularnewline
3 & 0.700588 & 5.4718 & 0 \tabularnewline
4 & 0.631607 & 4.933 & 3e-06 \tabularnewline
5 & 0.562626 & 4.3942 & 2.3e-05 \tabularnewline
6 & 0.49329 & 3.8527 & 0.000142 \tabularnewline
7 & 0.373762 & 2.9192 & 0.002455 \tabularnewline
8 & 0.254233 & 1.9856 & 0.025787 \tabularnewline
9 & 0.121249 & 0.947 & 0.173692 \tabularnewline
10 & 0.068778 & 0.5372 & 0.296552 \tabularnewline
11 & 0.016306 & 0.1274 & 0.449538 \tabularnewline
12 & -0.022617 & -0.1766 & 0.430187 \tabularnewline
13 & -0.083161 & -0.6495 & 0.259225 \tabularnewline
14 & -0.143705 & -1.1224 & 0.133052 \tabularnewline
15 & -0.203404 & -1.5886 & 0.058656 \tabularnewline
16 & -0.237748 & -1.8569 & 0.03408 \tabularnewline
17 & -0.272092 & -2.1251 & 0.018818 \tabularnewline
18 & -0.270647 & -2.1138 & 0.019314 \tabularnewline
19 & -0.283816 & -2.2167 & 0.015192 \tabularnewline
20 & -0.296986 & -2.3195 & 0.011865 \tabularnewline
21 & -0.318125 & -2.4846 & 0.007864 \tabularnewline
22 & -0.299787 & -2.3414 & 0.011247 \tabularnewline
23 & -0.281449 & -2.1982 & 0.01587 \tabularnewline
24 & -0.249351 & -1.9475 & 0.028041 \tabularnewline
25 & -0.237672 & -1.8563 & 0.034123 \tabularnewline
26 & -0.225993 & -1.7651 & 0.04128 \tabularnewline
27 & -0.221443 & -1.7295 & 0.044387 \tabularnewline
28 & -0.215131 & -1.6802 & 0.049014 \tabularnewline
29 & -0.208819 & -1.6309 & 0.054029 \tabularnewline
30 & -0.204995 & -1.6011 & 0.057265 \tabularnewline
31 & -0.222509 & -1.7378 & 0.043642 \tabularnewline
32 & -0.240023 & -1.8746 & 0.032816 \tabularnewline
33 & -0.257387 & -2.0103 & 0.024416 \tabularnewline
34 & -0.244101 & -1.9065 & 0.03065 \tabularnewline
35 & -0.230815 & -1.8027 & 0.038186 \tabularnewline
36 & -0.219861 & -1.7172 & 0.045511 \tabularnewline
37 & -0.187935 & -1.4678 & 0.073645 \tabularnewline
38 & -0.156009 & -1.2185 & 0.113868 \tabularnewline
39 & -0.137567 & -1.0744 & 0.14343 \tabularnewline
40 & -0.097972 & -0.7652 & 0.223555 \tabularnewline
41 & -0.058378 & -0.4559 & 0.325025 \tabularnewline
42 & -0.012155 & -0.0949 & 0.462338 \tabularnewline
43 & 0.008296 & 0.0648 & 0.474276 \tabularnewline
44 & 0.028746 & 0.2245 & 0.411553 \tabularnewline
45 & 0.051491 & 0.4022 & 0.344486 \tabularnewline
46 & 0.062238 & 0.4861 & 0.314321 \tabularnewline
47 & 0.072985 & 0.57 & 0.285375 \tabularnewline
48 & 0.08683 & 0.6782 & 0.250116 \tabularnewline
\hline
\end{tabular}
%Source: https://freestatistics.org/blog/index.php?pk=&T=1

[TABLE]
[ROW][C]Autocorrelation Function[/C][/ROW]
[ROW][C]Time lag k[/C][C]ACF(k)[/C][C]T-STAT[/C][C]P-value[/C][/ROW]
[ROW][C]1[/C][C]0.901391[/C][C]7.0401[/C][C]0[/C][/ROW]
[ROW][C]2[/C][C]0.802782[/C][C]6.2699[/C][C]0[/C][/ROW]
[ROW][C]3[/C][C]0.700588[/C][C]5.4718[/C][C]0[/C][/ROW]
[ROW][C]4[/C][C]0.631607[/C][C]4.933[/C][C]3e-06[/C][/ROW]
[ROW][C]5[/C][C]0.562626[/C][C]4.3942[/C][C]2.3e-05[/C][/ROW]
[ROW][C]6[/C][C]0.49329[/C][C]3.8527[/C][C]0.000142[/C][/ROW]
[ROW][C]7[/C][C]0.373762[/C][C]2.9192[/C][C]0.002455[/C][/ROW]
[ROW][C]8[/C][C]0.254233[/C][C]1.9856[/C][C]0.025787[/C][/ROW]
[ROW][C]9[/C][C]0.121249[/C][C]0.947[/C][C]0.173692[/C][/ROW]
[ROW][C]10[/C][C]0.068778[/C][C]0.5372[/C][C]0.296552[/C][/ROW]
[ROW][C]11[/C][C]0.016306[/C][C]0.1274[/C][C]0.449538[/C][/ROW]
[ROW][C]12[/C][C]-0.022617[/C][C]-0.1766[/C][C]0.430187[/C][/ROW]
[ROW][C]13[/C][C]-0.083161[/C][C]-0.6495[/C][C]0.259225[/C][/ROW]
[ROW][C]14[/C][C]-0.143705[/C][C]-1.1224[/C][C]0.133052[/C][/ROW]
[ROW][C]15[/C][C]-0.203404[/C][C]-1.5886[/C][C]0.058656[/C][/ROW]
[ROW][C]16[/C][C]-0.237748[/C][C]-1.8569[/C][C]0.03408[/C][/ROW]
[ROW][C]17[/C][C]-0.272092[/C][C]-2.1251[/C][C]0.018818[/C][/ROW]
[ROW][C]18[/C][C]-0.270647[/C][C]-2.1138[/C][C]0.019314[/C][/ROW]
[ROW][C]19[/C][C]-0.283816[/C][C]-2.2167[/C][C]0.015192[/C][/ROW]
[ROW][C]20[/C][C]-0.296986[/C][C]-2.3195[/C][C]0.011865[/C][/ROW]
[ROW][C]21[/C][C]-0.318125[/C][C]-2.4846[/C][C]0.007864[/C][/ROW]
[ROW][C]22[/C][C]-0.299787[/C][C]-2.3414[/C][C]0.011247[/C][/ROW]
[ROW][C]23[/C][C]-0.281449[/C][C]-2.1982[/C][C]0.01587[/C][/ROW]
[ROW][C]24[/C][C]-0.249351[/C][C]-1.9475[/C][C]0.028041[/C][/ROW]
[ROW][C]25[/C][C]-0.237672[/C][C]-1.8563[/C][C]0.034123[/C][/ROW]
[ROW][C]26[/C][C]-0.225993[/C][C]-1.7651[/C][C]0.04128[/C][/ROW]
[ROW][C]27[/C][C]-0.221443[/C][C]-1.7295[/C][C]0.044387[/C][/ROW]
[ROW][C]28[/C][C]-0.215131[/C][C]-1.6802[/C][C]0.049014[/C][/ROW]
[ROW][C]29[/C][C]-0.208819[/C][C]-1.6309[/C][C]0.054029[/C][/ROW]
[ROW][C]30[/C][C]-0.204995[/C][C]-1.6011[/C][C]0.057265[/C][/ROW]
[ROW][C]31[/C][C]-0.222509[/C][C]-1.7378[/C][C]0.043642[/C][/ROW]
[ROW][C]32[/C][C]-0.240023[/C][C]-1.8746[/C][C]0.032816[/C][/ROW]
[ROW][C]33[/C][C]-0.257387[/C][C]-2.0103[/C][C]0.024416[/C][/ROW]
[ROW][C]34[/C][C]-0.244101[/C][C]-1.9065[/C][C]0.03065[/C][/ROW]
[ROW][C]35[/C][C]-0.230815[/C][C]-1.8027[/C][C]0.038186[/C][/ROW]
[ROW][C]36[/C][C]-0.219861[/C][C]-1.7172[/C][C]0.045511[/C][/ROW]
[ROW][C]37[/C][C]-0.187935[/C][C]-1.4678[/C][C]0.073645[/C][/ROW]
[ROW][C]38[/C][C]-0.156009[/C][C]-1.2185[/C][C]0.113868[/C][/ROW]
[ROW][C]39[/C][C]-0.137567[/C][C]-1.0744[/C][C]0.14343[/C][/ROW]
[ROW][C]40[/C][C]-0.097972[/C][C]-0.7652[/C][C]0.223555[/C][/ROW]
[ROW][C]41[/C][C]-0.058378[/C][C]-0.4559[/C][C]0.325025[/C][/ROW]
[ROW][C]42[/C][C]-0.012155[/C][C]-0.0949[/C][C]0.462338[/C][/ROW]
[ROW][C]43[/C][C]0.008296[/C][C]0.0648[/C][C]0.474276[/C][/ROW]
[ROW][C]44[/C][C]0.028746[/C][C]0.2245[/C][C]0.411553[/C][/ROW]
[ROW][C]45[/C][C]0.051491[/C][C]0.4022[/C][C]0.344486[/C][/ROW]
[ROW][C]46[/C][C]0.062238[/C][C]0.4861[/C][C]0.314321[/C][/ROW]
[ROW][C]47[/C][C]0.072985[/C][C]0.57[/C][C]0.285375[/C][/ROW]
[ROW][C]48[/C][C]0.08683[/C][C]0.6782[/C][C]0.250116[/C][/ROW]
[/TABLE]
Source: https://freestatistics.org/blog/index.php?pk=&T=1

Globally Unique Identifier (entire table): ba.freestatistics.org/blog/index.php?pk=&T=1

As an alternative you can also use a QR Code:  

The GUIDs for individual cells are displayed in the table below:

Autocorrelation Function
Time lag kACF(k)T-STATP-value
10.9013917.04010
20.8027826.26990
30.7005885.47180
40.6316074.9333e-06
50.5626264.39422.3e-05
60.493293.85270.000142
70.3737622.91920.002455
80.2542331.98560.025787
90.1212490.9470.173692
100.0687780.53720.296552
110.0163060.12740.449538
12-0.022617-0.17660.430187
13-0.083161-0.64950.259225
14-0.143705-1.12240.133052
15-0.203404-1.58860.058656
16-0.237748-1.85690.03408
17-0.272092-2.12510.018818
18-0.270647-2.11380.019314
19-0.283816-2.21670.015192
20-0.296986-2.31950.011865
21-0.318125-2.48460.007864
22-0.299787-2.34140.011247
23-0.281449-2.19820.01587
24-0.249351-1.94750.028041
25-0.237672-1.85630.034123
26-0.225993-1.76510.04128
27-0.221443-1.72950.044387
28-0.215131-1.68020.049014
29-0.208819-1.63090.054029
30-0.204995-1.60110.057265
31-0.222509-1.73780.043642
32-0.240023-1.87460.032816
33-0.257387-2.01030.024416
34-0.244101-1.90650.03065
35-0.230815-1.80270.038186
36-0.219861-1.71720.045511
37-0.187935-1.46780.073645
38-0.156009-1.21850.113868
39-0.137567-1.07440.14343
40-0.097972-0.76520.223555
41-0.058378-0.45590.325025
42-0.012155-0.09490.462338
430.0082960.06480.474276
440.0287460.22450.411553
450.0514910.40220.344486
460.0622380.48610.314321
470.0729850.570.285375
480.086830.67820.250116


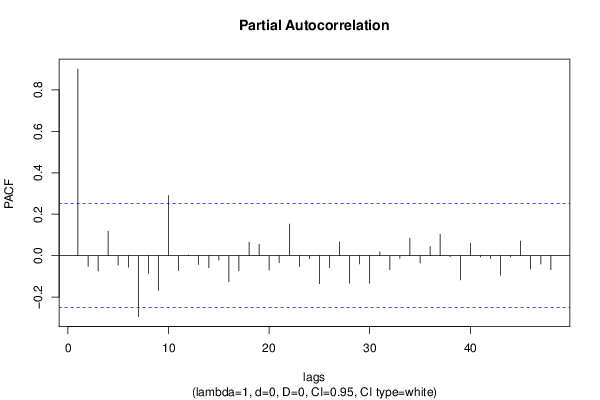
Partial Autocorrelation Function
Time lag kPACF(k)T-STATP-value
10.9013917.04010
2-0.051862-0.40510.343428
3-0.073867-0.57690.283058
40.1184550.92520.179263
5-0.044908-0.35070.363496
6-0.055356-0.43230.333508
7-0.294394-2.29930.012463
8-0.085865-0.67060.252496
9-0.167542-1.30850.097799
100.2904632.26860.013422
11-0.071442-0.5580.289449
120.0029120.02270.490964
13-0.042025-0.32820.371933
14-0.058025-0.45320.326009
15-0.020912-0.16330.4354
16-0.125562-0.98070.165314
17-0.072695-0.56780.286139
180.0651650.5090.306311
190.0545510.42610.335783
20-0.069362-0.54170.294988
21-0.034553-0.26990.394086
220.1524161.19040.119249
23-0.052686-0.41150.341078
24-0.014808-0.11570.454153
25-0.135004-1.05440.147926
26-0.057279-0.44740.328099
270.0657790.51370.304642
28-0.133157-1.040.151226
29-0.039666-0.30980.378884
30-0.132962-1.03850.151576
310.0182120.14220.443678
32-0.067953-0.53070.298767
33-0.01266-0.09890.46078
340.0843250.65860.256315
35-0.034949-0.2730.392902
360.0443990.34680.36498
370.102880.80350.212397
38-0.005109-0.03990.484149
39-0.116893-0.9130.182428
400.0595920.46540.321642
41-0.006552-0.05120.479676
42-0.014364-0.11220.455522
43-0.093893-0.73330.233083
44-0.006555-0.05120.479669
450.0704230.550.292158
46-0.06451-0.50380.308096
47-0.040094-0.31310.37762
48-0.067554-0.52760.29984

\begin{tabular}{lllllllll}
\hline
Partial Autocorrelation Function \tabularnewline
Time lag k & PACF(k) & T-STAT & P-value \tabularnewline
1 & 0.901391 & 7.0401 & 0 \tabularnewline
2 & -0.051862 & -0.4051 & 0.343428 \tabularnewline
3 & -0.073867 & -0.5769 & 0.283058 \tabularnewline
4 & 0.118455 & 0.9252 & 0.179263 \tabularnewline
5 & -0.044908 & -0.3507 & 0.363496 \tabularnewline
6 & -0.055356 & -0.4323 & 0.333508 \tabularnewline
7 & -0.294394 & -2.2993 & 0.012463 \tabularnewline
8 & -0.085865 & -0.6706 & 0.252496 \tabularnewline
9 & -0.167542 & -1.3085 & 0.097799 \tabularnewline
10 & 0.290463 & 2.2686 & 0.013422 \tabularnewline
11 & -0.071442 & -0.558 & 0.289449 \tabularnewline
12 & 0.002912 & 0.0227 & 0.490964 \tabularnewline
13 & -0.042025 & -0.3282 & 0.371933 \tabularnewline
14 & -0.058025 & -0.4532 & 0.326009 \tabularnewline
15 & -0.020912 & -0.1633 & 0.4354 \tabularnewline
16 & -0.125562 & -0.9807 & 0.165314 \tabularnewline
17 & -0.072695 & -0.5678 & 0.286139 \tabularnewline
18 & 0.065165 & 0.509 & 0.306311 \tabularnewline
19 & 0.054551 & 0.4261 & 0.335783 \tabularnewline
20 & -0.069362 & -0.5417 & 0.294988 \tabularnewline
21 & -0.034553 & -0.2699 & 0.394086 \tabularnewline
22 & 0.152416 & 1.1904 & 0.119249 \tabularnewline
23 & -0.052686 & -0.4115 & 0.341078 \tabularnewline
24 & -0.014808 & -0.1157 & 0.454153 \tabularnewline
25 & -0.135004 & -1.0544 & 0.147926 \tabularnewline
26 & -0.057279 & -0.4474 & 0.328099 \tabularnewline
27 & 0.065779 & 0.5137 & 0.304642 \tabularnewline
28 & -0.133157 & -1.04 & 0.151226 \tabularnewline
29 & -0.039666 & -0.3098 & 0.378884 \tabularnewline
30 & -0.132962 & -1.0385 & 0.151576 \tabularnewline
31 & 0.018212 & 0.1422 & 0.443678 \tabularnewline
32 & -0.067953 & -0.5307 & 0.298767 \tabularnewline
33 & -0.01266 & -0.0989 & 0.46078 \tabularnewline
34 & 0.084325 & 0.6586 & 0.256315 \tabularnewline
35 & -0.034949 & -0.273 & 0.392902 \tabularnewline
36 & 0.044399 & 0.3468 & 0.36498 \tabularnewline
37 & 0.10288 & 0.8035 & 0.212397 \tabularnewline
38 & -0.005109 & -0.0399 & 0.484149 \tabularnewline
39 & -0.116893 & -0.913 & 0.182428 \tabularnewline
40 & 0.059592 & 0.4654 & 0.321642 \tabularnewline
41 & -0.006552 & -0.0512 & 0.479676 \tabularnewline
42 & -0.014364 & -0.1122 & 0.455522 \tabularnewline
43 & -0.093893 & -0.7333 & 0.233083 \tabularnewline
44 & -0.006555 & -0.0512 & 0.479669 \tabularnewline
45 & 0.070423 & 0.55 & 0.292158 \tabularnewline
46 & -0.06451 & -0.5038 & 0.308096 \tabularnewline
47 & -0.040094 & -0.3131 & 0.37762 \tabularnewline
48 & -0.067554 & -0.5276 & 0.29984 \tabularnewline
\hline
\end{tabular}
%Source: https://freestatistics.org/blog/index.php?pk=&T=2

[TABLE]
[ROW][C]Partial Autocorrelation Function[/C][/ROW]
[ROW][C]Time lag k[/C][C]PACF(k)[/C][C]T-STAT[/C][C]P-value[/C][/ROW]
[ROW][C]1[/C][C]0.901391[/C][C]7.0401[/C][C]0[/C][/ROW]
[ROW][C]2[/C][C]-0.051862[/C][C]-0.4051[/C][C]0.343428[/C][/ROW]
[ROW][C]3[/C][C]-0.073867[/C][C]-0.5769[/C][C]0.283058[/C][/ROW]
[ROW][C]4[/C][C]0.118455[/C][C]0.9252[/C][C]0.179263[/C][/ROW]
[ROW][C]5[/C][C]-0.044908[/C][C]-0.3507[/C][C]0.363496[/C][/ROW]
[ROW][C]6[/C][C]-0.055356[/C][C]-0.4323[/C][C]0.333508[/C][/ROW]
[ROW][C]7[/C][C]-0.294394[/C][C]-2.2993[/C][C]0.012463[/C][/ROW]
[ROW][C]8[/C][C]-0.085865[/C][C]-0.6706[/C][C]0.252496[/C][/ROW]
[ROW][C]9[/C][C]-0.167542[/C][C]-1.3085[/C][C]0.097799[/C][/ROW]
[ROW][C]10[/C][C]0.290463[/C][C]2.2686[/C][C]0.013422[/C][/ROW]
[ROW][C]11[/C][C]-0.071442[/C][C]-0.558[/C][C]0.289449[/C][/ROW]
[ROW][C]12[/C][C]0.002912[/C][C]0.0227[/C][C]0.490964[/C][/ROW]
[ROW][C]13[/C][C]-0.042025[/C][C]-0.3282[/C][C]0.371933[/C][/ROW]
[ROW][C]14[/C][C]-0.058025[/C][C]-0.4532[/C][C]0.326009[/C][/ROW]
[ROW][C]15[/C][C]-0.020912[/C][C]-0.1633[/C][C]0.4354[/C][/ROW]
[ROW][C]16[/C][C]-0.125562[/C][C]-0.9807[/C][C]0.165314[/C][/ROW]
[ROW][C]17[/C][C]-0.072695[/C][C]-0.5678[/C][C]0.286139[/C][/ROW]
[ROW][C]18[/C][C]0.065165[/C][C]0.509[/C][C]0.306311[/C][/ROW]
[ROW][C]19[/C][C]0.054551[/C][C]0.4261[/C][C]0.335783[/C][/ROW]
[ROW][C]20[/C][C]-0.069362[/C][C]-0.5417[/C][C]0.294988[/C][/ROW]
[ROW][C]21[/C][C]-0.034553[/C][C]-0.2699[/C][C]0.394086[/C][/ROW]
[ROW][C]22[/C][C]0.152416[/C][C]1.1904[/C][C]0.119249[/C][/ROW]
[ROW][C]23[/C][C]-0.052686[/C][C]-0.4115[/C][C]0.341078[/C][/ROW]
[ROW][C]24[/C][C]-0.014808[/C][C]-0.1157[/C][C]0.454153[/C][/ROW]
[ROW][C]25[/C][C]-0.135004[/C][C]-1.0544[/C][C]0.147926[/C][/ROW]
[ROW][C]26[/C][C]-0.057279[/C][C]-0.4474[/C][C]0.328099[/C][/ROW]
[ROW][C]27[/C][C]0.065779[/C][C]0.5137[/C][C]0.304642[/C][/ROW]
[ROW][C]28[/C][C]-0.133157[/C][C]-1.04[/C][C]0.151226[/C][/ROW]
[ROW][C]29[/C][C]-0.039666[/C][C]-0.3098[/C][C]0.378884[/C][/ROW]
[ROW][C]30[/C][C]-0.132962[/C][C]-1.0385[/C][C]0.151576[/C][/ROW]
[ROW][C]31[/C][C]0.018212[/C][C]0.1422[/C][C]0.443678[/C][/ROW]
[ROW][C]32[/C][C]-0.067953[/C][C]-0.5307[/C][C]0.298767[/C][/ROW]
[ROW][C]33[/C][C]-0.01266[/C][C]-0.0989[/C][C]0.46078[/C][/ROW]
[ROW][C]34[/C][C]0.084325[/C][C]0.6586[/C][C]0.256315[/C][/ROW]
[ROW][C]35[/C][C]-0.034949[/C][C]-0.273[/C][C]0.392902[/C][/ROW]
[ROW][C]36[/C][C]0.044399[/C][C]0.3468[/C][C]0.36498[/C][/ROW]
[ROW][C]37[/C][C]0.10288[/C][C]0.8035[/C][C]0.212397[/C][/ROW]
[ROW][C]38[/C][C]-0.005109[/C][C]-0.0399[/C][C]0.484149[/C][/ROW]
[ROW][C]39[/C][C]-0.116893[/C][C]-0.913[/C][C]0.182428[/C][/ROW]
[ROW][C]40[/C][C]0.059592[/C][C]0.4654[/C][C]0.321642[/C][/ROW]
[ROW][C]41[/C][C]-0.006552[/C][C]-0.0512[/C][C]0.479676[/C][/ROW]
[ROW][C]42[/C][C]-0.014364[/C][C]-0.1122[/C][C]0.455522[/C][/ROW]
[ROW][C]43[/C][C]-0.093893[/C][C]-0.7333[/C][C]0.233083[/C][/ROW]
[ROW][C]44[/C][C]-0.006555[/C][C]-0.0512[/C][C]0.479669[/C][/ROW]
[ROW][C]45[/C][C]0.070423[/C][C]0.55[/C][C]0.292158[/C][/ROW]
[ROW][C]46[/C][C]-0.06451[/C][C]-0.5038[/C][C]0.308096[/C][/ROW]
[ROW][C]47[/C][C]-0.040094[/C][C]-0.3131[/C][C]0.37762[/C][/ROW]
[ROW][C]48[/C][C]-0.067554[/C][C]-0.5276[/C][C]0.29984[/C][/ROW]
[/TABLE]
Source: https://freestatistics.org/blog/index.php?pk=&T=2

Globally Unique Identifier (entire table): ba.freestatistics.org/blog/index.php?pk=&T=2

As an alternative you can also use a QR Code:  

The GUIDs for individual cells are displayed in the table below:

Partial Autocorrelation Function
Time lag kPACF(k)T-STATP-value
10.9013917.04010
2-0.051862-0.40510.343428
3-0.073867-0.57690.283058
40.1184550.92520.179263
5-0.044908-0.35070.363496
6-0.055356-0.43230.333508
7-0.294394-2.29930.012463
8-0.085865-0.67060.252496
9-0.167542-1.30850.097799
100.2904632.26860.013422
11-0.071442-0.5580.289449
120.0029120.02270.490964
13-0.042025-0.32820.371933
14-0.058025-0.45320.326009
15-0.020912-0.16330.4354
16-0.125562-0.98070.165314
17-0.072695-0.56780.286139
180.0651650.5090.306311
190.0545510.42610.335783
20-0.069362-0.54170.294988
21-0.034553-0.26990.394086
220.1524161.19040.119249
23-0.052686-0.41150.341078
24-0.014808-0.11570.454153
25-0.135004-1.05440.147926
26-0.057279-0.44740.328099
270.0657790.51370.304642
28-0.133157-1.040.151226
29-0.039666-0.30980.378884
30-0.132962-1.03850.151576
310.0182120.14220.443678
32-0.067953-0.53070.298767
33-0.01266-0.09890.46078
340.0843250.65860.256315
35-0.034949-0.2730.392902
360.0443990.34680.36498
370.102880.80350.212397
38-0.005109-0.03990.484149
39-0.116893-0.9130.182428
400.0595920.46540.321642
41-0.006552-0.05120.479676
42-0.014364-0.11220.455522
43-0.093893-0.73330.233083
44-0.006555-0.05120.479669
450.0704230.550.292158
46-0.06451-0.50380.308096
47-0.040094-0.31310.37762
48-0.067554-0.52760.29984


Parameters (Session):
par1 = 48 ; par2 = 1 ; par3 = 0 ; par4 = 0 ; par5 = 12 ; par6 = White Noise ; par7 = 0.95 ;
Parameters (R input):
par1 = 48 ; par2 = 1 ; par3 = 0 ; par4 = 0 ; par5 = 12 ; par6 = White Noise ; par7 = 0.95 ; par8 = ;
R code (references can be found in the software module):
if (par1 == 'Default') {
par1 = 10*log10(length(x))
} else {
par1 <- as.numeric(par1)
}
par2 <- as.numeric(par2)
par3 <- as.numeric(par3)
par4 <- as.numeric(par4)
par5 <- as.numeric(par5)
if (par6 == 'White Noise') par6 <- 'white' else par6 <- 'ma'
par7 <- as.numeric(par7)
if (par8 != '') par8 <- as.numeric(par8)
x <- na.omit(x)
ox <- x
if (par8 == '') {
if (par2 == 0) {
x <- log(x)
} else {
x <- (x ^ par2 - 1) / par2
}
} else {
x <- log(x,base=par8)
}
if (par3 > 0) x <- diff(x,lag=1,difference=par3)
if (par4 > 0) x <- diff(x,lag=par5,difference=par4)
bitmap(file='picts.png')
op <- par(mfrow=c(2,1))
plot(ox,type='l',main='Original Time Series',xlab='time',ylab='value')
if (par8=='') {
mytitle <- paste('Working Time Series (lambda=',par2,', d=',par3,', D=',par4,')',sep='')
mysub <- paste('(lambda=',par2,', d=',par3,', D=',par4,', CI=', par7, ', CI type=',par6,')',sep='')
} else {
mytitle <- paste('Working Time Series (base=',par8,', d=',par3,', D=',par4,')',sep='')
mysub <- paste('(base=',par8,', d=',par3,', D=',par4,', CI=', par7, ', CI type=',par6,')',sep='')
}
plot(x,type='l', main=mytitle,xlab='time',ylab='value')
par(op)
dev.off()
bitmap(file='pic1.png')
racf <- acf(x, par1, main='Autocorrelation', xlab='time lag', ylab='ACF', ci.type=par6, ci=par7, sub=mysub)
dev.off()
bitmap(file='pic2.png')
rpacf <- pacf(x,par1,main='Partial Autocorrelation',xlab='lags',ylab='PACF',sub=mysub)
dev.off()
(myacf <- c(racf$acf))
(mypacf <- c(rpacf$acf))
lengthx <- length(x)
sqrtn <- sqrt(lengthx)
load(file='createtable')
a<-table.start()
a<-table.row.start(a)
a<-table.element(a,'Autocorrelation Function',4,TRUE)
a<-table.row.end(a)
a<-table.row.start(a)
a<-table.element(a,'Time lag k',header=TRUE)
a<-table.element(a,hyperlink('basics.htm','ACF(k)','click here for more information about the Autocorrelation Function'),header=TRUE)
a<-table.element(a,'T-STAT',header=TRUE)
a<-table.element(a,'P-value',header=TRUE)
a<-table.row.end(a)
for (i in 2:(par1+1)) {
a<-table.row.start(a)
a<-table.element(a,i-1,header=TRUE)
a<-table.element(a,round(myacf[i],6))
mytstat <- myacf[i]*sqrtn
a<-table.element(a,round(mytstat,4))
a<-table.element(a,round(1-pt(abs(mytstat),lengthx),6))
a<-table.row.end(a)
}
a<-table.end(a)
table.save(a,file='mytable.tab')
a<-table.start()
a<-table.row.start(a)
a<-table.element(a,'Partial Autocorrelation Function',4,TRUE)
a<-table.row.end(a)
a<-table.row.start(a)
a<-table.element(a,'Time lag k',header=TRUE)
a<-table.element(a,hyperlink('basics.htm','PACF(k)','click here for more information about the Partial Autocorrelation Function'),header=TRUE)
a<-table.element(a,'T-STAT',header=TRUE)
a<-table.element(a,'P-value',header=TRUE)
a<-table.row.end(a)
for (i in 1:par1) {
a<-table.row.start(a)
a<-table.element(a,i,header=TRUE)
a<-table.element(a,round(mypacf[i],6))
mytstat <- mypacf[i]*sqrtn
a<-table.element(a,round(mytstat,4))
a<-table.element(a,round(1-pt(abs(mytstat),lengthx),6))
a<-table.row.end(a)
}
a<-table.end(a)
table.save(a,file='mytable1.tab')