Free Statistics

of Irreproducible Research!

Author's title

Author*Unverified author*
R Software Modulerwasp_autocorrelation.wasp
Title produced by software(Partial) Autocorrelation Function
Date of computationThu, 16 Mar 2017 18:54:23 +0000
Cite this page as followsStatistical Computations at FreeStatistics.org, Office for Research Development and Education, URL https://freestatistics.org/blog/index.php?v=date/2017/Mar/16/t1489690549wrohewiw5kdchd8.htm/, Retrieved Tue, 14 May 2024 13:33:31 +0200
Statistical Computations at FreeStatistics.org, Office for Research Development and Education, URL https://freestatistics.org/blog/index.php?pk=, Retrieved Tue, 14 May 2024 13:33:31 +0200
QR Codes:

Original text written by user:
IsPrivate?No (this computation is public)
User-defined keywords
Estimated Impact0
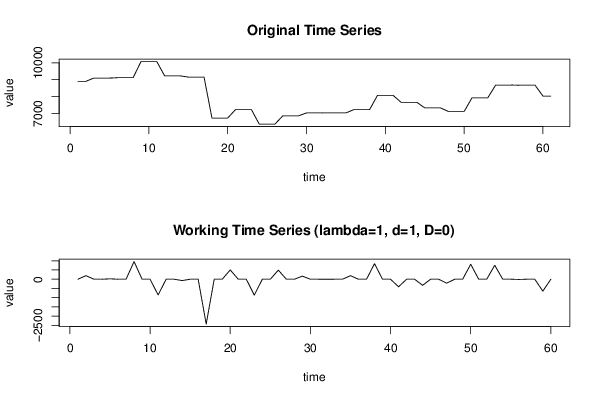
Dataseries X:
8899
8899
9093
9093
9093
9116
9116
9116
10073
10073
10073
9223
9223
9223
9151
9151
9151
6727
6727
6727
7232
7232
7232
6370
6370
6370
6862
6862
6862
7029
7029
7029
7031
7031
7031
7223
7223
7223
8065
8065
8065
7657
7657
7657
7328
7328
7328
7115
7115
7115
7926
7926
7926
8681
8681
8681
8670
8670
8670
8028
8028


Summary of computational transaction
Raw Inputview raw input (R code)
Raw Outputview raw output of R engine
Computing time2 seconds
R Server'Sir Ronald Aylmer Fisher' @ fisher.wessa.net

\begin{tabular}{lllllllll}
\hline
Summary of computational transaction \tabularnewline
Raw Input & view raw input (R code)  \tabularnewline
Raw Output & view raw output of R engine  \tabularnewline
Computing time & 2 seconds \tabularnewline
R Server & 'Sir Ronald Aylmer Fisher' @ fisher.wessa.net \tabularnewline
\hline
\end{tabular}
%Source: https://freestatistics.org/blog/index.php?pk=&T=0

[TABLE]
[ROW][C]Summary of computational transaction[/C][/ROW]
[ROW][C]Raw Input[/C][C]view raw input (R code) [/C][/ROW]
[ROW][C]Raw Output[/C][C]view raw output of R engine [/C][/ROW]
[ROW][C]Computing time[/C][C]2 seconds[/C][/ROW]
[ROW][C]R Server[/C][C]'Sir Ronald Aylmer Fisher' @ fisher.wessa.net[/C][/ROW]
[/TABLE]
Source: https://freestatistics.org/blog/index.php?pk=&T=0

Globally Unique Identifier (entire table): ba.freestatistics.org/blog/index.php?pk=&T=0

As an alternative you can also use a QR Code:  

The GUIDs for individual cells are displayed in the table below:

Summary of computational transaction
Raw Inputview raw input (R code)
Raw Outputview raw output of R engine
Computing time2 seconds
R Server'Sir Ronald Aylmer Fisher' @ fisher.wessa.net


Autocorrelation Function
Time lag kACF(k)T-STATP-value
1-0.001116-0.00860.496566
2-0.00057-0.00440.498247
3-0.18213-1.41080.081738
4-0.000606-0.00470.498134
5-0.00064-0.0050.498031
60.2736992.12010.019073
7-0.000676-0.00520.497919
8-0.002852-0.02210.491224
9-0.442965-3.43120.000547
10-0.002889-0.02240.491111
11-0.002858-0.02210.491206
120.1153050.89310.187674
13-0.002894-0.02240.491094
14-0.002554-0.01980.492142
15-0.141169-1.09350.139275
16-0.00259-0.02010.49203
170.0008610.00670.49735
180.080730.62530.267061
190.0008240.00640.497463
200.0006840.00530.497895
21-0.21512-1.66630.050432
220.0006470.0050.498008
230.0006540.00510.497987
240.1122490.86950.194026
250.0006180.00480.498099
26-0.000263-0.0020.499192
27-0.009913-0.07680.469525
28-0.000299-0.00230.499079
29-0.000531-0.00410.498367
300.1160880.89920.186066
31-0.000567-0.00440.498255
32-0.000798-0.00620.497543
33-0.168354-1.30410.098596
34-0.000835-0.00650.49743
35-0.001715-0.01330.494722
36-0.116373-0.90140.185485
37-0.001752-0.01360.494609
38-0.001745-0.01350.49463
39-0.117384-0.90930.183426
40-0.001782-0.01380.494518
41-0.001922-0.01490.494085
420.138931.07610.143086
43-0.001959-0.01520.493973
440.0014920.01160.495407
450.0670570.51940.302688
460.0014560.01130.49552
470.0017970.01390.494471
480.0634060.49110.31256

\begin{tabular}{lllllllll}
\hline
Autocorrelation Function \tabularnewline
Time lag k & ACF(k) & T-STAT & P-value \tabularnewline
1 & -0.001116 & -0.0086 & 0.496566 \tabularnewline
2 & -0.00057 & -0.0044 & 0.498247 \tabularnewline
3 & -0.18213 & -1.4108 & 0.081738 \tabularnewline
4 & -0.000606 & -0.0047 & 0.498134 \tabularnewline
5 & -0.00064 & -0.005 & 0.498031 \tabularnewline
6 & 0.273699 & 2.1201 & 0.019073 \tabularnewline
7 & -0.000676 & -0.0052 & 0.497919 \tabularnewline
8 & -0.002852 & -0.0221 & 0.491224 \tabularnewline
9 & -0.442965 & -3.4312 & 0.000547 \tabularnewline
10 & -0.002889 & -0.0224 & 0.491111 \tabularnewline
11 & -0.002858 & -0.0221 & 0.491206 \tabularnewline
12 & 0.115305 & 0.8931 & 0.187674 \tabularnewline
13 & -0.002894 & -0.0224 & 0.491094 \tabularnewline
14 & -0.002554 & -0.0198 & 0.492142 \tabularnewline
15 & -0.141169 & -1.0935 & 0.139275 \tabularnewline
16 & -0.00259 & -0.0201 & 0.49203 \tabularnewline
17 & 0.000861 & 0.0067 & 0.49735 \tabularnewline
18 & 0.08073 & 0.6253 & 0.267061 \tabularnewline
19 & 0.000824 & 0.0064 & 0.497463 \tabularnewline
20 & 0.000684 & 0.0053 & 0.497895 \tabularnewline
21 & -0.21512 & -1.6663 & 0.050432 \tabularnewline
22 & 0.000647 & 0.005 & 0.498008 \tabularnewline
23 & 0.000654 & 0.0051 & 0.497987 \tabularnewline
24 & 0.112249 & 0.8695 & 0.194026 \tabularnewline
25 & 0.000618 & 0.0048 & 0.498099 \tabularnewline
26 & -0.000263 & -0.002 & 0.499192 \tabularnewline
27 & -0.009913 & -0.0768 & 0.469525 \tabularnewline
28 & -0.000299 & -0.0023 & 0.499079 \tabularnewline
29 & -0.000531 & -0.0041 & 0.498367 \tabularnewline
30 & 0.116088 & 0.8992 & 0.186066 \tabularnewline
31 & -0.000567 & -0.0044 & 0.498255 \tabularnewline
32 & -0.000798 & -0.0062 & 0.497543 \tabularnewline
33 & -0.168354 & -1.3041 & 0.098596 \tabularnewline
34 & -0.000835 & -0.0065 & 0.49743 \tabularnewline
35 & -0.001715 & -0.0133 & 0.494722 \tabularnewline
36 & -0.116373 & -0.9014 & 0.185485 \tabularnewline
37 & -0.001752 & -0.0136 & 0.494609 \tabularnewline
38 & -0.001745 & -0.0135 & 0.49463 \tabularnewline
39 & -0.117384 & -0.9093 & 0.183426 \tabularnewline
40 & -0.001782 & -0.0138 & 0.494518 \tabularnewline
41 & -0.001922 & -0.0149 & 0.494085 \tabularnewline
42 & 0.13893 & 1.0761 & 0.143086 \tabularnewline
43 & -0.001959 & -0.0152 & 0.493973 \tabularnewline
44 & 0.001492 & 0.0116 & 0.495407 \tabularnewline
45 & 0.067057 & 0.5194 & 0.302688 \tabularnewline
46 & 0.001456 & 0.0113 & 0.49552 \tabularnewline
47 & 0.001797 & 0.0139 & 0.494471 \tabularnewline
48 & 0.063406 & 0.4911 & 0.31256 \tabularnewline
\hline
\end{tabular}
%Source: https://freestatistics.org/blog/index.php?pk=&T=1

[TABLE]
[ROW][C]Autocorrelation Function[/C][/ROW]
[ROW][C]Time lag k[/C][C]ACF(k)[/C][C]T-STAT[/C][C]P-value[/C][/ROW]
[ROW][C]1[/C][C]-0.001116[/C][C]-0.0086[/C][C]0.496566[/C][/ROW]
[ROW][C]2[/C][C]-0.00057[/C][C]-0.0044[/C][C]0.498247[/C][/ROW]
[ROW][C]3[/C][C]-0.18213[/C][C]-1.4108[/C][C]0.081738[/C][/ROW]
[ROW][C]4[/C][C]-0.000606[/C][C]-0.0047[/C][C]0.498134[/C][/ROW]
[ROW][C]5[/C][C]-0.00064[/C][C]-0.005[/C][C]0.498031[/C][/ROW]
[ROW][C]6[/C][C]0.273699[/C][C]2.1201[/C][C]0.019073[/C][/ROW]
[ROW][C]7[/C][C]-0.000676[/C][C]-0.0052[/C][C]0.497919[/C][/ROW]
[ROW][C]8[/C][C]-0.002852[/C][C]-0.0221[/C][C]0.491224[/C][/ROW]
[ROW][C]9[/C][C]-0.442965[/C][C]-3.4312[/C][C]0.000547[/C][/ROW]
[ROW][C]10[/C][C]-0.002889[/C][C]-0.0224[/C][C]0.491111[/C][/ROW]
[ROW][C]11[/C][C]-0.002858[/C][C]-0.0221[/C][C]0.491206[/C][/ROW]
[ROW][C]12[/C][C]0.115305[/C][C]0.8931[/C][C]0.187674[/C][/ROW]
[ROW][C]13[/C][C]-0.002894[/C][C]-0.0224[/C][C]0.491094[/C][/ROW]
[ROW][C]14[/C][C]-0.002554[/C][C]-0.0198[/C][C]0.492142[/C][/ROW]
[ROW][C]15[/C][C]-0.141169[/C][C]-1.0935[/C][C]0.139275[/C][/ROW]
[ROW][C]16[/C][C]-0.00259[/C][C]-0.0201[/C][C]0.49203[/C][/ROW]
[ROW][C]17[/C][C]0.000861[/C][C]0.0067[/C][C]0.49735[/C][/ROW]
[ROW][C]18[/C][C]0.08073[/C][C]0.6253[/C][C]0.267061[/C][/ROW]
[ROW][C]19[/C][C]0.000824[/C][C]0.0064[/C][C]0.497463[/C][/ROW]
[ROW][C]20[/C][C]0.000684[/C][C]0.0053[/C][C]0.497895[/C][/ROW]
[ROW][C]21[/C][C]-0.21512[/C][C]-1.6663[/C][C]0.050432[/C][/ROW]
[ROW][C]22[/C][C]0.000647[/C][C]0.005[/C][C]0.498008[/C][/ROW]
[ROW][C]23[/C][C]0.000654[/C][C]0.0051[/C][C]0.497987[/C][/ROW]
[ROW][C]24[/C][C]0.112249[/C][C]0.8695[/C][C]0.194026[/C][/ROW]
[ROW][C]25[/C][C]0.000618[/C][C]0.0048[/C][C]0.498099[/C][/ROW]
[ROW][C]26[/C][C]-0.000263[/C][C]-0.002[/C][C]0.499192[/C][/ROW]
[ROW][C]27[/C][C]-0.009913[/C][C]-0.0768[/C][C]0.469525[/C][/ROW]
[ROW][C]28[/C][C]-0.000299[/C][C]-0.0023[/C][C]0.499079[/C][/ROW]
[ROW][C]29[/C][C]-0.000531[/C][C]-0.0041[/C][C]0.498367[/C][/ROW]
[ROW][C]30[/C][C]0.116088[/C][C]0.8992[/C][C]0.186066[/C][/ROW]
[ROW][C]31[/C][C]-0.000567[/C][C]-0.0044[/C][C]0.498255[/C][/ROW]
[ROW][C]32[/C][C]-0.000798[/C][C]-0.0062[/C][C]0.497543[/C][/ROW]
[ROW][C]33[/C][C]-0.168354[/C][C]-1.3041[/C][C]0.098596[/C][/ROW]
[ROW][C]34[/C][C]-0.000835[/C][C]-0.0065[/C][C]0.49743[/C][/ROW]
[ROW][C]35[/C][C]-0.001715[/C][C]-0.0133[/C][C]0.494722[/C][/ROW]
[ROW][C]36[/C][C]-0.116373[/C][C]-0.9014[/C][C]0.185485[/C][/ROW]
[ROW][C]37[/C][C]-0.001752[/C][C]-0.0136[/C][C]0.494609[/C][/ROW]
[ROW][C]38[/C][C]-0.001745[/C][C]-0.0135[/C][C]0.49463[/C][/ROW]
[ROW][C]39[/C][C]-0.117384[/C][C]-0.9093[/C][C]0.183426[/C][/ROW]
[ROW][C]40[/C][C]-0.001782[/C][C]-0.0138[/C][C]0.494518[/C][/ROW]
[ROW][C]41[/C][C]-0.001922[/C][C]-0.0149[/C][C]0.494085[/C][/ROW]
[ROW][C]42[/C][C]0.13893[/C][C]1.0761[/C][C]0.143086[/C][/ROW]
[ROW][C]43[/C][C]-0.001959[/C][C]-0.0152[/C][C]0.493973[/C][/ROW]
[ROW][C]44[/C][C]0.001492[/C][C]0.0116[/C][C]0.495407[/C][/ROW]
[ROW][C]45[/C][C]0.067057[/C][C]0.5194[/C][C]0.302688[/C][/ROW]
[ROW][C]46[/C][C]0.001456[/C][C]0.0113[/C][C]0.49552[/C][/ROW]
[ROW][C]47[/C][C]0.001797[/C][C]0.0139[/C][C]0.494471[/C][/ROW]
[ROW][C]48[/C][C]0.063406[/C][C]0.4911[/C][C]0.31256[/C][/ROW]
[/TABLE]
Source: https://freestatistics.org/blog/index.php?pk=&T=1

Globally Unique Identifier (entire table): ba.freestatistics.org/blog/index.php?pk=&T=1

As an alternative you can also use a QR Code:  

The GUIDs for individual cells are displayed in the table below:

Autocorrelation Function
Time lag kACF(k)T-STATP-value
1-0.001116-0.00860.496566
2-0.00057-0.00440.498247
3-0.18213-1.41080.081738
4-0.000606-0.00470.498134
5-0.00064-0.0050.498031
60.2736992.12010.019073
7-0.000676-0.00520.497919
8-0.002852-0.02210.491224
9-0.442965-3.43120.000547
10-0.002889-0.02240.491111
11-0.002858-0.02210.491206
120.1153050.89310.187674
13-0.002894-0.02240.491094
14-0.002554-0.01980.492142
15-0.141169-1.09350.139275
16-0.00259-0.02010.49203
170.0008610.00670.49735
180.080730.62530.267061
190.0008240.00640.497463
200.0006840.00530.497895
21-0.21512-1.66630.050432
220.0006470.0050.498008
230.0006540.00510.497987
240.1122490.86950.194026
250.0006180.00480.498099
26-0.000263-0.0020.499192
27-0.009913-0.07680.469525
28-0.000299-0.00230.499079
29-0.000531-0.00410.498367
300.1160880.89920.186066
31-0.000567-0.00440.498255
32-0.000798-0.00620.497543
33-0.168354-1.30410.098596
34-0.000835-0.00650.49743
35-0.001715-0.01330.494722
36-0.116373-0.90140.185485
37-0.001752-0.01360.494609
38-0.001745-0.01350.49463
39-0.117384-0.90930.183426
40-0.001782-0.01380.494518
41-0.001922-0.01490.494085
420.138931.07610.143086
43-0.001959-0.01520.493973
440.0014920.01160.495407
450.0670570.51940.302688
460.0014560.01130.49552
470.0017970.01390.494471
480.0634060.49110.31256


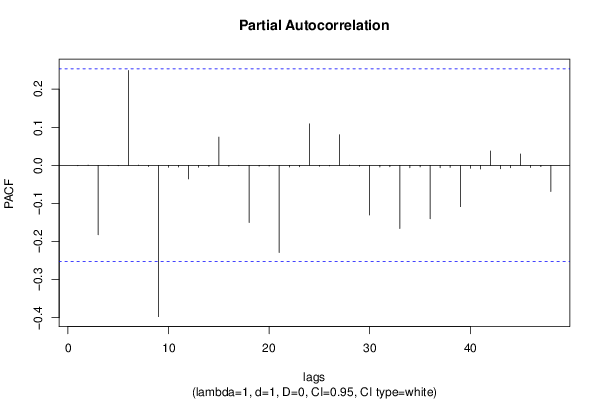
Partial Autocorrelation Function
Time lag kPACF(k)T-STATP-value
1-0.001116-0.00860.496566
2-0.000571-0.00440.498243
3-0.182132-1.41080.081736
4-0.001068-0.00830.496714
5-0.000917-0.00710.497178
60.2487771.9270.029358
7-0.000341-0.00260.498951
8-0.002996-0.02320.490781
9-0.397159-3.07640.001577
10-0.005195-0.04020.484017
11-0.004432-0.03430.486363
12-0.035508-0.2750.392113
13-0.004808-0.03720.485207
14-0.002973-0.0230.490852
150.0741680.57450.283888
16-0.002356-0.01820.49275
17-0.000625-0.00480.498078
18-0.150127-1.16290.124741
19-0.002046-0.01580.493703
20-0.001604-0.01240.495065
21-0.228723-1.77170.040763
22-0.004151-0.03220.487227
23-0.003627-0.02810.488839
240.1088040.84280.201346
25-0.002447-0.0190.492469
26-0.0014-0.01080.495692
270.0802210.62140.268349
28-0.000587-0.00450.498192
29-0.002612-0.02020.491962
30-0.130238-1.00880.158557
31-0.004186-0.03240.487121
32-0.003851-0.02980.488152
33-0.16596-1.28550.101775
34-0.006276-0.04860.480694
35-0.004021-0.03110.487627
36-0.139996-1.08440.141262
37-0.006504-0.05040.479995
38-0.005352-0.04150.483534
39-0.108334-0.83920.202358
40-0.007633-0.05910.476525
41-0.009533-0.07380.47069
420.0377220.29220.385572
43-0.00892-0.06910.472572
44-0.006125-0.04740.481158
450.0296560.22970.409549
46-0.005648-0.04370.482625
47-0.00339-0.02630.489569
48-0.068836-0.53320.297932

\begin{tabular}{lllllllll}
\hline
Partial Autocorrelation Function \tabularnewline
Time lag k & PACF(k) & T-STAT & P-value \tabularnewline
1 & -0.001116 & -0.0086 & 0.496566 \tabularnewline
2 & -0.000571 & -0.0044 & 0.498243 \tabularnewline
3 & -0.182132 & -1.4108 & 0.081736 \tabularnewline
4 & -0.001068 & -0.0083 & 0.496714 \tabularnewline
5 & -0.000917 & -0.0071 & 0.497178 \tabularnewline
6 & 0.248777 & 1.927 & 0.029358 \tabularnewline
7 & -0.000341 & -0.0026 & 0.498951 \tabularnewline
8 & -0.002996 & -0.0232 & 0.490781 \tabularnewline
9 & -0.397159 & -3.0764 & 0.001577 \tabularnewline
10 & -0.005195 & -0.0402 & 0.484017 \tabularnewline
11 & -0.004432 & -0.0343 & 0.486363 \tabularnewline
12 & -0.035508 & -0.275 & 0.392113 \tabularnewline
13 & -0.004808 & -0.0372 & 0.485207 \tabularnewline
14 & -0.002973 & -0.023 & 0.490852 \tabularnewline
15 & 0.074168 & 0.5745 & 0.283888 \tabularnewline
16 & -0.002356 & -0.0182 & 0.49275 \tabularnewline
17 & -0.000625 & -0.0048 & 0.498078 \tabularnewline
18 & -0.150127 & -1.1629 & 0.124741 \tabularnewline
19 & -0.002046 & -0.0158 & 0.493703 \tabularnewline
20 & -0.001604 & -0.0124 & 0.495065 \tabularnewline
21 & -0.228723 & -1.7717 & 0.040763 \tabularnewline
22 & -0.004151 & -0.0322 & 0.487227 \tabularnewline
23 & -0.003627 & -0.0281 & 0.488839 \tabularnewline
24 & 0.108804 & 0.8428 & 0.201346 \tabularnewline
25 & -0.002447 & -0.019 & 0.492469 \tabularnewline
26 & -0.0014 & -0.0108 & 0.495692 \tabularnewline
27 & 0.080221 & 0.6214 & 0.268349 \tabularnewline
28 & -0.000587 & -0.0045 & 0.498192 \tabularnewline
29 & -0.002612 & -0.0202 & 0.491962 \tabularnewline
30 & -0.130238 & -1.0088 & 0.158557 \tabularnewline
31 & -0.004186 & -0.0324 & 0.487121 \tabularnewline
32 & -0.003851 & -0.0298 & 0.488152 \tabularnewline
33 & -0.16596 & -1.2855 & 0.101775 \tabularnewline
34 & -0.006276 & -0.0486 & 0.480694 \tabularnewline
35 & -0.004021 & -0.0311 & 0.487627 \tabularnewline
36 & -0.139996 & -1.0844 & 0.141262 \tabularnewline
37 & -0.006504 & -0.0504 & 0.479995 \tabularnewline
38 & -0.005352 & -0.0415 & 0.483534 \tabularnewline
39 & -0.108334 & -0.8392 & 0.202358 \tabularnewline
40 & -0.007633 & -0.0591 & 0.476525 \tabularnewline
41 & -0.009533 & -0.0738 & 0.47069 \tabularnewline
42 & 0.037722 & 0.2922 & 0.385572 \tabularnewline
43 & -0.00892 & -0.0691 & 0.472572 \tabularnewline
44 & -0.006125 & -0.0474 & 0.481158 \tabularnewline
45 & 0.029656 & 0.2297 & 0.409549 \tabularnewline
46 & -0.005648 & -0.0437 & 0.482625 \tabularnewline
47 & -0.00339 & -0.0263 & 0.489569 \tabularnewline
48 & -0.068836 & -0.5332 & 0.297932 \tabularnewline
\hline
\end{tabular}
%Source: https://freestatistics.org/blog/index.php?pk=&T=2

[TABLE]
[ROW][C]Partial Autocorrelation Function[/C][/ROW]
[ROW][C]Time lag k[/C][C]PACF(k)[/C][C]T-STAT[/C][C]P-value[/C][/ROW]
[ROW][C]1[/C][C]-0.001116[/C][C]-0.0086[/C][C]0.496566[/C][/ROW]
[ROW][C]2[/C][C]-0.000571[/C][C]-0.0044[/C][C]0.498243[/C][/ROW]
[ROW][C]3[/C][C]-0.182132[/C][C]-1.4108[/C][C]0.081736[/C][/ROW]
[ROW][C]4[/C][C]-0.001068[/C][C]-0.0083[/C][C]0.496714[/C][/ROW]
[ROW][C]5[/C][C]-0.000917[/C][C]-0.0071[/C][C]0.497178[/C][/ROW]
[ROW][C]6[/C][C]0.248777[/C][C]1.927[/C][C]0.029358[/C][/ROW]
[ROW][C]7[/C][C]-0.000341[/C][C]-0.0026[/C][C]0.498951[/C][/ROW]
[ROW][C]8[/C][C]-0.002996[/C][C]-0.0232[/C][C]0.490781[/C][/ROW]
[ROW][C]9[/C][C]-0.397159[/C][C]-3.0764[/C][C]0.001577[/C][/ROW]
[ROW][C]10[/C][C]-0.005195[/C][C]-0.0402[/C][C]0.484017[/C][/ROW]
[ROW][C]11[/C][C]-0.004432[/C][C]-0.0343[/C][C]0.486363[/C][/ROW]
[ROW][C]12[/C][C]-0.035508[/C][C]-0.275[/C][C]0.392113[/C][/ROW]
[ROW][C]13[/C][C]-0.004808[/C][C]-0.0372[/C][C]0.485207[/C][/ROW]
[ROW][C]14[/C][C]-0.002973[/C][C]-0.023[/C][C]0.490852[/C][/ROW]
[ROW][C]15[/C][C]0.074168[/C][C]0.5745[/C][C]0.283888[/C][/ROW]
[ROW][C]16[/C][C]-0.002356[/C][C]-0.0182[/C][C]0.49275[/C][/ROW]
[ROW][C]17[/C][C]-0.000625[/C][C]-0.0048[/C][C]0.498078[/C][/ROW]
[ROW][C]18[/C][C]-0.150127[/C][C]-1.1629[/C][C]0.124741[/C][/ROW]
[ROW][C]19[/C][C]-0.002046[/C][C]-0.0158[/C][C]0.493703[/C][/ROW]
[ROW][C]20[/C][C]-0.001604[/C][C]-0.0124[/C][C]0.495065[/C][/ROW]
[ROW][C]21[/C][C]-0.228723[/C][C]-1.7717[/C][C]0.040763[/C][/ROW]
[ROW][C]22[/C][C]-0.004151[/C][C]-0.0322[/C][C]0.487227[/C][/ROW]
[ROW][C]23[/C][C]-0.003627[/C][C]-0.0281[/C][C]0.488839[/C][/ROW]
[ROW][C]24[/C][C]0.108804[/C][C]0.8428[/C][C]0.201346[/C][/ROW]
[ROW][C]25[/C][C]-0.002447[/C][C]-0.019[/C][C]0.492469[/C][/ROW]
[ROW][C]26[/C][C]-0.0014[/C][C]-0.0108[/C][C]0.495692[/C][/ROW]
[ROW][C]27[/C][C]0.080221[/C][C]0.6214[/C][C]0.268349[/C][/ROW]
[ROW][C]28[/C][C]-0.000587[/C][C]-0.0045[/C][C]0.498192[/C][/ROW]
[ROW][C]29[/C][C]-0.002612[/C][C]-0.0202[/C][C]0.491962[/C][/ROW]
[ROW][C]30[/C][C]-0.130238[/C][C]-1.0088[/C][C]0.158557[/C][/ROW]
[ROW][C]31[/C][C]-0.004186[/C][C]-0.0324[/C][C]0.487121[/C][/ROW]
[ROW][C]32[/C][C]-0.003851[/C][C]-0.0298[/C][C]0.488152[/C][/ROW]
[ROW][C]33[/C][C]-0.16596[/C][C]-1.2855[/C][C]0.101775[/C][/ROW]
[ROW][C]34[/C][C]-0.006276[/C][C]-0.0486[/C][C]0.480694[/C][/ROW]
[ROW][C]35[/C][C]-0.004021[/C][C]-0.0311[/C][C]0.487627[/C][/ROW]
[ROW][C]36[/C][C]-0.139996[/C][C]-1.0844[/C][C]0.141262[/C][/ROW]
[ROW][C]37[/C][C]-0.006504[/C][C]-0.0504[/C][C]0.479995[/C][/ROW]
[ROW][C]38[/C][C]-0.005352[/C][C]-0.0415[/C][C]0.483534[/C][/ROW]
[ROW][C]39[/C][C]-0.108334[/C][C]-0.8392[/C][C]0.202358[/C][/ROW]
[ROW][C]40[/C][C]-0.007633[/C][C]-0.0591[/C][C]0.476525[/C][/ROW]
[ROW][C]41[/C][C]-0.009533[/C][C]-0.0738[/C][C]0.47069[/C][/ROW]
[ROW][C]42[/C][C]0.037722[/C][C]0.2922[/C][C]0.385572[/C][/ROW]
[ROW][C]43[/C][C]-0.00892[/C][C]-0.0691[/C][C]0.472572[/C][/ROW]
[ROW][C]44[/C][C]-0.006125[/C][C]-0.0474[/C][C]0.481158[/C][/ROW]
[ROW][C]45[/C][C]0.029656[/C][C]0.2297[/C][C]0.409549[/C][/ROW]
[ROW][C]46[/C][C]-0.005648[/C][C]-0.0437[/C][C]0.482625[/C][/ROW]
[ROW][C]47[/C][C]-0.00339[/C][C]-0.0263[/C][C]0.489569[/C][/ROW]
[ROW][C]48[/C][C]-0.068836[/C][C]-0.5332[/C][C]0.297932[/C][/ROW]
[/TABLE]
Source: https://freestatistics.org/blog/index.php?pk=&T=2

Globally Unique Identifier (entire table): ba.freestatistics.org/blog/index.php?pk=&T=2

As an alternative you can also use a QR Code:  

The GUIDs for individual cells are displayed in the table below:

Partial Autocorrelation Function
Time lag kPACF(k)T-STATP-value
1-0.001116-0.00860.496566
2-0.000571-0.00440.498243
3-0.182132-1.41080.081736
4-0.001068-0.00830.496714
5-0.000917-0.00710.497178
60.2487771.9270.029358
7-0.000341-0.00260.498951
8-0.002996-0.02320.490781
9-0.397159-3.07640.001577
10-0.005195-0.04020.484017
11-0.004432-0.03430.486363
12-0.035508-0.2750.392113
13-0.004808-0.03720.485207
14-0.002973-0.0230.490852
150.0741680.57450.283888
16-0.002356-0.01820.49275
17-0.000625-0.00480.498078
18-0.150127-1.16290.124741
19-0.002046-0.01580.493703
20-0.001604-0.01240.495065
21-0.228723-1.77170.040763
22-0.004151-0.03220.487227
23-0.003627-0.02810.488839
240.1088040.84280.201346
25-0.002447-0.0190.492469
26-0.0014-0.01080.495692
270.0802210.62140.268349
28-0.000587-0.00450.498192
29-0.002612-0.02020.491962
30-0.130238-1.00880.158557
31-0.004186-0.03240.487121
32-0.003851-0.02980.488152
33-0.16596-1.28550.101775
34-0.006276-0.04860.480694
35-0.004021-0.03110.487627
36-0.139996-1.08440.141262
37-0.006504-0.05040.479995
38-0.005352-0.04150.483534
39-0.108334-0.83920.202358
40-0.007633-0.05910.476525
41-0.009533-0.07380.47069
420.0377220.29220.385572
43-0.00892-0.06910.472572
44-0.006125-0.04740.481158
450.0296560.22970.409549
46-0.005648-0.04370.482625
47-0.00339-0.02630.489569
48-0.068836-0.53320.297932


Parameters (Session):
par1 = 48 ; par2 = 1 ; par3 = 1 ; par4 = 0 ; par5 = 12 ; par6 = White Noise ; par7 = 0.95 ;
Parameters (R input):
par1 = 48 ; par2 = 1 ; par3 = 1 ; par4 = 0 ; par5 = 12 ; par6 = White Noise ; par7 = 0.95 ; par8 = ;
R code (references can be found in the software module):
if (par1 == 'Default') {
par1 = 10*log10(length(x))
} else {
par1 <- as.numeric(par1)
}
par2 <- as.numeric(par2)
par3 <- as.numeric(par3)
par4 <- as.numeric(par4)
par5 <- as.numeric(par5)
if (par6 == 'White Noise') par6 <- 'white' else par6 <- 'ma'
par7 <- as.numeric(par7)
if (par8 != '') par8 <- as.numeric(par8)
x <- na.omit(x)
ox <- x
if (par8 == '') {
if (par2 == 0) {
x <- log(x)
} else {
x <- (x ^ par2 - 1) / par2
}
} else {
x <- log(x,base=par8)
}
if (par3 > 0) x <- diff(x,lag=1,difference=par3)
if (par4 > 0) x <- diff(x,lag=par5,difference=par4)
bitmap(file='picts.png')
op <- par(mfrow=c(2,1))
plot(ox,type='l',main='Original Time Series',xlab='time',ylab='value')
if (par8=='') {
mytitle <- paste('Working Time Series (lambda=',par2,', d=',par3,', D=',par4,')',sep='')
mysub <- paste('(lambda=',par2,', d=',par3,', D=',par4,', CI=', par7, ', CI type=',par6,')',sep='')
} else {
mytitle <- paste('Working Time Series (base=',par8,', d=',par3,', D=',par4,')',sep='')
mysub <- paste('(base=',par8,', d=',par3,', D=',par4,', CI=', par7, ', CI type=',par6,')',sep='')
}
plot(x,type='l', main=mytitle,xlab='time',ylab='value')
par(op)
dev.off()
bitmap(file='pic1.png')
racf <- acf(x, par1, main='Autocorrelation', xlab='time lag', ylab='ACF', ci.type=par6, ci=par7, sub=mysub)
dev.off()
bitmap(file='pic2.png')
rpacf <- pacf(x,par1,main='Partial Autocorrelation',xlab='lags',ylab='PACF',sub=mysub)
dev.off()
(myacf <- c(racf$acf))
(mypacf <- c(rpacf$acf))
lengthx <- length(x)
sqrtn <- sqrt(lengthx)
load(file='createtable')
a<-table.start()
a<-table.row.start(a)
a<-table.element(a,'Autocorrelation Function',4,TRUE)
a<-table.row.end(a)
a<-table.row.start(a)
a<-table.element(a,'Time lag k',header=TRUE)
a<-table.element(a,hyperlink('basics.htm','ACF(k)','click here for more information about the Autocorrelation Function'),header=TRUE)
a<-table.element(a,'T-STAT',header=TRUE)
a<-table.element(a,'P-value',header=TRUE)
a<-table.row.end(a)
for (i in 2:(par1+1)) {
a<-table.row.start(a)
a<-table.element(a,i-1,header=TRUE)
a<-table.element(a,round(myacf[i],6))
mytstat <- myacf[i]*sqrtn
a<-table.element(a,round(mytstat,4))
a<-table.element(a,round(1-pt(abs(mytstat),lengthx),6))
a<-table.row.end(a)
}
a<-table.end(a)
table.save(a,file='mytable.tab')
a<-table.start()
a<-table.row.start(a)
a<-table.element(a,'Partial Autocorrelation Function',4,TRUE)
a<-table.row.end(a)
a<-table.row.start(a)
a<-table.element(a,'Time lag k',header=TRUE)
a<-table.element(a,hyperlink('basics.htm','PACF(k)','click here for more information about the Partial Autocorrelation Function'),header=TRUE)
a<-table.element(a,'T-STAT',header=TRUE)
a<-table.element(a,'P-value',header=TRUE)
a<-table.row.end(a)
for (i in 1:par1) {
a<-table.row.start(a)
a<-table.element(a,i,header=TRUE)
a<-table.element(a,round(mypacf[i],6))
mytstat <- mypacf[i]*sqrtn
a<-table.element(a,round(mytstat,4))
a<-table.element(a,round(1-pt(abs(mytstat),lengthx),6))
a<-table.row.end(a)
}
a<-table.end(a)
table.save(a,file='mytable1.tab')