Free Statistics

of Irreproducible Research!

Author's title

Author*Unverified author*
R Software Modulerwasp_autocorrelation.wasp
Title produced by software(Partial) Autocorrelation Function
Date of computationFri, 17 Mar 2017 09:01:59 +0000
Cite this page as followsStatistical Computations at FreeStatistics.org, Office for Research Development and Education, URL https://freestatistics.org/blog/index.php?v=date/2017/Mar/17/t1489741385xsweezeabnuuhoe.htm/, Retrieved Tue, 14 May 2024 14:27:56 +0200
Statistical Computations at FreeStatistics.org, Office for Research Development and Education, URL https://freestatistics.org/blog/index.php?pk=, Retrieved Tue, 14 May 2024 14:27:56 +0200
QR Codes:

Original text written by user:
IsPrivate?No (this computation is public)
User-defined keywords
Estimated Impact0
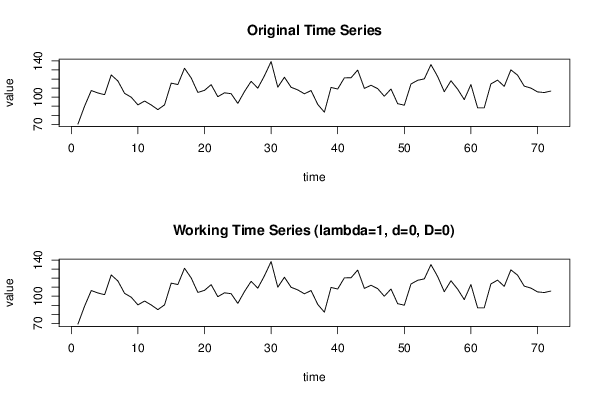
Dataseries X:
70,3
90,2
107,3
104,6
102,7
124,5
117,8
104,2
99,9
91,5
95,7
91,4
86,2
91,5
115,5
113,9
131,9
121,2
105,2
107,5
113,8
100,5
104,8
103,8
93,1
106,2
117,5
109,9
123,6
139,3
111
122
110,9
108
103,7
107,3
92
83,4
110,7
109
121,3
121,4
129,9
109,7
113,1
109,4
101
109
92,8
91,1
114,5
118,6
120,2
135,9
122,8
106
118,1
108,9
97,3
113,9
88,3
88,3
114,6
118,8
111,9
130,1
124,3
112,2
110
105,8
105,1
106,7


Summary of computational transaction
Raw Inputview raw input (R code)
Raw Outputview raw output of R engine
Computing time2 seconds
R Server'Gwilym Jenkins' @ jenkins.wessa.net

\begin{tabular}{lllllllll}
\hline
Summary of computational transaction \tabularnewline
Raw Input & view raw input (R code)  \tabularnewline
Raw Output & view raw output of R engine  \tabularnewline
Computing time & 2 seconds \tabularnewline
R Server & 'Gwilym Jenkins' @ jenkins.wessa.net \tabularnewline
\hline
\end{tabular}
%Source: https://freestatistics.org/blog/index.php?pk=&T=0

[TABLE]
[ROW][C]Summary of computational transaction[/C][/ROW]
[ROW][C]Raw Input[/C][C]view raw input (R code) [/C][/ROW]
[ROW][C]Raw Output[/C][C]view raw output of R engine [/C][/ROW]
[ROW][C]Computing time[/C][C]2 seconds[/C][/ROW]
[ROW][C]R Server[/C][C]'Gwilym Jenkins' @ jenkins.wessa.net[/C][/ROW]
[/TABLE]
Source: https://freestatistics.org/blog/index.php?pk=&T=0

Globally Unique Identifier (entire table): ba.freestatistics.org/blog/index.php?pk=&T=0

As an alternative you can also use a QR Code:  

The GUIDs for individual cells are displayed in the table below:

Summary of computational transaction
Raw Inputview raw input (R code)
Raw Outputview raw output of R engine
Computing time2 seconds
R Server'Gwilym Jenkins' @ jenkins.wessa.net


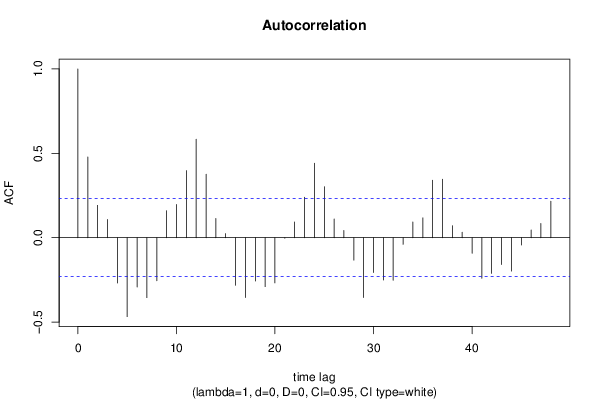
Autocorrelation Function
Time lag kACF(k)T-STATP-value
10.4777454.05386.3e-05
20.1916891.62650.054102
30.1079440.91590.18138
4-0.269187-2.28410.012657
5-0.46804-3.97148.4e-05
6-0.29233-2.48050.007729
7-0.355478-3.01630.001767
8-0.255186-2.16530.016839
90.1599261.3570.089508
100.1970671.67220.049416
110.3975623.37340.000599
120.5833054.94952e-06
130.3759543.19010.001054
140.1136340.96420.169082
150.0238830.20270.41999
16-0.282309-2.39550.009601
17-0.354387-3.00710.001815
18-0.256961-2.18040.016249
19-0.290035-2.4610.008126
20-0.268044-2.27440.012961
21-0.003026-0.02570.489792
220.0927180.78670.217009
230.2399632.03610.022707
240.4415073.74630.000179
250.3022432.56460.006207
260.1103980.93680.176008
270.0421410.35760.360853
28-0.132994-1.12850.131429
29-0.354379-3.0070.001816
30-0.206673-1.75370.041871
31-0.251018-2.130.018297
32-0.25263-2.14360.01772
33-0.039547-0.33560.369088
340.0928530.78790.216675
350.1174210.99630.161209
360.34052.88920.002549
370.3466392.94130.002196
380.0705470.59860.275655
390.0321650.27290.392844
40-0.091983-0.78050.218828
41-0.240412-2.040.022512
42-0.211526-1.79490.038437
43-0.158531-1.34520.091395
44-0.198047-1.68050.048598
45-0.043883-0.37240.355361
460.0450690.38240.351637
470.0840380.71310.239049
480.2160041.83290.035479

\begin{tabular}{lllllllll}
\hline
Autocorrelation Function \tabularnewline
Time lag k & ACF(k) & T-STAT & P-value \tabularnewline
1 & 0.477745 & 4.0538 & 6.3e-05 \tabularnewline
2 & 0.191689 & 1.6265 & 0.054102 \tabularnewline
3 & 0.107944 & 0.9159 & 0.18138 \tabularnewline
4 & -0.269187 & -2.2841 & 0.012657 \tabularnewline
5 & -0.46804 & -3.9714 & 8.4e-05 \tabularnewline
6 & -0.29233 & -2.4805 & 0.007729 \tabularnewline
7 & -0.355478 & -3.0163 & 0.001767 \tabularnewline
8 & -0.255186 & -2.1653 & 0.016839 \tabularnewline
9 & 0.159926 & 1.357 & 0.089508 \tabularnewline
10 & 0.197067 & 1.6722 & 0.049416 \tabularnewline
11 & 0.397562 & 3.3734 & 0.000599 \tabularnewline
12 & 0.583305 & 4.9495 & 2e-06 \tabularnewline
13 & 0.375954 & 3.1901 & 0.001054 \tabularnewline
14 & 0.113634 & 0.9642 & 0.169082 \tabularnewline
15 & 0.023883 & 0.2027 & 0.41999 \tabularnewline
16 & -0.282309 & -2.3955 & 0.009601 \tabularnewline
17 & -0.354387 & -3.0071 & 0.001815 \tabularnewline
18 & -0.256961 & -2.1804 & 0.016249 \tabularnewline
19 & -0.290035 & -2.461 & 0.008126 \tabularnewline
20 & -0.268044 & -2.2744 & 0.012961 \tabularnewline
21 & -0.003026 & -0.0257 & 0.489792 \tabularnewline
22 & 0.092718 & 0.7867 & 0.217009 \tabularnewline
23 & 0.239963 & 2.0361 & 0.022707 \tabularnewline
24 & 0.441507 & 3.7463 & 0.000179 \tabularnewline
25 & 0.302243 & 2.5646 & 0.006207 \tabularnewline
26 & 0.110398 & 0.9368 & 0.176008 \tabularnewline
27 & 0.042141 & 0.3576 & 0.360853 \tabularnewline
28 & -0.132994 & -1.1285 & 0.131429 \tabularnewline
29 & -0.354379 & -3.007 & 0.001816 \tabularnewline
30 & -0.206673 & -1.7537 & 0.041871 \tabularnewline
31 & -0.251018 & -2.13 & 0.018297 \tabularnewline
32 & -0.25263 & -2.1436 & 0.01772 \tabularnewline
33 & -0.039547 & -0.3356 & 0.369088 \tabularnewline
34 & 0.092853 & 0.7879 & 0.216675 \tabularnewline
35 & 0.117421 & 0.9963 & 0.161209 \tabularnewline
36 & 0.3405 & 2.8892 & 0.002549 \tabularnewline
37 & 0.346639 & 2.9413 & 0.002196 \tabularnewline
38 & 0.070547 & 0.5986 & 0.275655 \tabularnewline
39 & 0.032165 & 0.2729 & 0.392844 \tabularnewline
40 & -0.091983 & -0.7805 & 0.218828 \tabularnewline
41 & -0.240412 & -2.04 & 0.022512 \tabularnewline
42 & -0.211526 & -1.7949 & 0.038437 \tabularnewline
43 & -0.158531 & -1.3452 & 0.091395 \tabularnewline
44 & -0.198047 & -1.6805 & 0.048598 \tabularnewline
45 & -0.043883 & -0.3724 & 0.355361 \tabularnewline
46 & 0.045069 & 0.3824 & 0.351637 \tabularnewline
47 & 0.084038 & 0.7131 & 0.239049 \tabularnewline
48 & 0.216004 & 1.8329 & 0.035479 \tabularnewline
\hline
\end{tabular}
%Source: https://freestatistics.org/blog/index.php?pk=&T=1

[TABLE]
[ROW][C]Autocorrelation Function[/C][/ROW]
[ROW][C]Time lag k[/C][C]ACF(k)[/C][C]T-STAT[/C][C]P-value[/C][/ROW]
[ROW][C]1[/C][C]0.477745[/C][C]4.0538[/C][C]6.3e-05[/C][/ROW]
[ROW][C]2[/C][C]0.191689[/C][C]1.6265[/C][C]0.054102[/C][/ROW]
[ROW][C]3[/C][C]0.107944[/C][C]0.9159[/C][C]0.18138[/C][/ROW]
[ROW][C]4[/C][C]-0.269187[/C][C]-2.2841[/C][C]0.012657[/C][/ROW]
[ROW][C]5[/C][C]-0.46804[/C][C]-3.9714[/C][C]8.4e-05[/C][/ROW]
[ROW][C]6[/C][C]-0.29233[/C][C]-2.4805[/C][C]0.007729[/C][/ROW]
[ROW][C]7[/C][C]-0.355478[/C][C]-3.0163[/C][C]0.001767[/C][/ROW]
[ROW][C]8[/C][C]-0.255186[/C][C]-2.1653[/C][C]0.016839[/C][/ROW]
[ROW][C]9[/C][C]0.159926[/C][C]1.357[/C][C]0.089508[/C][/ROW]
[ROW][C]10[/C][C]0.197067[/C][C]1.6722[/C][C]0.049416[/C][/ROW]
[ROW][C]11[/C][C]0.397562[/C][C]3.3734[/C][C]0.000599[/C][/ROW]
[ROW][C]12[/C][C]0.583305[/C][C]4.9495[/C][C]2e-06[/C][/ROW]
[ROW][C]13[/C][C]0.375954[/C][C]3.1901[/C][C]0.001054[/C][/ROW]
[ROW][C]14[/C][C]0.113634[/C][C]0.9642[/C][C]0.169082[/C][/ROW]
[ROW][C]15[/C][C]0.023883[/C][C]0.2027[/C][C]0.41999[/C][/ROW]
[ROW][C]16[/C][C]-0.282309[/C][C]-2.3955[/C][C]0.009601[/C][/ROW]
[ROW][C]17[/C][C]-0.354387[/C][C]-3.0071[/C][C]0.001815[/C][/ROW]
[ROW][C]18[/C][C]-0.256961[/C][C]-2.1804[/C][C]0.016249[/C][/ROW]
[ROW][C]19[/C][C]-0.290035[/C][C]-2.461[/C][C]0.008126[/C][/ROW]
[ROW][C]20[/C][C]-0.268044[/C][C]-2.2744[/C][C]0.012961[/C][/ROW]
[ROW][C]21[/C][C]-0.003026[/C][C]-0.0257[/C][C]0.489792[/C][/ROW]
[ROW][C]22[/C][C]0.092718[/C][C]0.7867[/C][C]0.217009[/C][/ROW]
[ROW][C]23[/C][C]0.239963[/C][C]2.0361[/C][C]0.022707[/C][/ROW]
[ROW][C]24[/C][C]0.441507[/C][C]3.7463[/C][C]0.000179[/C][/ROW]
[ROW][C]25[/C][C]0.302243[/C][C]2.5646[/C][C]0.006207[/C][/ROW]
[ROW][C]26[/C][C]0.110398[/C][C]0.9368[/C][C]0.176008[/C][/ROW]
[ROW][C]27[/C][C]0.042141[/C][C]0.3576[/C][C]0.360853[/C][/ROW]
[ROW][C]28[/C][C]-0.132994[/C][C]-1.1285[/C][C]0.131429[/C][/ROW]
[ROW][C]29[/C][C]-0.354379[/C][C]-3.007[/C][C]0.001816[/C][/ROW]
[ROW][C]30[/C][C]-0.206673[/C][C]-1.7537[/C][C]0.041871[/C][/ROW]
[ROW][C]31[/C][C]-0.251018[/C][C]-2.13[/C][C]0.018297[/C][/ROW]
[ROW][C]32[/C][C]-0.25263[/C][C]-2.1436[/C][C]0.01772[/C][/ROW]
[ROW][C]33[/C][C]-0.039547[/C][C]-0.3356[/C][C]0.369088[/C][/ROW]
[ROW][C]34[/C][C]0.092853[/C][C]0.7879[/C][C]0.216675[/C][/ROW]
[ROW][C]35[/C][C]0.117421[/C][C]0.9963[/C][C]0.161209[/C][/ROW]
[ROW][C]36[/C][C]0.3405[/C][C]2.8892[/C][C]0.002549[/C][/ROW]
[ROW][C]37[/C][C]0.346639[/C][C]2.9413[/C][C]0.002196[/C][/ROW]
[ROW][C]38[/C][C]0.070547[/C][C]0.5986[/C][C]0.275655[/C][/ROW]
[ROW][C]39[/C][C]0.032165[/C][C]0.2729[/C][C]0.392844[/C][/ROW]
[ROW][C]40[/C][C]-0.091983[/C][C]-0.7805[/C][C]0.218828[/C][/ROW]
[ROW][C]41[/C][C]-0.240412[/C][C]-2.04[/C][C]0.022512[/C][/ROW]
[ROW][C]42[/C][C]-0.211526[/C][C]-1.7949[/C][C]0.038437[/C][/ROW]
[ROW][C]43[/C][C]-0.158531[/C][C]-1.3452[/C][C]0.091395[/C][/ROW]
[ROW][C]44[/C][C]-0.198047[/C][C]-1.6805[/C][C]0.048598[/C][/ROW]
[ROW][C]45[/C][C]-0.043883[/C][C]-0.3724[/C][C]0.355361[/C][/ROW]
[ROW][C]46[/C][C]0.045069[/C][C]0.3824[/C][C]0.351637[/C][/ROW]
[ROW][C]47[/C][C]0.084038[/C][C]0.7131[/C][C]0.239049[/C][/ROW]
[ROW][C]48[/C][C]0.216004[/C][C]1.8329[/C][C]0.035479[/C][/ROW]
[/TABLE]
Source: https://freestatistics.org/blog/index.php?pk=&T=1

Globally Unique Identifier (entire table): ba.freestatistics.org/blog/index.php?pk=&T=1

As an alternative you can also use a QR Code:  

The GUIDs for individual cells are displayed in the table below:

Autocorrelation Function
Time lag kACF(k)T-STATP-value
10.4777454.05386.3e-05
20.1916891.62650.054102
30.1079440.91590.18138
4-0.269187-2.28410.012657
5-0.46804-3.97148.4e-05
6-0.29233-2.48050.007729
7-0.355478-3.01630.001767
8-0.255186-2.16530.016839
90.1599261.3570.089508
100.1970671.67220.049416
110.3975623.37340.000599
120.5833054.94952e-06
130.3759543.19010.001054
140.1136340.96420.169082
150.0238830.20270.41999
16-0.282309-2.39550.009601
17-0.354387-3.00710.001815
18-0.256961-2.18040.016249
19-0.290035-2.4610.008126
20-0.268044-2.27440.012961
21-0.003026-0.02570.489792
220.0927180.78670.217009
230.2399632.03610.022707
240.4415073.74630.000179
250.3022432.56460.006207
260.1103980.93680.176008
270.0421410.35760.360853
28-0.132994-1.12850.131429
29-0.354379-3.0070.001816
30-0.206673-1.75370.041871
31-0.251018-2.130.018297
32-0.25263-2.14360.01772
33-0.039547-0.33560.369088
340.0928530.78790.216675
350.1174210.99630.161209
360.34052.88920.002549
370.3466392.94130.002196
380.0705470.59860.275655
390.0321650.27290.392844
40-0.091983-0.78050.218828
41-0.240412-2.040.022512
42-0.211526-1.79490.038437
43-0.158531-1.34520.091395
44-0.198047-1.68050.048598
45-0.043883-0.37240.355361
460.0450690.38240.351637
470.0840380.71310.239049
480.2160041.83290.035479


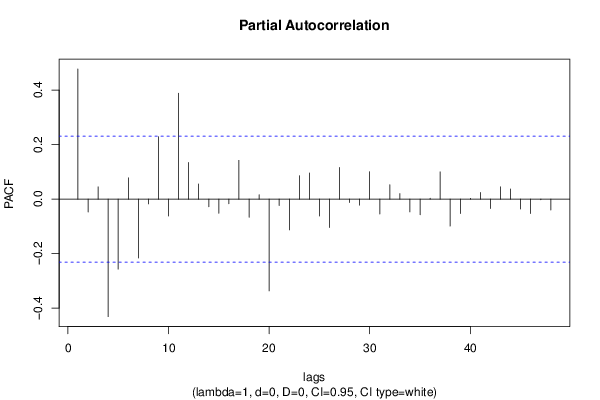
Partial Autocorrelation Function
Time lag kPACF(k)T-STATP-value
10.4777454.05386.3e-05
2-0.047361-0.40190.344486
30.0450030.38190.351842
4-0.431422-3.66070.000238
5-0.257135-2.18190.016192
60.0779990.66180.255092
7-0.215942-1.83230.035519
8-0.01767-0.14990.440617
90.2288381.94180.02804
10-0.062039-0.52640.300108
110.38863.29740.000759
120.1342511.13920.129207
130.0557240.47280.318881
14-0.028199-0.23930.405785
15-0.052012-0.44130.330147
16-0.017235-0.14620.44207
170.1421281.2060.115884
18-0.066731-0.56620.286499
190.016130.13690.445759
20-0.336958-2.85920.002776
21-0.023532-0.19970.421149
22-0.112852-0.95760.17074
230.0856390.72670.234891
240.0961180.81560.208712
25-0.061868-0.5250.300611
26-0.104359-0.88550.189413
270.1162680.98660.163579
28-0.012641-0.10730.457438
29-0.022076-0.18730.425968
300.1001850.85010.199044
31-0.054905-0.46590.321351
320.0527890.44790.327773
330.0201050.17060.432509
34-0.046906-0.3980.3459
35-0.05746-0.48760.313669
360.0030770.02610.489622
370.1000790.84920.199292
38-0.099069-0.84060.201669
39-0.052918-0.4490.327381
400.0027850.02360.490605
410.0243790.20690.418352
42-0.034323-0.29120.385852
430.0449710.38160.351943
440.0371390.31510.376786
45-0.036276-0.30780.379557
46-0.05297-0.44950.327223
47-0.002278-0.01930.492315
48-0.040266-0.34170.366797

\begin{tabular}{lllllllll}
\hline
Partial Autocorrelation Function \tabularnewline
Time lag k & PACF(k) & T-STAT & P-value \tabularnewline
1 & 0.477745 & 4.0538 & 6.3e-05 \tabularnewline
2 & -0.047361 & -0.4019 & 0.344486 \tabularnewline
3 & 0.045003 & 0.3819 & 0.351842 \tabularnewline
4 & -0.431422 & -3.6607 & 0.000238 \tabularnewline
5 & -0.257135 & -2.1819 & 0.016192 \tabularnewline
6 & 0.077999 & 0.6618 & 0.255092 \tabularnewline
7 & -0.215942 & -1.8323 & 0.035519 \tabularnewline
8 & -0.01767 & -0.1499 & 0.440617 \tabularnewline
9 & 0.228838 & 1.9418 & 0.02804 \tabularnewline
10 & -0.062039 & -0.5264 & 0.300108 \tabularnewline
11 & 0.3886 & 3.2974 & 0.000759 \tabularnewline
12 & 0.134251 & 1.1392 & 0.129207 \tabularnewline
13 & 0.055724 & 0.4728 & 0.318881 \tabularnewline
14 & -0.028199 & -0.2393 & 0.405785 \tabularnewline
15 & -0.052012 & -0.4413 & 0.330147 \tabularnewline
16 & -0.017235 & -0.1462 & 0.44207 \tabularnewline
17 & 0.142128 & 1.206 & 0.115884 \tabularnewline
18 & -0.066731 & -0.5662 & 0.286499 \tabularnewline
19 & 0.01613 & 0.1369 & 0.445759 \tabularnewline
20 & -0.336958 & -2.8592 & 0.002776 \tabularnewline
21 & -0.023532 & -0.1997 & 0.421149 \tabularnewline
22 & -0.112852 & -0.9576 & 0.17074 \tabularnewline
23 & 0.085639 & 0.7267 & 0.234891 \tabularnewline
24 & 0.096118 & 0.8156 & 0.208712 \tabularnewline
25 & -0.061868 & -0.525 & 0.300611 \tabularnewline
26 & -0.104359 & -0.8855 & 0.189413 \tabularnewline
27 & 0.116268 & 0.9866 & 0.163579 \tabularnewline
28 & -0.012641 & -0.1073 & 0.457438 \tabularnewline
29 & -0.022076 & -0.1873 & 0.425968 \tabularnewline
30 & 0.100185 & 0.8501 & 0.199044 \tabularnewline
31 & -0.054905 & -0.4659 & 0.321351 \tabularnewline
32 & 0.052789 & 0.4479 & 0.327773 \tabularnewline
33 & 0.020105 & 0.1706 & 0.432509 \tabularnewline
34 & -0.046906 & -0.398 & 0.3459 \tabularnewline
35 & -0.05746 & -0.4876 & 0.313669 \tabularnewline
36 & 0.003077 & 0.0261 & 0.489622 \tabularnewline
37 & 0.100079 & 0.8492 & 0.199292 \tabularnewline
38 & -0.099069 & -0.8406 & 0.201669 \tabularnewline
39 & -0.052918 & -0.449 & 0.327381 \tabularnewline
40 & 0.002785 & 0.0236 & 0.490605 \tabularnewline
41 & 0.024379 & 0.2069 & 0.418352 \tabularnewline
42 & -0.034323 & -0.2912 & 0.385852 \tabularnewline
43 & 0.044971 & 0.3816 & 0.351943 \tabularnewline
44 & 0.037139 & 0.3151 & 0.376786 \tabularnewline
45 & -0.036276 & -0.3078 & 0.379557 \tabularnewline
46 & -0.05297 & -0.4495 & 0.327223 \tabularnewline
47 & -0.002278 & -0.0193 & 0.492315 \tabularnewline
48 & -0.040266 & -0.3417 & 0.366797 \tabularnewline
\hline
\end{tabular}
%Source: https://freestatistics.org/blog/index.php?pk=&T=2

[TABLE]
[ROW][C]Partial Autocorrelation Function[/C][/ROW]
[ROW][C]Time lag k[/C][C]PACF(k)[/C][C]T-STAT[/C][C]P-value[/C][/ROW]
[ROW][C]1[/C][C]0.477745[/C][C]4.0538[/C][C]6.3e-05[/C][/ROW]
[ROW][C]2[/C][C]-0.047361[/C][C]-0.4019[/C][C]0.344486[/C][/ROW]
[ROW][C]3[/C][C]0.045003[/C][C]0.3819[/C][C]0.351842[/C][/ROW]
[ROW][C]4[/C][C]-0.431422[/C][C]-3.6607[/C][C]0.000238[/C][/ROW]
[ROW][C]5[/C][C]-0.257135[/C][C]-2.1819[/C][C]0.016192[/C][/ROW]
[ROW][C]6[/C][C]0.077999[/C][C]0.6618[/C][C]0.255092[/C][/ROW]
[ROW][C]7[/C][C]-0.215942[/C][C]-1.8323[/C][C]0.035519[/C][/ROW]
[ROW][C]8[/C][C]-0.01767[/C][C]-0.1499[/C][C]0.440617[/C][/ROW]
[ROW][C]9[/C][C]0.228838[/C][C]1.9418[/C][C]0.02804[/C][/ROW]
[ROW][C]10[/C][C]-0.062039[/C][C]-0.5264[/C][C]0.300108[/C][/ROW]
[ROW][C]11[/C][C]0.3886[/C][C]3.2974[/C][C]0.000759[/C][/ROW]
[ROW][C]12[/C][C]0.134251[/C][C]1.1392[/C][C]0.129207[/C][/ROW]
[ROW][C]13[/C][C]0.055724[/C][C]0.4728[/C][C]0.318881[/C][/ROW]
[ROW][C]14[/C][C]-0.028199[/C][C]-0.2393[/C][C]0.405785[/C][/ROW]
[ROW][C]15[/C][C]-0.052012[/C][C]-0.4413[/C][C]0.330147[/C][/ROW]
[ROW][C]16[/C][C]-0.017235[/C][C]-0.1462[/C][C]0.44207[/C][/ROW]
[ROW][C]17[/C][C]0.142128[/C][C]1.206[/C][C]0.115884[/C][/ROW]
[ROW][C]18[/C][C]-0.066731[/C][C]-0.5662[/C][C]0.286499[/C][/ROW]
[ROW][C]19[/C][C]0.01613[/C][C]0.1369[/C][C]0.445759[/C][/ROW]
[ROW][C]20[/C][C]-0.336958[/C][C]-2.8592[/C][C]0.002776[/C][/ROW]
[ROW][C]21[/C][C]-0.023532[/C][C]-0.1997[/C][C]0.421149[/C][/ROW]
[ROW][C]22[/C][C]-0.112852[/C][C]-0.9576[/C][C]0.17074[/C][/ROW]
[ROW][C]23[/C][C]0.085639[/C][C]0.7267[/C][C]0.234891[/C][/ROW]
[ROW][C]24[/C][C]0.096118[/C][C]0.8156[/C][C]0.208712[/C][/ROW]
[ROW][C]25[/C][C]-0.061868[/C][C]-0.525[/C][C]0.300611[/C][/ROW]
[ROW][C]26[/C][C]-0.104359[/C][C]-0.8855[/C][C]0.189413[/C][/ROW]
[ROW][C]27[/C][C]0.116268[/C][C]0.9866[/C][C]0.163579[/C][/ROW]
[ROW][C]28[/C][C]-0.012641[/C][C]-0.1073[/C][C]0.457438[/C][/ROW]
[ROW][C]29[/C][C]-0.022076[/C][C]-0.1873[/C][C]0.425968[/C][/ROW]
[ROW][C]30[/C][C]0.100185[/C][C]0.8501[/C][C]0.199044[/C][/ROW]
[ROW][C]31[/C][C]-0.054905[/C][C]-0.4659[/C][C]0.321351[/C][/ROW]
[ROW][C]32[/C][C]0.052789[/C][C]0.4479[/C][C]0.327773[/C][/ROW]
[ROW][C]33[/C][C]0.020105[/C][C]0.1706[/C][C]0.432509[/C][/ROW]
[ROW][C]34[/C][C]-0.046906[/C][C]-0.398[/C][C]0.3459[/C][/ROW]
[ROW][C]35[/C][C]-0.05746[/C][C]-0.4876[/C][C]0.313669[/C][/ROW]
[ROW][C]36[/C][C]0.003077[/C][C]0.0261[/C][C]0.489622[/C][/ROW]
[ROW][C]37[/C][C]0.100079[/C][C]0.8492[/C][C]0.199292[/C][/ROW]
[ROW][C]38[/C][C]-0.099069[/C][C]-0.8406[/C][C]0.201669[/C][/ROW]
[ROW][C]39[/C][C]-0.052918[/C][C]-0.449[/C][C]0.327381[/C][/ROW]
[ROW][C]40[/C][C]0.002785[/C][C]0.0236[/C][C]0.490605[/C][/ROW]
[ROW][C]41[/C][C]0.024379[/C][C]0.2069[/C][C]0.418352[/C][/ROW]
[ROW][C]42[/C][C]-0.034323[/C][C]-0.2912[/C][C]0.385852[/C][/ROW]
[ROW][C]43[/C][C]0.044971[/C][C]0.3816[/C][C]0.351943[/C][/ROW]
[ROW][C]44[/C][C]0.037139[/C][C]0.3151[/C][C]0.376786[/C][/ROW]
[ROW][C]45[/C][C]-0.036276[/C][C]-0.3078[/C][C]0.379557[/C][/ROW]
[ROW][C]46[/C][C]-0.05297[/C][C]-0.4495[/C][C]0.327223[/C][/ROW]
[ROW][C]47[/C][C]-0.002278[/C][C]-0.0193[/C][C]0.492315[/C][/ROW]
[ROW][C]48[/C][C]-0.040266[/C][C]-0.3417[/C][C]0.366797[/C][/ROW]
[/TABLE]
Source: https://freestatistics.org/blog/index.php?pk=&T=2

Globally Unique Identifier (entire table): ba.freestatistics.org/blog/index.php?pk=&T=2

As an alternative you can also use a QR Code:  

The GUIDs for individual cells are displayed in the table below:

Partial Autocorrelation Function
Time lag kPACF(k)T-STATP-value
10.4777454.05386.3e-05
2-0.047361-0.40190.344486
30.0450030.38190.351842
4-0.431422-3.66070.000238
5-0.257135-2.18190.016192
60.0779990.66180.255092
7-0.215942-1.83230.035519
8-0.01767-0.14990.440617
90.2288381.94180.02804
10-0.062039-0.52640.300108
110.38863.29740.000759
120.1342511.13920.129207
130.0557240.47280.318881
14-0.028199-0.23930.405785
15-0.052012-0.44130.330147
16-0.017235-0.14620.44207
170.1421281.2060.115884
18-0.066731-0.56620.286499
190.016130.13690.445759
20-0.336958-2.85920.002776
21-0.023532-0.19970.421149
22-0.112852-0.95760.17074
230.0856390.72670.234891
240.0961180.81560.208712
25-0.061868-0.5250.300611
26-0.104359-0.88550.189413
270.1162680.98660.163579
28-0.012641-0.10730.457438
29-0.022076-0.18730.425968
300.1001850.85010.199044
31-0.054905-0.46590.321351
320.0527890.44790.327773
330.0201050.17060.432509
34-0.046906-0.3980.3459
35-0.05746-0.48760.313669
360.0030770.02610.489622
370.1000790.84920.199292
38-0.099069-0.84060.201669
39-0.052918-0.4490.327381
400.0027850.02360.490605
410.0243790.20690.418352
42-0.034323-0.29120.385852
430.0449710.38160.351943
440.0371390.31510.376786
45-0.036276-0.30780.379557
46-0.05297-0.44950.327223
47-0.002278-0.01930.492315
48-0.040266-0.34170.366797


Parameters (Session):
par1 = 48 ; par2 = 1 ; par3 = 0 ; par4 = 0 ; par5 = 12 ; par6 = White Noise ; par7 = 0.95 ;
Parameters (R input):
par1 = 48 ; par2 = 1 ; par3 = 0 ; par4 = 0 ; par5 = 12 ; par6 = White Noise ; par7 = 0.95 ; par8 = ;
R code (references can be found in the software module):
if (par1 == 'Default') {
par1 = 10*log10(length(x))
} else {
par1 <- as.numeric(par1)
}
par2 <- as.numeric(par2)
par3 <- as.numeric(par3)
par4 <- as.numeric(par4)
par5 <- as.numeric(par5)
if (par6 == 'White Noise') par6 <- 'white' else par6 <- 'ma'
par7 <- as.numeric(par7)
if (par8 != '') par8 <- as.numeric(par8)
x <- na.omit(x)
ox <- x
if (par8 == '') {
if (par2 == 0) {
x <- log(x)
} else {
x <- (x ^ par2 - 1) / par2
}
} else {
x <- log(x,base=par8)
}
if (par3 > 0) x <- diff(x,lag=1,difference=par3)
if (par4 > 0) x <- diff(x,lag=par5,difference=par4)
bitmap(file='picts.png')
op <- par(mfrow=c(2,1))
plot(ox,type='l',main='Original Time Series',xlab='time',ylab='value')
if (par8=='') {
mytitle <- paste('Working Time Series (lambda=',par2,', d=',par3,', D=',par4,')',sep='')
mysub <- paste('(lambda=',par2,', d=',par3,', D=',par4,', CI=', par7, ', CI type=',par6,')',sep='')
} else {
mytitle <- paste('Working Time Series (base=',par8,', d=',par3,', D=',par4,')',sep='')
mysub <- paste('(base=',par8,', d=',par3,', D=',par4,', CI=', par7, ', CI type=',par6,')',sep='')
}
plot(x,type='l', main=mytitle,xlab='time',ylab='value')
par(op)
dev.off()
bitmap(file='pic1.png')
racf <- acf(x, par1, main='Autocorrelation', xlab='time lag', ylab='ACF', ci.type=par6, ci=par7, sub=mysub)
dev.off()
bitmap(file='pic2.png')
rpacf <- pacf(x,par1,main='Partial Autocorrelation',xlab='lags',ylab='PACF',sub=mysub)
dev.off()
(myacf <- c(racf$acf))
(mypacf <- c(rpacf$acf))
lengthx <- length(x)
sqrtn <- sqrt(lengthx)
load(file='createtable')
a<-table.start()
a<-table.row.start(a)
a<-table.element(a,'Autocorrelation Function',4,TRUE)
a<-table.row.end(a)
a<-table.row.start(a)
a<-table.element(a,'Time lag k',header=TRUE)
a<-table.element(a,hyperlink('basics.htm','ACF(k)','click here for more information about the Autocorrelation Function'),header=TRUE)
a<-table.element(a,'T-STAT',header=TRUE)
a<-table.element(a,'P-value',header=TRUE)
a<-table.row.end(a)
for (i in 2:(par1+1)) {
a<-table.row.start(a)
a<-table.element(a,i-1,header=TRUE)
a<-table.element(a,round(myacf[i],6))
mytstat <- myacf[i]*sqrtn
a<-table.element(a,round(mytstat,4))
a<-table.element(a,round(1-pt(abs(mytstat),lengthx),6))
a<-table.row.end(a)
}
a<-table.end(a)
table.save(a,file='mytable.tab')
a<-table.start()
a<-table.row.start(a)
a<-table.element(a,'Partial Autocorrelation Function',4,TRUE)
a<-table.row.end(a)
a<-table.row.start(a)
a<-table.element(a,'Time lag k',header=TRUE)
a<-table.element(a,hyperlink('basics.htm','PACF(k)','click here for more information about the Partial Autocorrelation Function'),header=TRUE)
a<-table.element(a,'T-STAT',header=TRUE)
a<-table.element(a,'P-value',header=TRUE)
a<-table.row.end(a)
for (i in 1:par1) {
a<-table.row.start(a)
a<-table.element(a,i,header=TRUE)
a<-table.element(a,round(mypacf[i],6))
mytstat <- mypacf[i]*sqrtn
a<-table.element(a,round(mytstat,4))
a<-table.element(a,round(1-pt(abs(mytstat),lengthx),6))
a<-table.row.end(a)
}
a<-table.end(a)
table.save(a,file='mytable1.tab')