Free Statistics

of Irreproducible Research!

Author's title

Author*Unverified author*
R Software Modulerwasp_autocorrelation.wasp
Title produced by software(Partial) Autocorrelation Function
Date of computationFri, 17 Mar 2017 09:08:50 +0000
Cite this page as followsStatistical Computations at FreeStatistics.org, Office for Research Development and Education, URL https://freestatistics.org/blog/index.php?v=date/2017/Mar/17/t1489741847tjr1wypkdb98omr.htm/, Retrieved Tue, 14 May 2024 14:03:44 +0200
Statistical Computations at FreeStatistics.org, Office for Research Development and Education, URL https://freestatistics.org/blog/index.php?pk=, Retrieved Tue, 14 May 2024 14:03:44 +0200
QR Codes:

Original text written by user:
IsPrivate?No (this computation is public)
User-defined keywords
Estimated Impact0
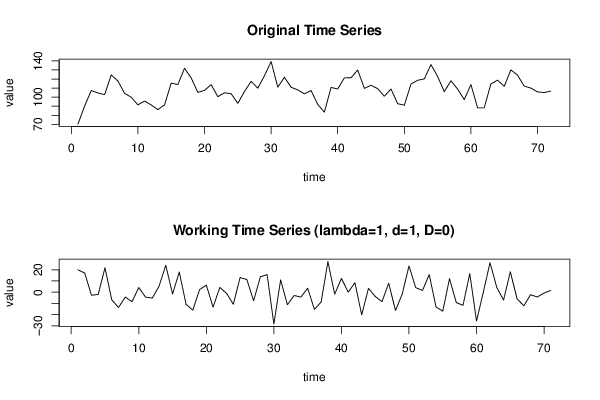
Dataseries X:
70.3
90.2
107.3
104.6
102.7
124.5
117.8
104.2
99.9
91.5
95.7
91.4
86.2
91.5
115.5
113.9
131.9
121.2
105.2
107.5
113.8
100.5
104.8
103.8
93.1
106.2
117.5
109.9
123.6
139.3
111
122
110.9
108
103.7
107.3
92
83.4
110.7
109
121.3
121.4
129.9
109.7
113.1
109.4
101
109
92.8
91.1
114.5
118.6
120.2
135.9
122.8
106
118.1
108.9
97.3
113.9
88.3
88.3
114.6
118.8
111.9
130.1
124.3
112.2
110
105.8
105.1
106.7


Summary of computational transaction
Raw Inputview raw input (R code)
Raw Outputview raw output of R engine
Computing time1 seconds
R Server'Sir Ronald Aylmer Fisher' @ fisher.wessa.net

\begin{tabular}{lllllllll}
\hline
Summary of computational transaction \tabularnewline
Raw Input & view raw input (R code)  \tabularnewline
Raw Output & view raw output of R engine  \tabularnewline
Computing time & 1 seconds \tabularnewline
R Server & 'Sir Ronald Aylmer Fisher' @ fisher.wessa.net \tabularnewline
\hline
\end{tabular}
%Source: https://freestatistics.org/blog/index.php?pk=&T=0

[TABLE]
[ROW][C]Summary of computational transaction[/C][/ROW]
[ROW][C]Raw Input[/C][C]view raw input (R code) [/C][/ROW]
[ROW][C]Raw Output[/C][C]view raw output of R engine [/C][/ROW]
[ROW][C]Computing time[/C][C]1 seconds[/C][/ROW]
[ROW][C]R Server[/C][C]'Sir Ronald Aylmer Fisher' @ fisher.wessa.net[/C][/ROW]
[/TABLE]
Source: https://freestatistics.org/blog/index.php?pk=&T=0

Globally Unique Identifier (entire table): ba.freestatistics.org/blog/index.php?pk=&T=0

As an alternative you can also use a QR Code:  

The GUIDs for individual cells are displayed in the table below:

Summary of computational transaction
Raw Inputview raw input (R code)
Raw Outputview raw output of R engine
Computing time1 seconds
R Server'Sir Ronald Aylmer Fisher' @ fisher.wessa.net


Autocorrelation Function
Time lag kACF(k)T-STATP-value
1-0.188597-1.58910.058235
2-0.160368-1.35130.090448
30.3096582.60920.005529
4-0.20037-1.68830.047866
5-0.329405-2.77560.003519
60.2364621.99250.025083
7-0.228148-1.92240.029283
8-0.35672-3.00580.00183
90.3794233.19710.001037
10-0.167133-1.40830.081705
110.0010150.00860.4966
120.4115953.46820.000447
130.0747150.62960.265502
14-0.102412-0.86290.195539
150.2305021.94220.028038
16-0.193118-1.62720.054058
17-0.218831-1.84390.034685
180.086650.73010.233858
19-0.055491-0.46760.32076
20-0.243088-2.04830.022115
210.1359531.14560.127911
22-0.044818-0.37760.35341
23-0.062189-0.5240.300949
240.3344662.81830.003125
250.1007860.84920.199302
26-0.093941-0.79160.215626
270.0895820.75480.226424
280.0970840.8180.208035
29-0.343385-2.89340.002529
300.1079720.90980.183006
31-0.009042-0.07620.469741
32-0.274324-2.31150.011856
330.0769560.64840.259395
340.0978190.82420.206284
35-0.201822-1.70060.046699
360.1836041.54710.063146
370.2743162.31140.011858
38-0.163696-1.37930.086061
390.0867250.73080.233667
400.0698230.58830.279087
41-0.194548-1.63930.052789
420.0065150.05490.478186
430.0262470.22120.412801
44-0.20175-1.70.046757
450.0578280.48730.313785
460.0219820.18520.426789
47-0.075855-0.63920.262385
480.130291.09780.13799

\begin{tabular}{lllllllll}
\hline
Autocorrelation Function \tabularnewline
Time lag k & ACF(k) & T-STAT & P-value \tabularnewline
1 & -0.188597 & -1.5891 & 0.058235 \tabularnewline
2 & -0.160368 & -1.3513 & 0.090448 \tabularnewline
3 & 0.309658 & 2.6092 & 0.005529 \tabularnewline
4 & -0.20037 & -1.6883 & 0.047866 \tabularnewline
5 & -0.329405 & -2.7756 & 0.003519 \tabularnewline
6 & 0.236462 & 1.9925 & 0.025083 \tabularnewline
7 & -0.228148 & -1.9224 & 0.029283 \tabularnewline
8 & -0.35672 & -3.0058 & 0.00183 \tabularnewline
9 & 0.379423 & 3.1971 & 0.001037 \tabularnewline
10 & -0.167133 & -1.4083 & 0.081705 \tabularnewline
11 & 0.001015 & 0.0086 & 0.4966 \tabularnewline
12 & 0.411595 & 3.4682 & 0.000447 \tabularnewline
13 & 0.074715 & 0.6296 & 0.265502 \tabularnewline
14 & -0.102412 & -0.8629 & 0.195539 \tabularnewline
15 & 0.230502 & 1.9422 & 0.028038 \tabularnewline
16 & -0.193118 & -1.6272 & 0.054058 \tabularnewline
17 & -0.218831 & -1.8439 & 0.034685 \tabularnewline
18 & 0.08665 & 0.7301 & 0.233858 \tabularnewline
19 & -0.055491 & -0.4676 & 0.32076 \tabularnewline
20 & -0.243088 & -2.0483 & 0.022115 \tabularnewline
21 & 0.135953 & 1.1456 & 0.127911 \tabularnewline
22 & -0.044818 & -0.3776 & 0.35341 \tabularnewline
23 & -0.062189 & -0.524 & 0.300949 \tabularnewline
24 & 0.334466 & 2.8183 & 0.003125 \tabularnewline
25 & 0.100786 & 0.8492 & 0.199302 \tabularnewline
26 & -0.093941 & -0.7916 & 0.215626 \tabularnewline
27 & 0.089582 & 0.7548 & 0.226424 \tabularnewline
28 & 0.097084 & 0.818 & 0.208035 \tabularnewline
29 & -0.343385 & -2.8934 & 0.002529 \tabularnewline
30 & 0.107972 & 0.9098 & 0.183006 \tabularnewline
31 & -0.009042 & -0.0762 & 0.469741 \tabularnewline
32 & -0.274324 & -2.3115 & 0.011856 \tabularnewline
33 & 0.076956 & 0.6484 & 0.259395 \tabularnewline
34 & 0.097819 & 0.8242 & 0.206284 \tabularnewline
35 & -0.201822 & -1.7006 & 0.046699 \tabularnewline
36 & 0.183604 & 1.5471 & 0.063146 \tabularnewline
37 & 0.274316 & 2.3114 & 0.011858 \tabularnewline
38 & -0.163696 & -1.3793 & 0.086061 \tabularnewline
39 & 0.086725 & 0.7308 & 0.233667 \tabularnewline
40 & 0.069823 & 0.5883 & 0.279087 \tabularnewline
41 & -0.194548 & -1.6393 & 0.052789 \tabularnewline
42 & 0.006515 & 0.0549 & 0.478186 \tabularnewline
43 & 0.026247 & 0.2212 & 0.412801 \tabularnewline
44 & -0.20175 & -1.7 & 0.046757 \tabularnewline
45 & 0.057828 & 0.4873 & 0.313785 \tabularnewline
46 & 0.021982 & 0.1852 & 0.426789 \tabularnewline
47 & -0.075855 & -0.6392 & 0.262385 \tabularnewline
48 & 0.13029 & 1.0978 & 0.13799 \tabularnewline
\hline
\end{tabular}
%Source: https://freestatistics.org/blog/index.php?pk=&T=1

[TABLE]
[ROW][C]Autocorrelation Function[/C][/ROW]
[ROW][C]Time lag k[/C][C]ACF(k)[/C][C]T-STAT[/C][C]P-value[/C][/ROW]
[ROW][C]1[/C][C]-0.188597[/C][C]-1.5891[/C][C]0.058235[/C][/ROW]
[ROW][C]2[/C][C]-0.160368[/C][C]-1.3513[/C][C]0.090448[/C][/ROW]
[ROW][C]3[/C][C]0.309658[/C][C]2.6092[/C][C]0.005529[/C][/ROW]
[ROW][C]4[/C][C]-0.20037[/C][C]-1.6883[/C][C]0.047866[/C][/ROW]
[ROW][C]5[/C][C]-0.329405[/C][C]-2.7756[/C][C]0.003519[/C][/ROW]
[ROW][C]6[/C][C]0.236462[/C][C]1.9925[/C][C]0.025083[/C][/ROW]
[ROW][C]7[/C][C]-0.228148[/C][C]-1.9224[/C][C]0.029283[/C][/ROW]
[ROW][C]8[/C][C]-0.35672[/C][C]-3.0058[/C][C]0.00183[/C][/ROW]
[ROW][C]9[/C][C]0.379423[/C][C]3.1971[/C][C]0.001037[/C][/ROW]
[ROW][C]10[/C][C]-0.167133[/C][C]-1.4083[/C][C]0.081705[/C][/ROW]
[ROW][C]11[/C][C]0.001015[/C][C]0.0086[/C][C]0.4966[/C][/ROW]
[ROW][C]12[/C][C]0.411595[/C][C]3.4682[/C][C]0.000447[/C][/ROW]
[ROW][C]13[/C][C]0.074715[/C][C]0.6296[/C][C]0.265502[/C][/ROW]
[ROW][C]14[/C][C]-0.102412[/C][C]-0.8629[/C][C]0.195539[/C][/ROW]
[ROW][C]15[/C][C]0.230502[/C][C]1.9422[/C][C]0.028038[/C][/ROW]
[ROW][C]16[/C][C]-0.193118[/C][C]-1.6272[/C][C]0.054058[/C][/ROW]
[ROW][C]17[/C][C]-0.218831[/C][C]-1.8439[/C][C]0.034685[/C][/ROW]
[ROW][C]18[/C][C]0.08665[/C][C]0.7301[/C][C]0.233858[/C][/ROW]
[ROW][C]19[/C][C]-0.055491[/C][C]-0.4676[/C][C]0.32076[/C][/ROW]
[ROW][C]20[/C][C]-0.243088[/C][C]-2.0483[/C][C]0.022115[/C][/ROW]
[ROW][C]21[/C][C]0.135953[/C][C]1.1456[/C][C]0.127911[/C][/ROW]
[ROW][C]22[/C][C]-0.044818[/C][C]-0.3776[/C][C]0.35341[/C][/ROW]
[ROW][C]23[/C][C]-0.062189[/C][C]-0.524[/C][C]0.300949[/C][/ROW]
[ROW][C]24[/C][C]0.334466[/C][C]2.8183[/C][C]0.003125[/C][/ROW]
[ROW][C]25[/C][C]0.100786[/C][C]0.8492[/C][C]0.199302[/C][/ROW]
[ROW][C]26[/C][C]-0.093941[/C][C]-0.7916[/C][C]0.215626[/C][/ROW]
[ROW][C]27[/C][C]0.089582[/C][C]0.7548[/C][C]0.226424[/C][/ROW]
[ROW][C]28[/C][C]0.097084[/C][C]0.818[/C][C]0.208035[/C][/ROW]
[ROW][C]29[/C][C]-0.343385[/C][C]-2.8934[/C][C]0.002529[/C][/ROW]
[ROW][C]30[/C][C]0.107972[/C][C]0.9098[/C][C]0.183006[/C][/ROW]
[ROW][C]31[/C][C]-0.009042[/C][C]-0.0762[/C][C]0.469741[/C][/ROW]
[ROW][C]32[/C][C]-0.274324[/C][C]-2.3115[/C][C]0.011856[/C][/ROW]
[ROW][C]33[/C][C]0.076956[/C][C]0.6484[/C][C]0.259395[/C][/ROW]
[ROW][C]34[/C][C]0.097819[/C][C]0.8242[/C][C]0.206284[/C][/ROW]
[ROW][C]35[/C][C]-0.201822[/C][C]-1.7006[/C][C]0.046699[/C][/ROW]
[ROW][C]36[/C][C]0.183604[/C][C]1.5471[/C][C]0.063146[/C][/ROW]
[ROW][C]37[/C][C]0.274316[/C][C]2.3114[/C][C]0.011858[/C][/ROW]
[ROW][C]38[/C][C]-0.163696[/C][C]-1.3793[/C][C]0.086061[/C][/ROW]
[ROW][C]39[/C][C]0.086725[/C][C]0.7308[/C][C]0.233667[/C][/ROW]
[ROW][C]40[/C][C]0.069823[/C][C]0.5883[/C][C]0.279087[/C][/ROW]
[ROW][C]41[/C][C]-0.194548[/C][C]-1.6393[/C][C]0.052789[/C][/ROW]
[ROW][C]42[/C][C]0.006515[/C][C]0.0549[/C][C]0.478186[/C][/ROW]
[ROW][C]43[/C][C]0.026247[/C][C]0.2212[/C][C]0.412801[/C][/ROW]
[ROW][C]44[/C][C]-0.20175[/C][C]-1.7[/C][C]0.046757[/C][/ROW]
[ROW][C]45[/C][C]0.057828[/C][C]0.4873[/C][C]0.313785[/C][/ROW]
[ROW][C]46[/C][C]0.021982[/C][C]0.1852[/C][C]0.426789[/C][/ROW]
[ROW][C]47[/C][C]-0.075855[/C][C]-0.6392[/C][C]0.262385[/C][/ROW]
[ROW][C]48[/C][C]0.13029[/C][C]1.0978[/C][C]0.13799[/C][/ROW]
[/TABLE]
Source: https://freestatistics.org/blog/index.php?pk=&T=1

Globally Unique Identifier (entire table): ba.freestatistics.org/blog/index.php?pk=&T=1

As an alternative you can also use a QR Code:  

The GUIDs for individual cells are displayed in the table below:

Autocorrelation Function
Time lag kACF(k)T-STATP-value
1-0.188597-1.58910.058235
2-0.160368-1.35130.090448
30.3096582.60920.005529
4-0.20037-1.68830.047866
5-0.329405-2.77560.003519
60.2364621.99250.025083
7-0.228148-1.92240.029283
8-0.35672-3.00580.00183
90.3794233.19710.001037
10-0.167133-1.40830.081705
110.0010150.00860.4966
120.4115953.46820.000447
130.0747150.62960.265502
14-0.102412-0.86290.195539
150.2305021.94220.028038
16-0.193118-1.62720.054058
17-0.218831-1.84390.034685
180.086650.73010.233858
19-0.055491-0.46760.32076
20-0.243088-2.04830.022115
210.1359531.14560.127911
22-0.044818-0.37760.35341
23-0.062189-0.5240.300949
240.3344662.81830.003125
250.1007860.84920.199302
26-0.093941-0.79160.215626
270.0895820.75480.226424
280.0970840.8180.208035
29-0.343385-2.89340.002529
300.1079720.90980.183006
31-0.009042-0.07620.469741
32-0.274324-2.31150.011856
330.0769560.64840.259395
340.0978190.82420.206284
35-0.201822-1.70060.046699
360.1836041.54710.063146
370.2743162.31140.011858
38-0.163696-1.37930.086061
390.0867250.73080.233667
400.0698230.58830.279087
41-0.194548-1.63930.052789
420.0065150.05490.478186
430.0262470.22120.412801
44-0.20175-1.70.046757
450.0578280.48730.313785
460.0219820.18520.426789
47-0.075855-0.63920.262385
480.130291.09780.13799


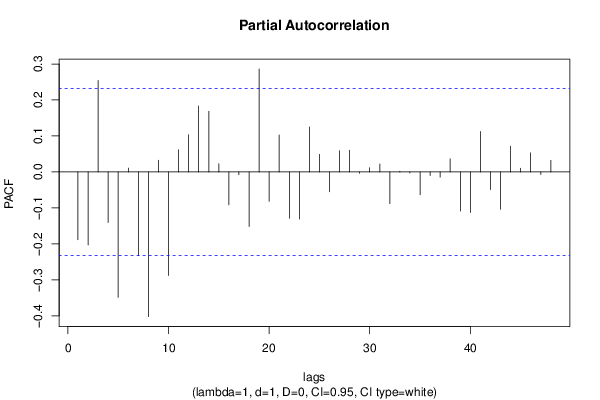
Partial Autocorrelation Function
Time lag kPACF(k)T-STATP-value
1-0.188597-1.58910.058235
2-0.203163-1.71190.045642
30.2541062.14110.017849
4-0.140476-1.18370.120245
5-0.348741-2.93850.002223
60.0105820.08920.464602
7-0.232813-1.96170.026858
8-0.4024-3.39070.000571
90.0323310.27240.393044
10-0.287896-2.42590.008908
110.0618220.52090.302022
120.1033230.87060.19345
130.1835191.54640.063232
140.1686521.42110.079834
150.0228540.19260.423924
16-0.091548-0.77140.221515
17-0.007996-0.06740.473237
18-0.151648-1.27780.102739
190.2863222.41260.009212
20-0.081823-0.68940.246394
210.1027580.86590.194744
22-0.128948-1.08650.140459
23-0.130892-1.10290.136894
240.1250391.05360.147821
250.0488030.41120.341075
26-0.05515-0.46470.321784
270.0587050.49470.311183
280.060180.50710.306832
29-0.003915-0.0330.486888
300.0118410.09980.460401
310.0219520.1850.426889
32-0.08851-0.74580.229127
330.0016730.01410.494396
34-0.00315-0.02650.489451
35-0.063719-0.53690.296506
36-0.010135-0.08540.466091
37-0.014452-0.12180.451711
380.0364180.30690.379924
39-0.108637-0.91540.181543
40-0.11283-0.95070.172485
410.112460.94760.173272
42-0.048848-0.41160.340935
43-0.103999-0.87630.191907
440.0711960.59990.275238
450.01030.08680.465541
460.053070.44720.328053
47-0.007375-0.06210.475312
480.0321960.27130.393478

\begin{tabular}{lllllllll}
\hline
Partial Autocorrelation Function \tabularnewline
Time lag k & PACF(k) & T-STAT & P-value \tabularnewline
1 & -0.188597 & -1.5891 & 0.058235 \tabularnewline
2 & -0.203163 & -1.7119 & 0.045642 \tabularnewline
3 & 0.254106 & 2.1411 & 0.017849 \tabularnewline
4 & -0.140476 & -1.1837 & 0.120245 \tabularnewline
5 & -0.348741 & -2.9385 & 0.002223 \tabularnewline
6 & 0.010582 & 0.0892 & 0.464602 \tabularnewline
7 & -0.232813 & -1.9617 & 0.026858 \tabularnewline
8 & -0.4024 & -3.3907 & 0.000571 \tabularnewline
9 & 0.032331 & 0.2724 & 0.393044 \tabularnewline
10 & -0.287896 & -2.4259 & 0.008908 \tabularnewline
11 & 0.061822 & 0.5209 & 0.302022 \tabularnewline
12 & 0.103323 & 0.8706 & 0.19345 \tabularnewline
13 & 0.183519 & 1.5464 & 0.063232 \tabularnewline
14 & 0.168652 & 1.4211 & 0.079834 \tabularnewline
15 & 0.022854 & 0.1926 & 0.423924 \tabularnewline
16 & -0.091548 & -0.7714 & 0.221515 \tabularnewline
17 & -0.007996 & -0.0674 & 0.473237 \tabularnewline
18 & -0.151648 & -1.2778 & 0.102739 \tabularnewline
19 & 0.286322 & 2.4126 & 0.009212 \tabularnewline
20 & -0.081823 & -0.6894 & 0.246394 \tabularnewline
21 & 0.102758 & 0.8659 & 0.194744 \tabularnewline
22 & -0.128948 & -1.0865 & 0.140459 \tabularnewline
23 & -0.130892 & -1.1029 & 0.136894 \tabularnewline
24 & 0.125039 & 1.0536 & 0.147821 \tabularnewline
25 & 0.048803 & 0.4112 & 0.341075 \tabularnewline
26 & -0.05515 & -0.4647 & 0.321784 \tabularnewline
27 & 0.058705 & 0.4947 & 0.311183 \tabularnewline
28 & 0.06018 & 0.5071 & 0.306832 \tabularnewline
29 & -0.003915 & -0.033 & 0.486888 \tabularnewline
30 & 0.011841 & 0.0998 & 0.460401 \tabularnewline
31 & 0.021952 & 0.185 & 0.426889 \tabularnewline
32 & -0.08851 & -0.7458 & 0.229127 \tabularnewline
33 & 0.001673 & 0.0141 & 0.494396 \tabularnewline
34 & -0.00315 & -0.0265 & 0.489451 \tabularnewline
35 & -0.063719 & -0.5369 & 0.296506 \tabularnewline
36 & -0.010135 & -0.0854 & 0.466091 \tabularnewline
37 & -0.014452 & -0.1218 & 0.451711 \tabularnewline
38 & 0.036418 & 0.3069 & 0.379924 \tabularnewline
39 & -0.108637 & -0.9154 & 0.181543 \tabularnewline
40 & -0.11283 & -0.9507 & 0.172485 \tabularnewline
41 & 0.11246 & 0.9476 & 0.173272 \tabularnewline
42 & -0.048848 & -0.4116 & 0.340935 \tabularnewline
43 & -0.103999 & -0.8763 & 0.191907 \tabularnewline
44 & 0.071196 & 0.5999 & 0.275238 \tabularnewline
45 & 0.0103 & 0.0868 & 0.465541 \tabularnewline
46 & 0.05307 & 0.4472 & 0.328053 \tabularnewline
47 & -0.007375 & -0.0621 & 0.475312 \tabularnewline
48 & 0.032196 & 0.2713 & 0.393478 \tabularnewline
\hline
\end{tabular}
%Source: https://freestatistics.org/blog/index.php?pk=&T=2

[TABLE]
[ROW][C]Partial Autocorrelation Function[/C][/ROW]
[ROW][C]Time lag k[/C][C]PACF(k)[/C][C]T-STAT[/C][C]P-value[/C][/ROW]
[ROW][C]1[/C][C]-0.188597[/C][C]-1.5891[/C][C]0.058235[/C][/ROW]
[ROW][C]2[/C][C]-0.203163[/C][C]-1.7119[/C][C]0.045642[/C][/ROW]
[ROW][C]3[/C][C]0.254106[/C][C]2.1411[/C][C]0.017849[/C][/ROW]
[ROW][C]4[/C][C]-0.140476[/C][C]-1.1837[/C][C]0.120245[/C][/ROW]
[ROW][C]5[/C][C]-0.348741[/C][C]-2.9385[/C][C]0.002223[/C][/ROW]
[ROW][C]6[/C][C]0.010582[/C][C]0.0892[/C][C]0.464602[/C][/ROW]
[ROW][C]7[/C][C]-0.232813[/C][C]-1.9617[/C][C]0.026858[/C][/ROW]
[ROW][C]8[/C][C]-0.4024[/C][C]-3.3907[/C][C]0.000571[/C][/ROW]
[ROW][C]9[/C][C]0.032331[/C][C]0.2724[/C][C]0.393044[/C][/ROW]
[ROW][C]10[/C][C]-0.287896[/C][C]-2.4259[/C][C]0.008908[/C][/ROW]
[ROW][C]11[/C][C]0.061822[/C][C]0.5209[/C][C]0.302022[/C][/ROW]
[ROW][C]12[/C][C]0.103323[/C][C]0.8706[/C][C]0.19345[/C][/ROW]
[ROW][C]13[/C][C]0.183519[/C][C]1.5464[/C][C]0.063232[/C][/ROW]
[ROW][C]14[/C][C]0.168652[/C][C]1.4211[/C][C]0.079834[/C][/ROW]
[ROW][C]15[/C][C]0.022854[/C][C]0.1926[/C][C]0.423924[/C][/ROW]
[ROW][C]16[/C][C]-0.091548[/C][C]-0.7714[/C][C]0.221515[/C][/ROW]
[ROW][C]17[/C][C]-0.007996[/C][C]-0.0674[/C][C]0.473237[/C][/ROW]
[ROW][C]18[/C][C]-0.151648[/C][C]-1.2778[/C][C]0.102739[/C][/ROW]
[ROW][C]19[/C][C]0.286322[/C][C]2.4126[/C][C]0.009212[/C][/ROW]
[ROW][C]20[/C][C]-0.081823[/C][C]-0.6894[/C][C]0.246394[/C][/ROW]
[ROW][C]21[/C][C]0.102758[/C][C]0.8659[/C][C]0.194744[/C][/ROW]
[ROW][C]22[/C][C]-0.128948[/C][C]-1.0865[/C][C]0.140459[/C][/ROW]
[ROW][C]23[/C][C]-0.130892[/C][C]-1.1029[/C][C]0.136894[/C][/ROW]
[ROW][C]24[/C][C]0.125039[/C][C]1.0536[/C][C]0.147821[/C][/ROW]
[ROW][C]25[/C][C]0.048803[/C][C]0.4112[/C][C]0.341075[/C][/ROW]
[ROW][C]26[/C][C]-0.05515[/C][C]-0.4647[/C][C]0.321784[/C][/ROW]
[ROW][C]27[/C][C]0.058705[/C][C]0.4947[/C][C]0.311183[/C][/ROW]
[ROW][C]28[/C][C]0.06018[/C][C]0.5071[/C][C]0.306832[/C][/ROW]
[ROW][C]29[/C][C]-0.003915[/C][C]-0.033[/C][C]0.486888[/C][/ROW]
[ROW][C]30[/C][C]0.011841[/C][C]0.0998[/C][C]0.460401[/C][/ROW]
[ROW][C]31[/C][C]0.021952[/C][C]0.185[/C][C]0.426889[/C][/ROW]
[ROW][C]32[/C][C]-0.08851[/C][C]-0.7458[/C][C]0.229127[/C][/ROW]
[ROW][C]33[/C][C]0.001673[/C][C]0.0141[/C][C]0.494396[/C][/ROW]
[ROW][C]34[/C][C]-0.00315[/C][C]-0.0265[/C][C]0.489451[/C][/ROW]
[ROW][C]35[/C][C]-0.063719[/C][C]-0.5369[/C][C]0.296506[/C][/ROW]
[ROW][C]36[/C][C]-0.010135[/C][C]-0.0854[/C][C]0.466091[/C][/ROW]
[ROW][C]37[/C][C]-0.014452[/C][C]-0.1218[/C][C]0.451711[/C][/ROW]
[ROW][C]38[/C][C]0.036418[/C][C]0.3069[/C][C]0.379924[/C][/ROW]
[ROW][C]39[/C][C]-0.108637[/C][C]-0.9154[/C][C]0.181543[/C][/ROW]
[ROW][C]40[/C][C]-0.11283[/C][C]-0.9507[/C][C]0.172485[/C][/ROW]
[ROW][C]41[/C][C]0.11246[/C][C]0.9476[/C][C]0.173272[/C][/ROW]
[ROW][C]42[/C][C]-0.048848[/C][C]-0.4116[/C][C]0.340935[/C][/ROW]
[ROW][C]43[/C][C]-0.103999[/C][C]-0.8763[/C][C]0.191907[/C][/ROW]
[ROW][C]44[/C][C]0.071196[/C][C]0.5999[/C][C]0.275238[/C][/ROW]
[ROW][C]45[/C][C]0.0103[/C][C]0.0868[/C][C]0.465541[/C][/ROW]
[ROW][C]46[/C][C]0.05307[/C][C]0.4472[/C][C]0.328053[/C][/ROW]
[ROW][C]47[/C][C]-0.007375[/C][C]-0.0621[/C][C]0.475312[/C][/ROW]
[ROW][C]48[/C][C]0.032196[/C][C]0.2713[/C][C]0.393478[/C][/ROW]
[/TABLE]
Source: https://freestatistics.org/blog/index.php?pk=&T=2

Globally Unique Identifier (entire table): ba.freestatistics.org/blog/index.php?pk=&T=2

As an alternative you can also use a QR Code:  

The GUIDs for individual cells are displayed in the table below:

Partial Autocorrelation Function
Time lag kPACF(k)T-STATP-value
1-0.188597-1.58910.058235
2-0.203163-1.71190.045642
30.2541062.14110.017849
4-0.140476-1.18370.120245
5-0.348741-2.93850.002223
60.0105820.08920.464602
7-0.232813-1.96170.026858
8-0.4024-3.39070.000571
90.0323310.27240.393044
10-0.287896-2.42590.008908
110.0618220.52090.302022
120.1033230.87060.19345
130.1835191.54640.063232
140.1686521.42110.079834
150.0228540.19260.423924
16-0.091548-0.77140.221515
17-0.007996-0.06740.473237
18-0.151648-1.27780.102739
190.2863222.41260.009212
20-0.081823-0.68940.246394
210.1027580.86590.194744
22-0.128948-1.08650.140459
23-0.130892-1.10290.136894
240.1250391.05360.147821
250.0488030.41120.341075
26-0.05515-0.46470.321784
270.0587050.49470.311183
280.060180.50710.306832
29-0.003915-0.0330.486888
300.0118410.09980.460401
310.0219520.1850.426889
32-0.08851-0.74580.229127
330.0016730.01410.494396
34-0.00315-0.02650.489451
35-0.063719-0.53690.296506
36-0.010135-0.08540.466091
37-0.014452-0.12180.451711
380.0364180.30690.379924
39-0.108637-0.91540.181543
40-0.11283-0.95070.172485
410.112460.94760.173272
42-0.048848-0.41160.340935
43-0.103999-0.87630.191907
440.0711960.59990.275238
450.01030.08680.465541
460.053070.44720.328053
47-0.007375-0.06210.475312
480.0321960.27130.393478


Parameters (Session):
par1 = 48 ; par2 = 1 ; par3 = 1 ; par4 = 0 ; par5 = 12 ; par6 = White Noise ; par7 = 0.95 ;
Parameters (R input):
par1 = 48 ; par2 = 1 ; par3 = 1 ; par4 = 0 ; par5 = 12 ; par6 = White Noise ; par7 = 0.95 ; par8 = ;
R code (references can be found in the software module):
if (par1 == 'Default') {
par1 = 10*log10(length(x))
} else {
par1 <- as.numeric(par1)
}
par2 <- as.numeric(par2)
par3 <- as.numeric(par3)
par4 <- as.numeric(par4)
par5 <- as.numeric(par5)
if (par6 == 'White Noise') par6 <- 'white' else par6 <- 'ma'
par7 <- as.numeric(par7)
if (par8 != '') par8 <- as.numeric(par8)
x <- na.omit(x)
ox <- x
if (par8 == '') {
if (par2 == 0) {
x <- log(x)
} else {
x <- (x ^ par2 - 1) / par2
}
} else {
x <- log(x,base=par8)
}
if (par3 > 0) x <- diff(x,lag=1,difference=par3)
if (par4 > 0) x <- diff(x,lag=par5,difference=par4)
bitmap(file='picts.png')
op <- par(mfrow=c(2,1))
plot(ox,type='l',main='Original Time Series',xlab='time',ylab='value')
if (par8=='') {
mytitle <- paste('Working Time Series (lambda=',par2,', d=',par3,', D=',par4,')',sep='')
mysub <- paste('(lambda=',par2,', d=',par3,', D=',par4,', CI=', par7, ', CI type=',par6,')',sep='')
} else {
mytitle <- paste('Working Time Series (base=',par8,', d=',par3,', D=',par4,')',sep='')
mysub <- paste('(base=',par8,', d=',par3,', D=',par4,', CI=', par7, ', CI type=',par6,')',sep='')
}
plot(x,type='l', main=mytitle,xlab='time',ylab='value')
par(op)
dev.off()
bitmap(file='pic1.png')
racf <- acf(x, par1, main='Autocorrelation', xlab='time lag', ylab='ACF', ci.type=par6, ci=par7, sub=mysub)
dev.off()
bitmap(file='pic2.png')
rpacf <- pacf(x,par1,main='Partial Autocorrelation',xlab='lags',ylab='PACF',sub=mysub)
dev.off()
(myacf <- c(racf$acf))
(mypacf <- c(rpacf$acf))
lengthx <- length(x)
sqrtn <- sqrt(lengthx)
load(file='createtable')
a<-table.start()
a<-table.row.start(a)
a<-table.element(a,'Autocorrelation Function',4,TRUE)
a<-table.row.end(a)
a<-table.row.start(a)
a<-table.element(a,'Time lag k',header=TRUE)
a<-table.element(a,hyperlink('basics.htm','ACF(k)','click here for more information about the Autocorrelation Function'),header=TRUE)
a<-table.element(a,'T-STAT',header=TRUE)
a<-table.element(a,'P-value',header=TRUE)
a<-table.row.end(a)
for (i in 2:(par1+1)) {
a<-table.row.start(a)
a<-table.element(a,i-1,header=TRUE)
a<-table.element(a,round(myacf[i],6))
mytstat <- myacf[i]*sqrtn
a<-table.element(a,round(mytstat,4))
a<-table.element(a,round(1-pt(abs(mytstat),lengthx),6))
a<-table.row.end(a)
}
a<-table.end(a)
table.save(a,file='mytable.tab')
a<-table.start()
a<-table.row.start(a)
a<-table.element(a,'Partial Autocorrelation Function',4,TRUE)
a<-table.row.end(a)
a<-table.row.start(a)
a<-table.element(a,'Time lag k',header=TRUE)
a<-table.element(a,hyperlink('basics.htm','PACF(k)','click here for more information about the Partial Autocorrelation Function'),header=TRUE)
a<-table.element(a,'T-STAT',header=TRUE)
a<-table.element(a,'P-value',header=TRUE)
a<-table.row.end(a)
for (i in 1:par1) {
a<-table.row.start(a)
a<-table.element(a,i,header=TRUE)
a<-table.element(a,round(mypacf[i],6))
mytstat <- mypacf[i]*sqrtn
a<-table.element(a,round(mytstat,4))
a<-table.element(a,round(1-pt(abs(mytstat),lengthx),6))
a<-table.row.end(a)
}
a<-table.end(a)
table.save(a,file='mytable1.tab')