Free Statistics

of Irreproducible Research!

Author's title

Author*Unverified author*
R Software Modulerwasp_autocorrelation.wasp
Title produced by software(Partial) Autocorrelation Function
Date of computationFri, 17 Mar 2017 11:07:19 +0000
Cite this page as followsStatistical Computations at FreeStatistics.org, Office for Research Development and Education, URL https://freestatistics.org/blog/index.php?v=date/2017/Mar/17/t1489748856pq3zws6wih26xnf.htm/, Retrieved Wed, 15 May 2024 00:45:08 +0200
Statistical Computations at FreeStatistics.org, Office for Research Development and Education, URL https://freestatistics.org/blog/index.php?pk=, Retrieved Wed, 15 May 2024 00:45:08 +0200
QR Codes:

Original text written by user:
IsPrivate?No (this computation is public)
User-defined keywords
Estimated Impact0
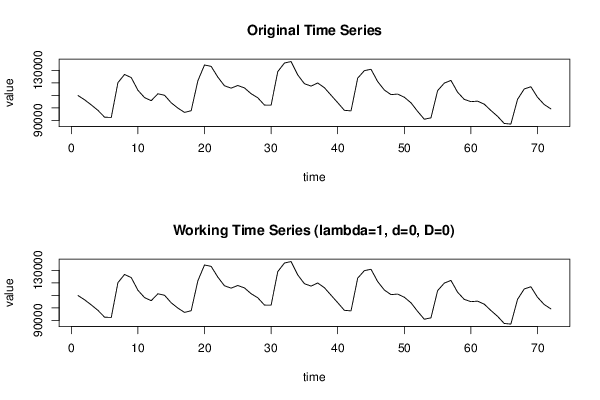
Dataseries X:
109843
106365
102304
97968
92462
92286
120092
126656
124144
114045
108120
105698
111203
110030
104009
99772
96301
97680
121563
134210
133111
124527
117589
115699
117830
115874
111267
107985
102185
102101
128932
135782
136971
126292
119260
117359
119818
116059
110046
104100
97981
97527
123700
129678
130790
120961
114232
110518
110959
108443
103977
97126
90860
91959
113735
119713
121905
112442
106728
104906
105308
102909
97849
93181
87470
86998
106716
115028
116828
108413
102628
99126


Summary of computational transaction
Raw Inputview raw input (R code)
Raw Outputview raw output of R engine
Computing time1 seconds
R Server'Sir Maurice George Kendall' @ kendall.wessa.net

\begin{tabular}{lllllllll}
\hline
Summary of computational transaction \tabularnewline
Raw Input & view raw input (R code)  \tabularnewline
Raw Output & view raw output of R engine  \tabularnewline
Computing time & 1 seconds \tabularnewline
R Server & 'Sir Maurice George Kendall' @ kendall.wessa.net \tabularnewline
\hline
\end{tabular}
%Source: https://freestatistics.org/blog/index.php?pk=&T=0

[TABLE]
[ROW][C]Summary of computational transaction[/C][/ROW]
[ROW][C]Raw Input[/C][C]view raw input (R code) [/C][/ROW]
[ROW][C]Raw Output[/C][C]view raw output of R engine [/C][/ROW]
[ROW][C]Computing time[/C][C]1 seconds[/C][/ROW]
[ROW][C]R Server[/C][C]'Sir Maurice George Kendall' @ kendall.wessa.net[/C][/ROW]
[/TABLE]
Source: https://freestatistics.org/blog/index.php?pk=&T=0

Globally Unique Identifier (entire table): ba.freestatistics.org/blog/index.php?pk=&T=0

As an alternative you can also use a QR Code:  

The GUIDs for individual cells are displayed in the table below:

Summary of computational transaction
Raw Inputview raw input (R code)
Raw Outputview raw output of R engine
Computing time1 seconds
R Server'Sir Maurice George Kendall' @ kendall.wessa.net


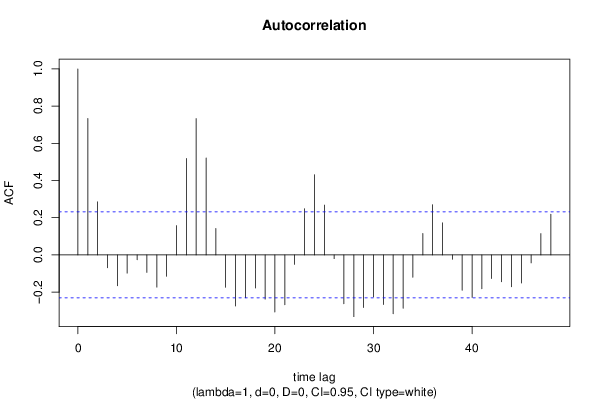
Autocorrelation Function
Time lag kACF(k)T-STATP-value
10.7333716.22290
20.2853222.4210.008999
3-0.069196-0.58710.27947
4-0.166197-1.41020.081388
5-0.097846-0.83030.20457
6-0.026196-0.22230.412363
7-0.093956-0.79720.213965
8-0.173371-1.47110.07281
9-0.114694-0.97320.166853
100.1574781.33620.092839
110.5182334.39741.9e-05
120.7329046.21890
130.5210624.42141.7e-05
140.1419271.20430.116211
15-0.174109-1.47740.07197
16-0.274593-2.330.011307
17-0.230145-1.95280.027363
18-0.177697-1.50780.067989
19-0.237929-2.01890.023611
20-0.306923-2.60430.005587
21-0.267822-2.27250.01302
22-0.050818-0.43120.333805
230.2481762.10580.019353
240.4313183.65990.000239
250.267962.27370.012983
26-0.019847-0.16840.433368
27-0.262978-2.23140.014383
28-0.331912-2.81640.003132
29-0.28304-2.40170.009451
30-0.225568-1.9140.029797
31-0.266603-2.26220.013352
32-0.316576-2.68620.004483
33-0.286619-2.4320.008751
34-0.120104-1.01910.15578
350.1151580.97710.165884
360.2701312.29210.012412
370.1722241.46140.074132
38-0.023637-0.20060.420801
39-0.189645-1.60920.055976
40-0.228432-1.93830.028253
41-0.182273-1.54660.063167
42-0.126921-1.0770.142546
43-0.143887-1.22090.113049
44-0.171502-1.45520.074975
45-0.150917-1.28060.102226
46-0.042958-0.36450.358273
470.1147860.9740.166661
480.2186421.85520.033828

\begin{tabular}{lllllllll}
\hline
Autocorrelation Function \tabularnewline
Time lag k & ACF(k) & T-STAT & P-value \tabularnewline
1 & 0.733371 & 6.2229 & 0 \tabularnewline
2 & 0.285322 & 2.421 & 0.008999 \tabularnewline
3 & -0.069196 & -0.5871 & 0.27947 \tabularnewline
4 & -0.166197 & -1.4102 & 0.081388 \tabularnewline
5 & -0.097846 & -0.8303 & 0.20457 \tabularnewline
6 & -0.026196 & -0.2223 & 0.412363 \tabularnewline
7 & -0.093956 & -0.7972 & 0.213965 \tabularnewline
8 & -0.173371 & -1.4711 & 0.07281 \tabularnewline
9 & -0.114694 & -0.9732 & 0.166853 \tabularnewline
10 & 0.157478 & 1.3362 & 0.092839 \tabularnewline
11 & 0.518233 & 4.3974 & 1.9e-05 \tabularnewline
12 & 0.732904 & 6.2189 & 0 \tabularnewline
13 & 0.521062 & 4.4214 & 1.7e-05 \tabularnewline
14 & 0.141927 & 1.2043 & 0.116211 \tabularnewline
15 & -0.174109 & -1.4774 & 0.07197 \tabularnewline
16 & -0.274593 & -2.33 & 0.011307 \tabularnewline
17 & -0.230145 & -1.9528 & 0.027363 \tabularnewline
18 & -0.177697 & -1.5078 & 0.067989 \tabularnewline
19 & -0.237929 & -2.0189 & 0.023611 \tabularnewline
20 & -0.306923 & -2.6043 & 0.005587 \tabularnewline
21 & -0.267822 & -2.2725 & 0.01302 \tabularnewline
22 & -0.050818 & -0.4312 & 0.333805 \tabularnewline
23 & 0.248176 & 2.1058 & 0.019353 \tabularnewline
24 & 0.431318 & 3.6599 & 0.000239 \tabularnewline
25 & 0.26796 & 2.2737 & 0.012983 \tabularnewline
26 & -0.019847 & -0.1684 & 0.433368 \tabularnewline
27 & -0.262978 & -2.2314 & 0.014383 \tabularnewline
28 & -0.331912 & -2.8164 & 0.003132 \tabularnewline
29 & -0.28304 & -2.4017 & 0.009451 \tabularnewline
30 & -0.225568 & -1.914 & 0.029797 \tabularnewline
31 & -0.266603 & -2.2622 & 0.013352 \tabularnewline
32 & -0.316576 & -2.6862 & 0.004483 \tabularnewline
33 & -0.286619 & -2.432 & 0.008751 \tabularnewline
34 & -0.120104 & -1.0191 & 0.15578 \tabularnewline
35 & 0.115158 & 0.9771 & 0.165884 \tabularnewline
36 & 0.270131 & 2.2921 & 0.012412 \tabularnewline
37 & 0.172224 & 1.4614 & 0.074132 \tabularnewline
38 & -0.023637 & -0.2006 & 0.420801 \tabularnewline
39 & -0.189645 & -1.6092 & 0.055976 \tabularnewline
40 & -0.228432 & -1.9383 & 0.028253 \tabularnewline
41 & -0.182273 & -1.5466 & 0.063167 \tabularnewline
42 & -0.126921 & -1.077 & 0.142546 \tabularnewline
43 & -0.143887 & -1.2209 & 0.113049 \tabularnewline
44 & -0.171502 & -1.4552 & 0.074975 \tabularnewline
45 & -0.150917 & -1.2806 & 0.102226 \tabularnewline
46 & -0.042958 & -0.3645 & 0.358273 \tabularnewline
47 & 0.114786 & 0.974 & 0.166661 \tabularnewline
48 & 0.218642 & 1.8552 & 0.033828 \tabularnewline
\hline
\end{tabular}
%Source: https://freestatistics.org/blog/index.php?pk=&T=1

[TABLE]
[ROW][C]Autocorrelation Function[/C][/ROW]
[ROW][C]Time lag k[/C][C]ACF(k)[/C][C]T-STAT[/C][C]P-value[/C][/ROW]
[ROW][C]1[/C][C]0.733371[/C][C]6.2229[/C][C]0[/C][/ROW]
[ROW][C]2[/C][C]0.285322[/C][C]2.421[/C][C]0.008999[/C][/ROW]
[ROW][C]3[/C][C]-0.069196[/C][C]-0.5871[/C][C]0.27947[/C][/ROW]
[ROW][C]4[/C][C]-0.166197[/C][C]-1.4102[/C][C]0.081388[/C][/ROW]
[ROW][C]5[/C][C]-0.097846[/C][C]-0.8303[/C][C]0.20457[/C][/ROW]
[ROW][C]6[/C][C]-0.026196[/C][C]-0.2223[/C][C]0.412363[/C][/ROW]
[ROW][C]7[/C][C]-0.093956[/C][C]-0.7972[/C][C]0.213965[/C][/ROW]
[ROW][C]8[/C][C]-0.173371[/C][C]-1.4711[/C][C]0.07281[/C][/ROW]
[ROW][C]9[/C][C]-0.114694[/C][C]-0.9732[/C][C]0.166853[/C][/ROW]
[ROW][C]10[/C][C]0.157478[/C][C]1.3362[/C][C]0.092839[/C][/ROW]
[ROW][C]11[/C][C]0.518233[/C][C]4.3974[/C][C]1.9e-05[/C][/ROW]
[ROW][C]12[/C][C]0.732904[/C][C]6.2189[/C][C]0[/C][/ROW]
[ROW][C]13[/C][C]0.521062[/C][C]4.4214[/C][C]1.7e-05[/C][/ROW]
[ROW][C]14[/C][C]0.141927[/C][C]1.2043[/C][C]0.116211[/C][/ROW]
[ROW][C]15[/C][C]-0.174109[/C][C]-1.4774[/C][C]0.07197[/C][/ROW]
[ROW][C]16[/C][C]-0.274593[/C][C]-2.33[/C][C]0.011307[/C][/ROW]
[ROW][C]17[/C][C]-0.230145[/C][C]-1.9528[/C][C]0.027363[/C][/ROW]
[ROW][C]18[/C][C]-0.177697[/C][C]-1.5078[/C][C]0.067989[/C][/ROW]
[ROW][C]19[/C][C]-0.237929[/C][C]-2.0189[/C][C]0.023611[/C][/ROW]
[ROW][C]20[/C][C]-0.306923[/C][C]-2.6043[/C][C]0.005587[/C][/ROW]
[ROW][C]21[/C][C]-0.267822[/C][C]-2.2725[/C][C]0.01302[/C][/ROW]
[ROW][C]22[/C][C]-0.050818[/C][C]-0.4312[/C][C]0.333805[/C][/ROW]
[ROW][C]23[/C][C]0.248176[/C][C]2.1058[/C][C]0.019353[/C][/ROW]
[ROW][C]24[/C][C]0.431318[/C][C]3.6599[/C][C]0.000239[/C][/ROW]
[ROW][C]25[/C][C]0.26796[/C][C]2.2737[/C][C]0.012983[/C][/ROW]
[ROW][C]26[/C][C]-0.019847[/C][C]-0.1684[/C][C]0.433368[/C][/ROW]
[ROW][C]27[/C][C]-0.262978[/C][C]-2.2314[/C][C]0.014383[/C][/ROW]
[ROW][C]28[/C][C]-0.331912[/C][C]-2.8164[/C][C]0.003132[/C][/ROW]
[ROW][C]29[/C][C]-0.28304[/C][C]-2.4017[/C][C]0.009451[/C][/ROW]
[ROW][C]30[/C][C]-0.225568[/C][C]-1.914[/C][C]0.029797[/C][/ROW]
[ROW][C]31[/C][C]-0.266603[/C][C]-2.2622[/C][C]0.013352[/C][/ROW]
[ROW][C]32[/C][C]-0.316576[/C][C]-2.6862[/C][C]0.004483[/C][/ROW]
[ROW][C]33[/C][C]-0.286619[/C][C]-2.432[/C][C]0.008751[/C][/ROW]
[ROW][C]34[/C][C]-0.120104[/C][C]-1.0191[/C][C]0.15578[/C][/ROW]
[ROW][C]35[/C][C]0.115158[/C][C]0.9771[/C][C]0.165884[/C][/ROW]
[ROW][C]36[/C][C]0.270131[/C][C]2.2921[/C][C]0.012412[/C][/ROW]
[ROW][C]37[/C][C]0.172224[/C][C]1.4614[/C][C]0.074132[/C][/ROW]
[ROW][C]38[/C][C]-0.023637[/C][C]-0.2006[/C][C]0.420801[/C][/ROW]
[ROW][C]39[/C][C]-0.189645[/C][C]-1.6092[/C][C]0.055976[/C][/ROW]
[ROW][C]40[/C][C]-0.228432[/C][C]-1.9383[/C][C]0.028253[/C][/ROW]
[ROW][C]41[/C][C]-0.182273[/C][C]-1.5466[/C][C]0.063167[/C][/ROW]
[ROW][C]42[/C][C]-0.126921[/C][C]-1.077[/C][C]0.142546[/C][/ROW]
[ROW][C]43[/C][C]-0.143887[/C][C]-1.2209[/C][C]0.113049[/C][/ROW]
[ROW][C]44[/C][C]-0.171502[/C][C]-1.4552[/C][C]0.074975[/C][/ROW]
[ROW][C]45[/C][C]-0.150917[/C][C]-1.2806[/C][C]0.102226[/C][/ROW]
[ROW][C]46[/C][C]-0.042958[/C][C]-0.3645[/C][C]0.358273[/C][/ROW]
[ROW][C]47[/C][C]0.114786[/C][C]0.974[/C][C]0.166661[/C][/ROW]
[ROW][C]48[/C][C]0.218642[/C][C]1.8552[/C][C]0.033828[/C][/ROW]
[/TABLE]
Source: https://freestatistics.org/blog/index.php?pk=&T=1

Globally Unique Identifier (entire table): ba.freestatistics.org/blog/index.php?pk=&T=1

As an alternative you can also use a QR Code:  

The GUIDs for individual cells are displayed in the table below:

Autocorrelation Function
Time lag kACF(k)T-STATP-value
10.7333716.22290
20.2853222.4210.008999
3-0.069196-0.58710.27947
4-0.166197-1.41020.081388
5-0.097846-0.83030.20457
6-0.026196-0.22230.412363
7-0.093956-0.79720.213965
8-0.173371-1.47110.07281
9-0.114694-0.97320.166853
100.1574781.33620.092839
110.5182334.39741.9e-05
120.7329046.21890
130.5210624.42141.7e-05
140.1419271.20430.116211
15-0.174109-1.47740.07197
16-0.274593-2.330.011307
17-0.230145-1.95280.027363
18-0.177697-1.50780.067989
19-0.237929-2.01890.023611
20-0.306923-2.60430.005587
21-0.267822-2.27250.01302
22-0.050818-0.43120.333805
230.2481762.10580.019353
240.4313183.65990.000239
250.267962.27370.012983
26-0.019847-0.16840.433368
27-0.262978-2.23140.014383
28-0.331912-2.81640.003132
29-0.28304-2.40170.009451
30-0.225568-1.9140.029797
31-0.266603-2.26220.013352
32-0.316576-2.68620.004483
33-0.286619-2.4320.008751
34-0.120104-1.01910.15578
350.1151580.97710.165884
360.2701312.29210.012412
370.1722241.46140.074132
38-0.023637-0.20060.420801
39-0.189645-1.60920.055976
40-0.228432-1.93830.028253
41-0.182273-1.54660.063167
42-0.126921-1.0770.142546
43-0.143887-1.22090.113049
44-0.171502-1.45520.074975
45-0.150917-1.28060.102226
46-0.042958-0.36450.358273
470.1147860.9740.166661
480.2186421.85520.033828


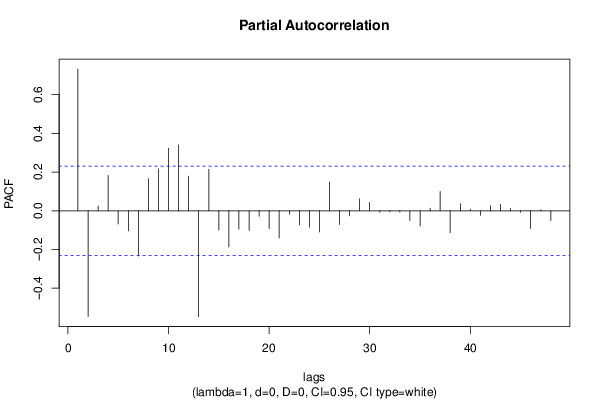
Partial Autocorrelation Function
Time lag kPACF(k)T-STATP-value
10.7333716.22290
2-0.546362-4.6368e-06
30.0244260.20730.418196
40.1823321.54710.063107
5-0.068209-0.57880.282273
6-0.104234-0.88450.189698
7-0.23377-1.98360.025557
80.1662451.41060.081329
90.2164921.8370.035169
100.3231882.74230.003846
110.340232.88690.002566
120.1781271.51150.067525
13-0.547689-4.64737e-06
140.214611.8210.036379
15-0.09973-0.84620.200112
16-0.187611-1.59190.057891
17-0.096101-0.81540.208754
18-0.10233-0.86830.194058
19-0.028314-0.24020.40541
20-0.092329-0.78340.217969
21-0.141291-1.19890.117251
22-0.018036-0.1530.439396
23-0.073495-0.62360.267421
24-0.085453-0.72510.235372
25-0.110379-0.93660.176048
260.148121.25680.106438
27-0.071103-0.60330.274094
28-0.026369-0.22370.411793
290.0625350.53060.298656
300.0433420.36780.357063
31-0.00786-0.06670.473505
32-0.005214-0.04420.482418
33-0.006561-0.05570.477879
34-0.050106-0.42520.335993
35-0.078653-0.66740.253328
360.0128170.10880.456851
370.0993860.84330.200921
38-0.113246-0.96090.169904
390.0367560.31190.378014
400.0073990.06280.475056
41-0.023002-0.19520.422902
420.0256930.2180.414017
430.0328590.27880.390592
440.0113010.09590.461935
45-0.007518-0.06380.474654
46-0.091975-0.78040.218848
470.0045160.03830.48477
48-0.050926-0.43210.333471

\begin{tabular}{lllllllll}
\hline
Partial Autocorrelation Function \tabularnewline
Time lag k & PACF(k) & T-STAT & P-value \tabularnewline
1 & 0.733371 & 6.2229 & 0 \tabularnewline
2 & -0.546362 & -4.636 & 8e-06 \tabularnewline
3 & 0.024426 & 0.2073 & 0.418196 \tabularnewline
4 & 0.182332 & 1.5471 & 0.063107 \tabularnewline
5 & -0.068209 & -0.5788 & 0.282273 \tabularnewline
6 & -0.104234 & -0.8845 & 0.189698 \tabularnewline
7 & -0.23377 & -1.9836 & 0.025557 \tabularnewline
8 & 0.166245 & 1.4106 & 0.081329 \tabularnewline
9 & 0.216492 & 1.837 & 0.035169 \tabularnewline
10 & 0.323188 & 2.7423 & 0.003846 \tabularnewline
11 & 0.34023 & 2.8869 & 0.002566 \tabularnewline
12 & 0.178127 & 1.5115 & 0.067525 \tabularnewline
13 & -0.547689 & -4.6473 & 7e-06 \tabularnewline
14 & 0.21461 & 1.821 & 0.036379 \tabularnewline
15 & -0.09973 & -0.8462 & 0.200112 \tabularnewline
16 & -0.187611 & -1.5919 & 0.057891 \tabularnewline
17 & -0.096101 & -0.8154 & 0.208754 \tabularnewline
18 & -0.10233 & -0.8683 & 0.194058 \tabularnewline
19 & -0.028314 & -0.2402 & 0.40541 \tabularnewline
20 & -0.092329 & -0.7834 & 0.217969 \tabularnewline
21 & -0.141291 & -1.1989 & 0.117251 \tabularnewline
22 & -0.018036 & -0.153 & 0.439396 \tabularnewline
23 & -0.073495 & -0.6236 & 0.267421 \tabularnewline
24 & -0.085453 & -0.7251 & 0.235372 \tabularnewline
25 & -0.110379 & -0.9366 & 0.176048 \tabularnewline
26 & 0.14812 & 1.2568 & 0.106438 \tabularnewline
27 & -0.071103 & -0.6033 & 0.274094 \tabularnewline
28 & -0.026369 & -0.2237 & 0.411793 \tabularnewline
29 & 0.062535 & 0.5306 & 0.298656 \tabularnewline
30 & 0.043342 & 0.3678 & 0.357063 \tabularnewline
31 & -0.00786 & -0.0667 & 0.473505 \tabularnewline
32 & -0.005214 & -0.0442 & 0.482418 \tabularnewline
33 & -0.006561 & -0.0557 & 0.477879 \tabularnewline
34 & -0.050106 & -0.4252 & 0.335993 \tabularnewline
35 & -0.078653 & -0.6674 & 0.253328 \tabularnewline
36 & 0.012817 & 0.1088 & 0.456851 \tabularnewline
37 & 0.099386 & 0.8433 & 0.200921 \tabularnewline
38 & -0.113246 & -0.9609 & 0.169904 \tabularnewline
39 & 0.036756 & 0.3119 & 0.378014 \tabularnewline
40 & 0.007399 & 0.0628 & 0.475056 \tabularnewline
41 & -0.023002 & -0.1952 & 0.422902 \tabularnewline
42 & 0.025693 & 0.218 & 0.414017 \tabularnewline
43 & 0.032859 & 0.2788 & 0.390592 \tabularnewline
44 & 0.011301 & 0.0959 & 0.461935 \tabularnewline
45 & -0.007518 & -0.0638 & 0.474654 \tabularnewline
46 & -0.091975 & -0.7804 & 0.218848 \tabularnewline
47 & 0.004516 & 0.0383 & 0.48477 \tabularnewline
48 & -0.050926 & -0.4321 & 0.333471 \tabularnewline
\hline
\end{tabular}
%Source: https://freestatistics.org/blog/index.php?pk=&T=2

[TABLE]
[ROW][C]Partial Autocorrelation Function[/C][/ROW]
[ROW][C]Time lag k[/C][C]PACF(k)[/C][C]T-STAT[/C][C]P-value[/C][/ROW]
[ROW][C]1[/C][C]0.733371[/C][C]6.2229[/C][C]0[/C][/ROW]
[ROW][C]2[/C][C]-0.546362[/C][C]-4.636[/C][C]8e-06[/C][/ROW]
[ROW][C]3[/C][C]0.024426[/C][C]0.2073[/C][C]0.418196[/C][/ROW]
[ROW][C]4[/C][C]0.182332[/C][C]1.5471[/C][C]0.063107[/C][/ROW]
[ROW][C]5[/C][C]-0.068209[/C][C]-0.5788[/C][C]0.282273[/C][/ROW]
[ROW][C]6[/C][C]-0.104234[/C][C]-0.8845[/C][C]0.189698[/C][/ROW]
[ROW][C]7[/C][C]-0.23377[/C][C]-1.9836[/C][C]0.025557[/C][/ROW]
[ROW][C]8[/C][C]0.166245[/C][C]1.4106[/C][C]0.081329[/C][/ROW]
[ROW][C]9[/C][C]0.216492[/C][C]1.837[/C][C]0.035169[/C][/ROW]
[ROW][C]10[/C][C]0.323188[/C][C]2.7423[/C][C]0.003846[/C][/ROW]
[ROW][C]11[/C][C]0.34023[/C][C]2.8869[/C][C]0.002566[/C][/ROW]
[ROW][C]12[/C][C]0.178127[/C][C]1.5115[/C][C]0.067525[/C][/ROW]
[ROW][C]13[/C][C]-0.547689[/C][C]-4.6473[/C][C]7e-06[/C][/ROW]
[ROW][C]14[/C][C]0.21461[/C][C]1.821[/C][C]0.036379[/C][/ROW]
[ROW][C]15[/C][C]-0.09973[/C][C]-0.8462[/C][C]0.200112[/C][/ROW]
[ROW][C]16[/C][C]-0.187611[/C][C]-1.5919[/C][C]0.057891[/C][/ROW]
[ROW][C]17[/C][C]-0.096101[/C][C]-0.8154[/C][C]0.208754[/C][/ROW]
[ROW][C]18[/C][C]-0.10233[/C][C]-0.8683[/C][C]0.194058[/C][/ROW]
[ROW][C]19[/C][C]-0.028314[/C][C]-0.2402[/C][C]0.40541[/C][/ROW]
[ROW][C]20[/C][C]-0.092329[/C][C]-0.7834[/C][C]0.217969[/C][/ROW]
[ROW][C]21[/C][C]-0.141291[/C][C]-1.1989[/C][C]0.117251[/C][/ROW]
[ROW][C]22[/C][C]-0.018036[/C][C]-0.153[/C][C]0.439396[/C][/ROW]
[ROW][C]23[/C][C]-0.073495[/C][C]-0.6236[/C][C]0.267421[/C][/ROW]
[ROW][C]24[/C][C]-0.085453[/C][C]-0.7251[/C][C]0.235372[/C][/ROW]
[ROW][C]25[/C][C]-0.110379[/C][C]-0.9366[/C][C]0.176048[/C][/ROW]
[ROW][C]26[/C][C]0.14812[/C][C]1.2568[/C][C]0.106438[/C][/ROW]
[ROW][C]27[/C][C]-0.071103[/C][C]-0.6033[/C][C]0.274094[/C][/ROW]
[ROW][C]28[/C][C]-0.026369[/C][C]-0.2237[/C][C]0.411793[/C][/ROW]
[ROW][C]29[/C][C]0.062535[/C][C]0.5306[/C][C]0.298656[/C][/ROW]
[ROW][C]30[/C][C]0.043342[/C][C]0.3678[/C][C]0.357063[/C][/ROW]
[ROW][C]31[/C][C]-0.00786[/C][C]-0.0667[/C][C]0.473505[/C][/ROW]
[ROW][C]32[/C][C]-0.005214[/C][C]-0.0442[/C][C]0.482418[/C][/ROW]
[ROW][C]33[/C][C]-0.006561[/C][C]-0.0557[/C][C]0.477879[/C][/ROW]
[ROW][C]34[/C][C]-0.050106[/C][C]-0.4252[/C][C]0.335993[/C][/ROW]
[ROW][C]35[/C][C]-0.078653[/C][C]-0.6674[/C][C]0.253328[/C][/ROW]
[ROW][C]36[/C][C]0.012817[/C][C]0.1088[/C][C]0.456851[/C][/ROW]
[ROW][C]37[/C][C]0.099386[/C][C]0.8433[/C][C]0.200921[/C][/ROW]
[ROW][C]38[/C][C]-0.113246[/C][C]-0.9609[/C][C]0.169904[/C][/ROW]
[ROW][C]39[/C][C]0.036756[/C][C]0.3119[/C][C]0.378014[/C][/ROW]
[ROW][C]40[/C][C]0.007399[/C][C]0.0628[/C][C]0.475056[/C][/ROW]
[ROW][C]41[/C][C]-0.023002[/C][C]-0.1952[/C][C]0.422902[/C][/ROW]
[ROW][C]42[/C][C]0.025693[/C][C]0.218[/C][C]0.414017[/C][/ROW]
[ROW][C]43[/C][C]0.032859[/C][C]0.2788[/C][C]0.390592[/C][/ROW]
[ROW][C]44[/C][C]0.011301[/C][C]0.0959[/C][C]0.461935[/C][/ROW]
[ROW][C]45[/C][C]-0.007518[/C][C]-0.0638[/C][C]0.474654[/C][/ROW]
[ROW][C]46[/C][C]-0.091975[/C][C]-0.7804[/C][C]0.218848[/C][/ROW]
[ROW][C]47[/C][C]0.004516[/C][C]0.0383[/C][C]0.48477[/C][/ROW]
[ROW][C]48[/C][C]-0.050926[/C][C]-0.4321[/C][C]0.333471[/C][/ROW]
[/TABLE]
Source: https://freestatistics.org/blog/index.php?pk=&T=2

Globally Unique Identifier (entire table): ba.freestatistics.org/blog/index.php?pk=&T=2

As an alternative you can also use a QR Code:  

The GUIDs for individual cells are displayed in the table below:

Partial Autocorrelation Function
Time lag kPACF(k)T-STATP-value
10.7333716.22290
2-0.546362-4.6368e-06
30.0244260.20730.418196
40.1823321.54710.063107
5-0.068209-0.57880.282273
6-0.104234-0.88450.189698
7-0.23377-1.98360.025557
80.1662451.41060.081329
90.2164921.8370.035169
100.3231882.74230.003846
110.340232.88690.002566
120.1781271.51150.067525
13-0.547689-4.64737e-06
140.214611.8210.036379
15-0.09973-0.84620.200112
16-0.187611-1.59190.057891
17-0.096101-0.81540.208754
18-0.10233-0.86830.194058
19-0.028314-0.24020.40541
20-0.092329-0.78340.217969
21-0.141291-1.19890.117251
22-0.018036-0.1530.439396
23-0.073495-0.62360.267421
24-0.085453-0.72510.235372
25-0.110379-0.93660.176048
260.148121.25680.106438
27-0.071103-0.60330.274094
28-0.026369-0.22370.411793
290.0625350.53060.298656
300.0433420.36780.357063
31-0.00786-0.06670.473505
32-0.005214-0.04420.482418
33-0.006561-0.05570.477879
34-0.050106-0.42520.335993
35-0.078653-0.66740.253328
360.0128170.10880.456851
370.0993860.84330.200921
38-0.113246-0.96090.169904
390.0367560.31190.378014
400.0073990.06280.475056
41-0.023002-0.19520.422902
420.0256930.2180.414017
430.0328590.27880.390592
440.0113010.09590.461935
45-0.007518-0.06380.474654
46-0.091975-0.78040.218848
470.0045160.03830.48477
48-0.050926-0.43210.333471


Parameters (Session):
par1 = 48 ; par2 = 1 ; par3 = 0 ; par4 = 0 ; par5 = 12 ; par6 = White Noise ; par7 = 0.95 ;
Parameters (R input):
par1 = 48 ; par2 = 1 ; par3 = 0 ; par4 = 0 ; par5 = 12 ; par6 = White Noise ; par7 = 0.95 ; par8 = ;
R code (references can be found in the software module):
if (par1 == 'Default') {
par1 = 10*log10(length(x))
} else {
par1 <- as.numeric(par1)
}
par2 <- as.numeric(par2)
par3 <- as.numeric(par3)
par4 <- as.numeric(par4)
par5 <- as.numeric(par5)
if (par6 == 'White Noise') par6 <- 'white' else par6 <- 'ma'
par7 <- as.numeric(par7)
if (par8 != '') par8 <- as.numeric(par8)
x <- na.omit(x)
ox <- x
if (par8 == '') {
if (par2 == 0) {
x <- log(x)
} else {
x <- (x ^ par2 - 1) / par2
}
} else {
x <- log(x,base=par8)
}
if (par3 > 0) x <- diff(x,lag=1,difference=par3)
if (par4 > 0) x <- diff(x,lag=par5,difference=par4)
bitmap(file='picts.png')
op <- par(mfrow=c(2,1))
plot(ox,type='l',main='Original Time Series',xlab='time',ylab='value')
if (par8=='') {
mytitle <- paste('Working Time Series (lambda=',par2,', d=',par3,', D=',par4,')',sep='')
mysub <- paste('(lambda=',par2,', d=',par3,', D=',par4,', CI=', par7, ', CI type=',par6,')',sep='')
} else {
mytitle <- paste('Working Time Series (base=',par8,', d=',par3,', D=',par4,')',sep='')
mysub <- paste('(base=',par8,', d=',par3,', D=',par4,', CI=', par7, ', CI type=',par6,')',sep='')
}
plot(x,type='l', main=mytitle,xlab='time',ylab='value')
par(op)
dev.off()
bitmap(file='pic1.png')
racf <- acf(x, par1, main='Autocorrelation', xlab='time lag', ylab='ACF', ci.type=par6, ci=par7, sub=mysub)
dev.off()
bitmap(file='pic2.png')
rpacf <- pacf(x,par1,main='Partial Autocorrelation',xlab='lags',ylab='PACF',sub=mysub)
dev.off()
(myacf <- c(racf$acf))
(mypacf <- c(rpacf$acf))
lengthx <- length(x)
sqrtn <- sqrt(lengthx)
load(file='createtable')
a<-table.start()
a<-table.row.start(a)
a<-table.element(a,'Autocorrelation Function',4,TRUE)
a<-table.row.end(a)
a<-table.row.start(a)
a<-table.element(a,'Time lag k',header=TRUE)
a<-table.element(a,hyperlink('basics.htm','ACF(k)','click here for more information about the Autocorrelation Function'),header=TRUE)
a<-table.element(a,'T-STAT',header=TRUE)
a<-table.element(a,'P-value',header=TRUE)
a<-table.row.end(a)
for (i in 2:(par1+1)) {
a<-table.row.start(a)
a<-table.element(a,i-1,header=TRUE)
a<-table.element(a,round(myacf[i],6))
mytstat <- myacf[i]*sqrtn
a<-table.element(a,round(mytstat,4))
a<-table.element(a,round(1-pt(abs(mytstat),lengthx),6))
a<-table.row.end(a)
}
a<-table.end(a)
table.save(a,file='mytable.tab')
a<-table.start()
a<-table.row.start(a)
a<-table.element(a,'Partial Autocorrelation Function',4,TRUE)
a<-table.row.end(a)
a<-table.row.start(a)
a<-table.element(a,'Time lag k',header=TRUE)
a<-table.element(a,hyperlink('basics.htm','PACF(k)','click here for more information about the Partial Autocorrelation Function'),header=TRUE)
a<-table.element(a,'T-STAT',header=TRUE)
a<-table.element(a,'P-value',header=TRUE)
a<-table.row.end(a)
for (i in 1:par1) {
a<-table.row.start(a)
a<-table.element(a,i,header=TRUE)
a<-table.element(a,round(mypacf[i],6))
mytstat <- mypacf[i]*sqrtn
a<-table.element(a,round(mytstat,4))
a<-table.element(a,round(1-pt(abs(mytstat),lengthx),6))
a<-table.row.end(a)
}
a<-table.end(a)
table.save(a,file='mytable1.tab')