Free Statistics

of Irreproducible Research!

Author's title

Author*Unverified author*
R Software Modulerwasp_autocorrelation.wasp
Title produced by software(Partial) Autocorrelation Function
Date of computationSat, 18 Mar 2017 19:46:39 +0000
Cite this page as followsStatistical Computations at FreeStatistics.org, Office for Research Development and Education, URL https://freestatistics.org/blog/index.php?v=date/2017/Mar/18/t1489866465ufjwmaadc7abtt1.htm/, Retrieved Tue, 14 May 2024 19:30:05 +0200
Statistical Computations at FreeStatistics.org, Office for Research Development and Education, URL https://freestatistics.org/blog/index.php?pk=, Retrieved Tue, 14 May 2024 19:30:05 +0200
QR Codes:

Original text written by user:
IsPrivate?No (this computation is public)
User-defined keywords
Estimated Impact0
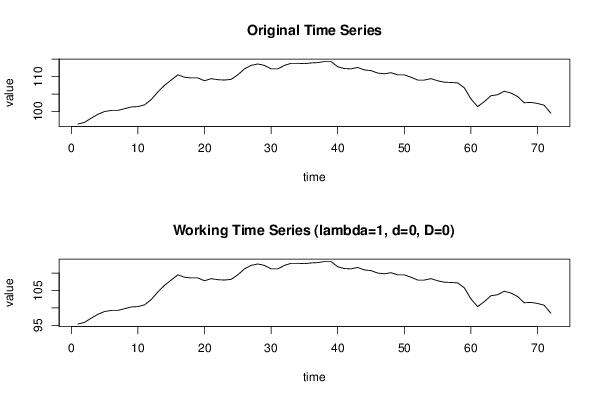
Dataseries X:
96,4
96,9
98,1
99,2
100
100,3
100,3
100,8
101,3
101,4
101,9
103,4
105,6
107,5
109
110,5
109,8
109,6
109,6
108,8
109,4
109,1
109
109,2
110,5
112,2
113,2
113,6
113,2
112,2
112,2
113,2
113,8
113,8
113,7
113,9
114
114,3
114,3
112,8
112,3
112,2
112,6
111,9
111,7
111
110,8
111,1
110,5
110,5
109,8
109
109
109,4
108,8
108,4
108,3
108,2
106,8
103,6
101,4
102,8
104,5
104,8
105,8
105,3
104,3
102,5
102,6
102,3
101,8
99,5


Summary of computational transaction
Raw Inputview raw input (R code)
Raw Outputview raw output of R engine
Computing time1 seconds
R Server'Sir Maurice George Kendall' @ kendall.wessa.net

\begin{tabular}{lllllllll}
\hline
Summary of computational transaction \tabularnewline
Raw Input & view raw input (R code)  \tabularnewline
Raw Output & view raw output of R engine  \tabularnewline
Computing time & 1 seconds \tabularnewline
R Server & 'Sir Maurice George Kendall' @ kendall.wessa.net \tabularnewline
\hline
\end{tabular}
%Source: https://freestatistics.org/blog/index.php?pk=&T=0

[TABLE]
[ROW][C]Summary of computational transaction[/C][/ROW]
[ROW][C]Raw Input[/C][C]view raw input (R code) [/C][/ROW]
[ROW][C]Raw Output[/C][C]view raw output of R engine [/C][/ROW]
[ROW][C]Computing time[/C][C]1 seconds[/C][/ROW]
[ROW][C]R Server[/C][C]'Sir Maurice George Kendall' @ kendall.wessa.net[/C][/ROW]
[/TABLE]
Source: https://freestatistics.org/blog/index.php?pk=&T=0

Globally Unique Identifier (entire table): ba.freestatistics.org/blog/index.php?pk=&T=0

As an alternative you can also use a QR Code:  

The GUIDs for individual cells are displayed in the table below:

Summary of computational transaction
Raw Inputview raw input (R code)
Raw Outputview raw output of R engine
Computing time1 seconds
R Server'Sir Maurice George Kendall' @ kendall.wessa.net


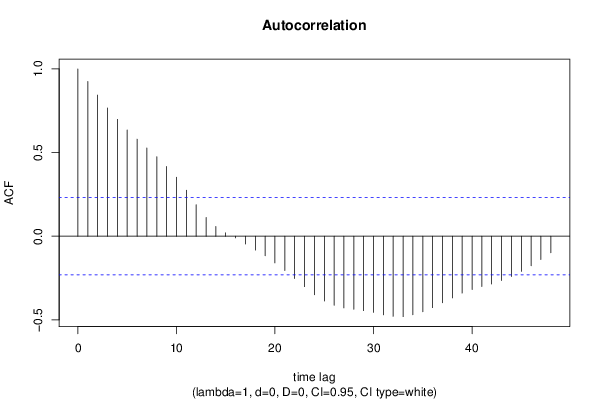
Autocorrelation Function
Time lag kACF(k)T-STATP-value
10.9252797.85130
20.8436427.15850
30.7662816.50210
40.6984595.92660
50.6348175.38660
60.5803224.92423e-06
70.5274394.47551.4e-05
80.4756174.03576.7e-05
90.4169893.53830.000355
100.3524022.99020.001907
110.2753412.33630.01113
120.1877491.59310.057759
130.1123010.95290.171912
140.0582960.49470.311174
150.0199230.16910.433115
16-0.010067-0.08540.466082
17-0.046068-0.39090.348512
18-0.082987-0.70420.241801
19-0.116601-0.98940.162893
20-0.159474-1.35320.090116
21-0.204772-1.73750.043283
22-0.253091-2.14760.017558
23-0.30159-2.55910.006298
24-0.350275-2.97220.002009
25-0.387347-3.28670.000784
26-0.41224-3.4980.000404
27-0.428444-3.63550.000259
28-0.43687-3.7070.000205
29-0.444841-3.77460.000163
30-0.455467-3.86480.000121
31-0.470034-3.98847.9e-05
32-0.479029-4.06476.1e-05
33-0.480832-4.085.7e-05
34-0.469791-3.98638e-05
35-0.451726-3.8330.000134
36-0.426903-3.62240.00027
37-0.398101-3.3780.000591
38-0.368794-3.12930.001265
39-0.340042-2.88540.002578
40-0.318991-2.70670.00424
41-0.300714-2.55160.006423
42-0.285371-2.42150.00899
43-0.265014-2.24870.013796
44-0.240754-2.04290.022364
45-0.210444-1.78570.039181
46-0.176649-1.49890.069134
47-0.13875-1.17730.121469
48-0.098442-0.83530.203153

\begin{tabular}{lllllllll}
\hline
Autocorrelation Function \tabularnewline
Time lag k & ACF(k) & T-STAT & P-value \tabularnewline
1 & 0.925279 & 7.8513 & 0 \tabularnewline
2 & 0.843642 & 7.1585 & 0 \tabularnewline
3 & 0.766281 & 6.5021 & 0 \tabularnewline
4 & 0.698459 & 5.9266 & 0 \tabularnewline
5 & 0.634817 & 5.3866 & 0 \tabularnewline
6 & 0.580322 & 4.9242 & 3e-06 \tabularnewline
7 & 0.527439 & 4.4755 & 1.4e-05 \tabularnewline
8 & 0.475617 & 4.0357 & 6.7e-05 \tabularnewline
9 & 0.416989 & 3.5383 & 0.000355 \tabularnewline
10 & 0.352402 & 2.9902 & 0.001907 \tabularnewline
11 & 0.275341 & 2.3363 & 0.01113 \tabularnewline
12 & 0.187749 & 1.5931 & 0.057759 \tabularnewline
13 & 0.112301 & 0.9529 & 0.171912 \tabularnewline
14 & 0.058296 & 0.4947 & 0.311174 \tabularnewline
15 & 0.019923 & 0.1691 & 0.433115 \tabularnewline
16 & -0.010067 & -0.0854 & 0.466082 \tabularnewline
17 & -0.046068 & -0.3909 & 0.348512 \tabularnewline
18 & -0.082987 & -0.7042 & 0.241801 \tabularnewline
19 & -0.116601 & -0.9894 & 0.162893 \tabularnewline
20 & -0.159474 & -1.3532 & 0.090116 \tabularnewline
21 & -0.204772 & -1.7375 & 0.043283 \tabularnewline
22 & -0.253091 & -2.1476 & 0.017558 \tabularnewline
23 & -0.30159 & -2.5591 & 0.006298 \tabularnewline
24 & -0.350275 & -2.9722 & 0.002009 \tabularnewline
25 & -0.387347 & -3.2867 & 0.000784 \tabularnewline
26 & -0.41224 & -3.498 & 0.000404 \tabularnewline
27 & -0.428444 & -3.6355 & 0.000259 \tabularnewline
28 & -0.43687 & -3.707 & 0.000205 \tabularnewline
29 & -0.444841 & -3.7746 & 0.000163 \tabularnewline
30 & -0.455467 & -3.8648 & 0.000121 \tabularnewline
31 & -0.470034 & -3.9884 & 7.9e-05 \tabularnewline
32 & -0.479029 & -4.0647 & 6.1e-05 \tabularnewline
33 & -0.480832 & -4.08 & 5.7e-05 \tabularnewline
34 & -0.469791 & -3.9863 & 8e-05 \tabularnewline
35 & -0.451726 & -3.833 & 0.000134 \tabularnewline
36 & -0.426903 & -3.6224 & 0.00027 \tabularnewline
37 & -0.398101 & -3.378 & 0.000591 \tabularnewline
38 & -0.368794 & -3.1293 & 0.001265 \tabularnewline
39 & -0.340042 & -2.8854 & 0.002578 \tabularnewline
40 & -0.318991 & -2.7067 & 0.00424 \tabularnewline
41 & -0.300714 & -2.5516 & 0.006423 \tabularnewline
42 & -0.285371 & -2.4215 & 0.00899 \tabularnewline
43 & -0.265014 & -2.2487 & 0.013796 \tabularnewline
44 & -0.240754 & -2.0429 & 0.022364 \tabularnewline
45 & -0.210444 & -1.7857 & 0.039181 \tabularnewline
46 & -0.176649 & -1.4989 & 0.069134 \tabularnewline
47 & -0.13875 & -1.1773 & 0.121469 \tabularnewline
48 & -0.098442 & -0.8353 & 0.203153 \tabularnewline
\hline
\end{tabular}
%Source: https://freestatistics.org/blog/index.php?pk=&T=1

[TABLE]
[ROW][C]Autocorrelation Function[/C][/ROW]
[ROW][C]Time lag k[/C][C]ACF(k)[/C][C]T-STAT[/C][C]P-value[/C][/ROW]
[ROW][C]1[/C][C]0.925279[/C][C]7.8513[/C][C]0[/C][/ROW]
[ROW][C]2[/C][C]0.843642[/C][C]7.1585[/C][C]0[/C][/ROW]
[ROW][C]3[/C][C]0.766281[/C][C]6.5021[/C][C]0[/C][/ROW]
[ROW][C]4[/C][C]0.698459[/C][C]5.9266[/C][C]0[/C][/ROW]
[ROW][C]5[/C][C]0.634817[/C][C]5.3866[/C][C]0[/C][/ROW]
[ROW][C]6[/C][C]0.580322[/C][C]4.9242[/C][C]3e-06[/C][/ROW]
[ROW][C]7[/C][C]0.527439[/C][C]4.4755[/C][C]1.4e-05[/C][/ROW]
[ROW][C]8[/C][C]0.475617[/C][C]4.0357[/C][C]6.7e-05[/C][/ROW]
[ROW][C]9[/C][C]0.416989[/C][C]3.5383[/C][C]0.000355[/C][/ROW]
[ROW][C]10[/C][C]0.352402[/C][C]2.9902[/C][C]0.001907[/C][/ROW]
[ROW][C]11[/C][C]0.275341[/C][C]2.3363[/C][C]0.01113[/C][/ROW]
[ROW][C]12[/C][C]0.187749[/C][C]1.5931[/C][C]0.057759[/C][/ROW]
[ROW][C]13[/C][C]0.112301[/C][C]0.9529[/C][C]0.171912[/C][/ROW]
[ROW][C]14[/C][C]0.058296[/C][C]0.4947[/C][C]0.311174[/C][/ROW]
[ROW][C]15[/C][C]0.019923[/C][C]0.1691[/C][C]0.433115[/C][/ROW]
[ROW][C]16[/C][C]-0.010067[/C][C]-0.0854[/C][C]0.466082[/C][/ROW]
[ROW][C]17[/C][C]-0.046068[/C][C]-0.3909[/C][C]0.348512[/C][/ROW]
[ROW][C]18[/C][C]-0.082987[/C][C]-0.7042[/C][C]0.241801[/C][/ROW]
[ROW][C]19[/C][C]-0.116601[/C][C]-0.9894[/C][C]0.162893[/C][/ROW]
[ROW][C]20[/C][C]-0.159474[/C][C]-1.3532[/C][C]0.090116[/C][/ROW]
[ROW][C]21[/C][C]-0.204772[/C][C]-1.7375[/C][C]0.043283[/C][/ROW]
[ROW][C]22[/C][C]-0.253091[/C][C]-2.1476[/C][C]0.017558[/C][/ROW]
[ROW][C]23[/C][C]-0.30159[/C][C]-2.5591[/C][C]0.006298[/C][/ROW]
[ROW][C]24[/C][C]-0.350275[/C][C]-2.9722[/C][C]0.002009[/C][/ROW]
[ROW][C]25[/C][C]-0.387347[/C][C]-3.2867[/C][C]0.000784[/C][/ROW]
[ROW][C]26[/C][C]-0.41224[/C][C]-3.498[/C][C]0.000404[/C][/ROW]
[ROW][C]27[/C][C]-0.428444[/C][C]-3.6355[/C][C]0.000259[/C][/ROW]
[ROW][C]28[/C][C]-0.43687[/C][C]-3.707[/C][C]0.000205[/C][/ROW]
[ROW][C]29[/C][C]-0.444841[/C][C]-3.7746[/C][C]0.000163[/C][/ROW]
[ROW][C]30[/C][C]-0.455467[/C][C]-3.8648[/C][C]0.000121[/C][/ROW]
[ROW][C]31[/C][C]-0.470034[/C][C]-3.9884[/C][C]7.9e-05[/C][/ROW]
[ROW][C]32[/C][C]-0.479029[/C][C]-4.0647[/C][C]6.1e-05[/C][/ROW]
[ROW][C]33[/C][C]-0.480832[/C][C]-4.08[/C][C]5.7e-05[/C][/ROW]
[ROW][C]34[/C][C]-0.469791[/C][C]-3.9863[/C][C]8e-05[/C][/ROW]
[ROW][C]35[/C][C]-0.451726[/C][C]-3.833[/C][C]0.000134[/C][/ROW]
[ROW][C]36[/C][C]-0.426903[/C][C]-3.6224[/C][C]0.00027[/C][/ROW]
[ROW][C]37[/C][C]-0.398101[/C][C]-3.378[/C][C]0.000591[/C][/ROW]
[ROW][C]38[/C][C]-0.368794[/C][C]-3.1293[/C][C]0.001265[/C][/ROW]
[ROW][C]39[/C][C]-0.340042[/C][C]-2.8854[/C][C]0.002578[/C][/ROW]
[ROW][C]40[/C][C]-0.318991[/C][C]-2.7067[/C][C]0.00424[/C][/ROW]
[ROW][C]41[/C][C]-0.300714[/C][C]-2.5516[/C][C]0.006423[/C][/ROW]
[ROW][C]42[/C][C]-0.285371[/C][C]-2.4215[/C][C]0.00899[/C][/ROW]
[ROW][C]43[/C][C]-0.265014[/C][C]-2.2487[/C][C]0.013796[/C][/ROW]
[ROW][C]44[/C][C]-0.240754[/C][C]-2.0429[/C][C]0.022364[/C][/ROW]
[ROW][C]45[/C][C]-0.210444[/C][C]-1.7857[/C][C]0.039181[/C][/ROW]
[ROW][C]46[/C][C]-0.176649[/C][C]-1.4989[/C][C]0.069134[/C][/ROW]
[ROW][C]47[/C][C]-0.13875[/C][C]-1.1773[/C][C]0.121469[/C][/ROW]
[ROW][C]48[/C][C]-0.098442[/C][C]-0.8353[/C][C]0.203153[/C][/ROW]
[/TABLE]
Source: https://freestatistics.org/blog/index.php?pk=&T=1

Globally Unique Identifier (entire table): ba.freestatistics.org/blog/index.php?pk=&T=1

As an alternative you can also use a QR Code:  

The GUIDs for individual cells are displayed in the table below:

Autocorrelation Function
Time lag kACF(k)T-STATP-value
10.9252797.85130
20.8436427.15850
30.7662816.50210
40.6984595.92660
50.6348175.38660
60.5803224.92423e-06
70.5274394.47551.4e-05
80.4756174.03576.7e-05
90.4169893.53830.000355
100.3524022.99020.001907
110.2753412.33630.01113
120.1877491.59310.057759
130.1123010.95290.171912
140.0582960.49470.311174
150.0199230.16910.433115
16-0.010067-0.08540.466082
17-0.046068-0.39090.348512
18-0.082987-0.70420.241801
19-0.116601-0.98940.162893
20-0.159474-1.35320.090116
21-0.204772-1.73750.043283
22-0.253091-2.14760.017558
23-0.30159-2.55910.006298
24-0.350275-2.97220.002009
25-0.387347-3.28670.000784
26-0.41224-3.4980.000404
27-0.428444-3.63550.000259
28-0.43687-3.7070.000205
29-0.444841-3.77460.000163
30-0.455467-3.86480.000121
31-0.470034-3.98847.9e-05
32-0.479029-4.06476.1e-05
33-0.480832-4.085.7e-05
34-0.469791-3.98638e-05
35-0.451726-3.8330.000134
36-0.426903-3.62240.00027
37-0.398101-3.3780.000591
38-0.368794-3.12930.001265
39-0.340042-2.88540.002578
40-0.318991-2.70670.00424
41-0.300714-2.55160.006423
42-0.285371-2.42150.00899
43-0.265014-2.24870.013796
44-0.240754-2.04290.022364
45-0.210444-1.78570.039181
46-0.176649-1.49890.069134
47-0.13875-1.17730.121469
48-0.098442-0.83530.203153


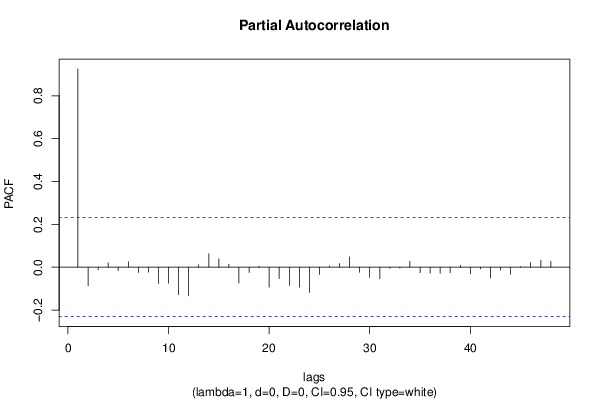
Partial Autocorrelation Function
Time lag kPACF(k)T-STATP-value
10.9252797.85130
2-0.086888-0.73730.231677
3-0.012277-0.10420.458662
40.0202650.1720.431977
5-0.016054-0.13620.446012
60.0255470.21680.4145
7-0.025209-0.21390.415613
8-0.023334-0.1980.421804
9-0.076526-0.64930.25909
10-0.075049-0.63680.263134
11-0.1291-1.09550.138485
12-0.133202-1.13030.131059
130.0119180.10110.459865
140.0628190.5330.297825
150.0386680.32810.37189
160.0130720.11090.455994
17-0.074235-0.62990.265374
18-0.025282-0.21450.415372
190.0043780.03710.485236
20-0.093278-0.79150.215628
21-0.052952-0.44930.327278
22-0.08556-0.7260.235096
23-0.093142-0.79030.215964
24-0.117983-1.00110.160061
25-0.034009-0.28860.386867
260.0051390.04360.482669
270.0167080.14180.443827
280.0471420.40.345167
29-0.023628-0.20050.420831
30-0.046737-0.39660.346427
31-0.054192-0.45980.32351
32-0.005144-0.04370.482652
33-0.0042-0.03560.485834
340.0270170.22920.409664
35-0.025735-0.21840.41388
36-0.027741-0.23540.407286
37-0.028125-0.23860.406028
38-0.026531-0.22510.41126
390.0082910.07040.472054
40-0.030585-0.25950.397987
41-0.008006-0.06790.473014
42-0.050789-0.4310.333893
43-0.013676-0.1160.453971
44-0.032879-0.2790.390527
450.002540.02160.491431
460.0212710.18050.428638
470.0320970.27230.393067
480.0272990.23160.408738

\begin{tabular}{lllllllll}
\hline
Partial Autocorrelation Function \tabularnewline
Time lag k & PACF(k) & T-STAT & P-value \tabularnewline
1 & 0.925279 & 7.8513 & 0 \tabularnewline
2 & -0.086888 & -0.7373 & 0.231677 \tabularnewline
3 & -0.012277 & -0.1042 & 0.458662 \tabularnewline
4 & 0.020265 & 0.172 & 0.431977 \tabularnewline
5 & -0.016054 & -0.1362 & 0.446012 \tabularnewline
6 & 0.025547 & 0.2168 & 0.4145 \tabularnewline
7 & -0.025209 & -0.2139 & 0.415613 \tabularnewline
8 & -0.023334 & -0.198 & 0.421804 \tabularnewline
9 & -0.076526 & -0.6493 & 0.25909 \tabularnewline
10 & -0.075049 & -0.6368 & 0.263134 \tabularnewline
11 & -0.1291 & -1.0955 & 0.138485 \tabularnewline
12 & -0.133202 & -1.1303 & 0.131059 \tabularnewline
13 & 0.011918 & 0.1011 & 0.459865 \tabularnewline
14 & 0.062819 & 0.533 & 0.297825 \tabularnewline
15 & 0.038668 & 0.3281 & 0.37189 \tabularnewline
16 & 0.013072 & 0.1109 & 0.455994 \tabularnewline
17 & -0.074235 & -0.6299 & 0.265374 \tabularnewline
18 & -0.025282 & -0.2145 & 0.415372 \tabularnewline
19 & 0.004378 & 0.0371 & 0.485236 \tabularnewline
20 & -0.093278 & -0.7915 & 0.215628 \tabularnewline
21 & -0.052952 & -0.4493 & 0.327278 \tabularnewline
22 & -0.08556 & -0.726 & 0.235096 \tabularnewline
23 & -0.093142 & -0.7903 & 0.215964 \tabularnewline
24 & -0.117983 & -1.0011 & 0.160061 \tabularnewline
25 & -0.034009 & -0.2886 & 0.386867 \tabularnewline
26 & 0.005139 & 0.0436 & 0.482669 \tabularnewline
27 & 0.016708 & 0.1418 & 0.443827 \tabularnewline
28 & 0.047142 & 0.4 & 0.345167 \tabularnewline
29 & -0.023628 & -0.2005 & 0.420831 \tabularnewline
30 & -0.046737 & -0.3966 & 0.346427 \tabularnewline
31 & -0.054192 & -0.4598 & 0.32351 \tabularnewline
32 & -0.005144 & -0.0437 & 0.482652 \tabularnewline
33 & -0.0042 & -0.0356 & 0.485834 \tabularnewline
34 & 0.027017 & 0.2292 & 0.409664 \tabularnewline
35 & -0.025735 & -0.2184 & 0.41388 \tabularnewline
36 & -0.027741 & -0.2354 & 0.407286 \tabularnewline
37 & -0.028125 & -0.2386 & 0.406028 \tabularnewline
38 & -0.026531 & -0.2251 & 0.41126 \tabularnewline
39 & 0.008291 & 0.0704 & 0.472054 \tabularnewline
40 & -0.030585 & -0.2595 & 0.397987 \tabularnewline
41 & -0.008006 & -0.0679 & 0.473014 \tabularnewline
42 & -0.050789 & -0.431 & 0.333893 \tabularnewline
43 & -0.013676 & -0.116 & 0.453971 \tabularnewline
44 & -0.032879 & -0.279 & 0.390527 \tabularnewline
45 & 0.00254 & 0.0216 & 0.491431 \tabularnewline
46 & 0.021271 & 0.1805 & 0.428638 \tabularnewline
47 & 0.032097 & 0.2723 & 0.393067 \tabularnewline
48 & 0.027299 & 0.2316 & 0.408738 \tabularnewline
\hline
\end{tabular}
%Source: https://freestatistics.org/blog/index.php?pk=&T=2

[TABLE]
[ROW][C]Partial Autocorrelation Function[/C][/ROW]
[ROW][C]Time lag k[/C][C]PACF(k)[/C][C]T-STAT[/C][C]P-value[/C][/ROW]
[ROW][C]1[/C][C]0.925279[/C][C]7.8513[/C][C]0[/C][/ROW]
[ROW][C]2[/C][C]-0.086888[/C][C]-0.7373[/C][C]0.231677[/C][/ROW]
[ROW][C]3[/C][C]-0.012277[/C][C]-0.1042[/C][C]0.458662[/C][/ROW]
[ROW][C]4[/C][C]0.020265[/C][C]0.172[/C][C]0.431977[/C][/ROW]
[ROW][C]5[/C][C]-0.016054[/C][C]-0.1362[/C][C]0.446012[/C][/ROW]
[ROW][C]6[/C][C]0.025547[/C][C]0.2168[/C][C]0.4145[/C][/ROW]
[ROW][C]7[/C][C]-0.025209[/C][C]-0.2139[/C][C]0.415613[/C][/ROW]
[ROW][C]8[/C][C]-0.023334[/C][C]-0.198[/C][C]0.421804[/C][/ROW]
[ROW][C]9[/C][C]-0.076526[/C][C]-0.6493[/C][C]0.25909[/C][/ROW]
[ROW][C]10[/C][C]-0.075049[/C][C]-0.6368[/C][C]0.263134[/C][/ROW]
[ROW][C]11[/C][C]-0.1291[/C][C]-1.0955[/C][C]0.138485[/C][/ROW]
[ROW][C]12[/C][C]-0.133202[/C][C]-1.1303[/C][C]0.131059[/C][/ROW]
[ROW][C]13[/C][C]0.011918[/C][C]0.1011[/C][C]0.459865[/C][/ROW]
[ROW][C]14[/C][C]0.062819[/C][C]0.533[/C][C]0.297825[/C][/ROW]
[ROW][C]15[/C][C]0.038668[/C][C]0.3281[/C][C]0.37189[/C][/ROW]
[ROW][C]16[/C][C]0.013072[/C][C]0.1109[/C][C]0.455994[/C][/ROW]
[ROW][C]17[/C][C]-0.074235[/C][C]-0.6299[/C][C]0.265374[/C][/ROW]
[ROW][C]18[/C][C]-0.025282[/C][C]-0.2145[/C][C]0.415372[/C][/ROW]
[ROW][C]19[/C][C]0.004378[/C][C]0.0371[/C][C]0.485236[/C][/ROW]
[ROW][C]20[/C][C]-0.093278[/C][C]-0.7915[/C][C]0.215628[/C][/ROW]
[ROW][C]21[/C][C]-0.052952[/C][C]-0.4493[/C][C]0.327278[/C][/ROW]
[ROW][C]22[/C][C]-0.08556[/C][C]-0.726[/C][C]0.235096[/C][/ROW]
[ROW][C]23[/C][C]-0.093142[/C][C]-0.7903[/C][C]0.215964[/C][/ROW]
[ROW][C]24[/C][C]-0.117983[/C][C]-1.0011[/C][C]0.160061[/C][/ROW]
[ROW][C]25[/C][C]-0.034009[/C][C]-0.2886[/C][C]0.386867[/C][/ROW]
[ROW][C]26[/C][C]0.005139[/C][C]0.0436[/C][C]0.482669[/C][/ROW]
[ROW][C]27[/C][C]0.016708[/C][C]0.1418[/C][C]0.443827[/C][/ROW]
[ROW][C]28[/C][C]0.047142[/C][C]0.4[/C][C]0.345167[/C][/ROW]
[ROW][C]29[/C][C]-0.023628[/C][C]-0.2005[/C][C]0.420831[/C][/ROW]
[ROW][C]30[/C][C]-0.046737[/C][C]-0.3966[/C][C]0.346427[/C][/ROW]
[ROW][C]31[/C][C]-0.054192[/C][C]-0.4598[/C][C]0.32351[/C][/ROW]
[ROW][C]32[/C][C]-0.005144[/C][C]-0.0437[/C][C]0.482652[/C][/ROW]
[ROW][C]33[/C][C]-0.0042[/C][C]-0.0356[/C][C]0.485834[/C][/ROW]
[ROW][C]34[/C][C]0.027017[/C][C]0.2292[/C][C]0.409664[/C][/ROW]
[ROW][C]35[/C][C]-0.025735[/C][C]-0.2184[/C][C]0.41388[/C][/ROW]
[ROW][C]36[/C][C]-0.027741[/C][C]-0.2354[/C][C]0.407286[/C][/ROW]
[ROW][C]37[/C][C]-0.028125[/C][C]-0.2386[/C][C]0.406028[/C][/ROW]
[ROW][C]38[/C][C]-0.026531[/C][C]-0.2251[/C][C]0.41126[/C][/ROW]
[ROW][C]39[/C][C]0.008291[/C][C]0.0704[/C][C]0.472054[/C][/ROW]
[ROW][C]40[/C][C]-0.030585[/C][C]-0.2595[/C][C]0.397987[/C][/ROW]
[ROW][C]41[/C][C]-0.008006[/C][C]-0.0679[/C][C]0.473014[/C][/ROW]
[ROW][C]42[/C][C]-0.050789[/C][C]-0.431[/C][C]0.333893[/C][/ROW]
[ROW][C]43[/C][C]-0.013676[/C][C]-0.116[/C][C]0.453971[/C][/ROW]
[ROW][C]44[/C][C]-0.032879[/C][C]-0.279[/C][C]0.390527[/C][/ROW]
[ROW][C]45[/C][C]0.00254[/C][C]0.0216[/C][C]0.491431[/C][/ROW]
[ROW][C]46[/C][C]0.021271[/C][C]0.1805[/C][C]0.428638[/C][/ROW]
[ROW][C]47[/C][C]0.032097[/C][C]0.2723[/C][C]0.393067[/C][/ROW]
[ROW][C]48[/C][C]0.027299[/C][C]0.2316[/C][C]0.408738[/C][/ROW]
[/TABLE]
Source: https://freestatistics.org/blog/index.php?pk=&T=2

Globally Unique Identifier (entire table): ba.freestatistics.org/blog/index.php?pk=&T=2

As an alternative you can also use a QR Code:  

The GUIDs for individual cells are displayed in the table below:

Partial Autocorrelation Function
Time lag kPACF(k)T-STATP-value
10.9252797.85130
2-0.086888-0.73730.231677
3-0.012277-0.10420.458662
40.0202650.1720.431977
5-0.016054-0.13620.446012
60.0255470.21680.4145
7-0.025209-0.21390.415613
8-0.023334-0.1980.421804
9-0.076526-0.64930.25909
10-0.075049-0.63680.263134
11-0.1291-1.09550.138485
12-0.133202-1.13030.131059
130.0119180.10110.459865
140.0628190.5330.297825
150.0386680.32810.37189
160.0130720.11090.455994
17-0.074235-0.62990.265374
18-0.025282-0.21450.415372
190.0043780.03710.485236
20-0.093278-0.79150.215628
21-0.052952-0.44930.327278
22-0.08556-0.7260.235096
23-0.093142-0.79030.215964
24-0.117983-1.00110.160061
25-0.034009-0.28860.386867
260.0051390.04360.482669
270.0167080.14180.443827
280.0471420.40.345167
29-0.023628-0.20050.420831
30-0.046737-0.39660.346427
31-0.054192-0.45980.32351
32-0.005144-0.04370.482652
33-0.0042-0.03560.485834
340.0270170.22920.409664
35-0.025735-0.21840.41388
36-0.027741-0.23540.407286
37-0.028125-0.23860.406028
38-0.026531-0.22510.41126
390.0082910.07040.472054
40-0.030585-0.25950.397987
41-0.008006-0.06790.473014
42-0.050789-0.4310.333893
43-0.013676-0.1160.453971
44-0.032879-0.2790.390527
450.002540.02160.491431
460.0212710.18050.428638
470.0320970.27230.393067
480.0272990.23160.408738


Parameters (Session):
par1 = 48 ; par2 = 1 ; par3 = 0 ; par4 = 0 ; par5 = 12 ; par6 = White Noise ; par7 = 0.95 ;
Parameters (R input):
par1 = 48 ; par2 = 1 ; par3 = 0 ; par4 = 0 ; par5 = 12 ; par6 = White Noise ; par7 = 0.95 ; par8 = ;
R code (references can be found in the software module):
if (par1 == 'Default') {
par1 = 10*log10(length(x))
} else {
par1 <- as.numeric(par1)
}
par2 <- as.numeric(par2)
par3 <- as.numeric(par3)
par4 <- as.numeric(par4)
par5 <- as.numeric(par5)
if (par6 == 'White Noise') par6 <- 'white' else par6 <- 'ma'
par7 <- as.numeric(par7)
if (par8 != '') par8 <- as.numeric(par8)
x <- na.omit(x)
ox <- x
if (par8 == '') {
if (par2 == 0) {
x <- log(x)
} else {
x <- (x ^ par2 - 1) / par2
}
} else {
x <- log(x,base=par8)
}
if (par3 > 0) x <- diff(x,lag=1,difference=par3)
if (par4 > 0) x <- diff(x,lag=par5,difference=par4)
bitmap(file='picts.png')
op <- par(mfrow=c(2,1))
plot(ox,type='l',main='Original Time Series',xlab='time',ylab='value')
if (par8=='') {
mytitle <- paste('Working Time Series (lambda=',par2,', d=',par3,', D=',par4,')',sep='')
mysub <- paste('(lambda=',par2,', d=',par3,', D=',par4,', CI=', par7, ', CI type=',par6,')',sep='')
} else {
mytitle <- paste('Working Time Series (base=',par8,', d=',par3,', D=',par4,')',sep='')
mysub <- paste('(base=',par8,', d=',par3,', D=',par4,', CI=', par7, ', CI type=',par6,')',sep='')
}
plot(x,type='l', main=mytitle,xlab='time',ylab='value')
par(op)
dev.off()
bitmap(file='pic1.png')
racf <- acf(x, par1, main='Autocorrelation', xlab='time lag', ylab='ACF', ci.type=par6, ci=par7, sub=mysub)
dev.off()
bitmap(file='pic2.png')
rpacf <- pacf(x,par1,main='Partial Autocorrelation',xlab='lags',ylab='PACF',sub=mysub)
dev.off()
(myacf <- c(racf$acf))
(mypacf <- c(rpacf$acf))
lengthx <- length(x)
sqrtn <- sqrt(lengthx)
load(file='createtable')
a<-table.start()
a<-table.row.start(a)
a<-table.element(a,'Autocorrelation Function',4,TRUE)
a<-table.row.end(a)
a<-table.row.start(a)
a<-table.element(a,'Time lag k',header=TRUE)
a<-table.element(a,hyperlink('basics.htm','ACF(k)','click here for more information about the Autocorrelation Function'),header=TRUE)
a<-table.element(a,'T-STAT',header=TRUE)
a<-table.element(a,'P-value',header=TRUE)
a<-table.row.end(a)
for (i in 2:(par1+1)) {
a<-table.row.start(a)
a<-table.element(a,i-1,header=TRUE)
a<-table.element(a,round(myacf[i],6))
mytstat <- myacf[i]*sqrtn
a<-table.element(a,round(mytstat,4))
a<-table.element(a,round(1-pt(abs(mytstat),lengthx),6))
a<-table.row.end(a)
}
a<-table.end(a)
table.save(a,file='mytable.tab')
a<-table.start()
a<-table.row.start(a)
a<-table.element(a,'Partial Autocorrelation Function',4,TRUE)
a<-table.row.end(a)
a<-table.row.start(a)
a<-table.element(a,'Time lag k',header=TRUE)
a<-table.element(a,hyperlink('basics.htm','PACF(k)','click here for more information about the Partial Autocorrelation Function'),header=TRUE)
a<-table.element(a,'T-STAT',header=TRUE)
a<-table.element(a,'P-value',header=TRUE)
a<-table.row.end(a)
for (i in 1:par1) {
a<-table.row.start(a)
a<-table.element(a,i,header=TRUE)
a<-table.element(a,round(mypacf[i],6))
mytstat <- mypacf[i]*sqrtn
a<-table.element(a,round(mytstat,4))
a<-table.element(a,round(1-pt(abs(mytstat),lengthx),6))
a<-table.row.end(a)
}
a<-table.end(a)
table.save(a,file='mytable1.tab')