Free Statistics

of Irreproducible Research!

Author's title

Author*Unverified author*
R Software Modulerwasp_autocorrelation.wasp
Title produced by software(Partial) Autocorrelation Function
Date of computationSat, 18 Mar 2017 19:51:29 +0000
Cite this page as followsStatistical Computations at FreeStatistics.org, Office for Research Development and Education, URL https://freestatistics.org/blog/index.php?v=date/2017/Mar/18/t1489866778wadovk05te8kc8r.htm/, Retrieved Tue, 14 May 2024 20:19:21 +0200
Statistical Computations at FreeStatistics.org, Office for Research Development and Education, URL https://freestatistics.org/blog/index.php?pk=, Retrieved Tue, 14 May 2024 20:19:21 +0200
QR Codes:

Original text written by user:
IsPrivate?No (this computation is public)
User-defined keywords
Estimated Impact0
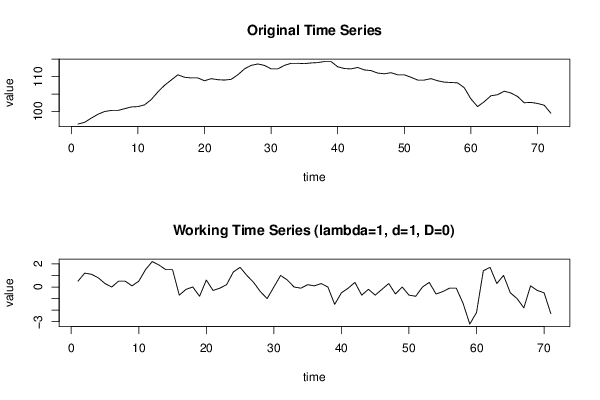
Dataseries X:
96.4
96.9
98.1
99.2
100
100.3
100.3
100.8
101.3
101.4
101.9
103.4
105.6
107.5
109
110.5
109.8
109.6
109.6
108.8
109.4
109.1
109
109.2
110.5
112.2
113.2
113.6
113.2
112.2
112.2
113.2
113.8
113.8
113.7
113.9
114
114.3
114.3
112.8
112.3
112.2
112.6
111.9
111.7
111
110.8
111.1
110.5
110.5
109.8
109
109
109.4
108.8
108.4
108.3
108.2
106.8
103.6
101.4
102.8
104.5
104.8
105.8
105.3
104.3
102.5
102.6
102.3
101.8
99.5


Summary of computational transaction
Raw Inputview raw input (R code)
Raw Outputview raw output of R engine
Computing time1 seconds
R Server'Herman Ole Andreas Wold' @ wold.wessa.net

\begin{tabular}{lllllllll}
\hline
Summary of computational transaction \tabularnewline
Raw Input & view raw input (R code)  \tabularnewline
Raw Output & view raw output of R engine  \tabularnewline
Computing time & 1 seconds \tabularnewline
R Server & 'Herman Ole Andreas Wold' @ wold.wessa.net \tabularnewline
\hline
\end{tabular}
%Source: https://freestatistics.org/blog/index.php?pk=&T=0

[TABLE]
[ROW][C]Summary of computational transaction[/C][/ROW]
[ROW][C]Raw Input[/C][C]view raw input (R code) [/C][/ROW]
[ROW][C]Raw Output[/C][C]view raw output of R engine [/C][/ROW]
[ROW][C]Computing time[/C][C]1 seconds[/C][/ROW]
[ROW][C]R Server[/C][C]'Herman Ole Andreas Wold' @ wold.wessa.net[/C][/ROW]
[/TABLE]
Source: https://freestatistics.org/blog/index.php?pk=&T=0

Globally Unique Identifier (entire table): ba.freestatistics.org/blog/index.php?pk=&T=0

As an alternative you can also use a QR Code:  

The GUIDs for individual cells are displayed in the table below:

Summary of computational transaction
Raw Inputview raw input (R code)
Raw Outputview raw output of R engine
Computing time1 seconds
R Server'Herman Ole Andreas Wold' @ wold.wessa.net


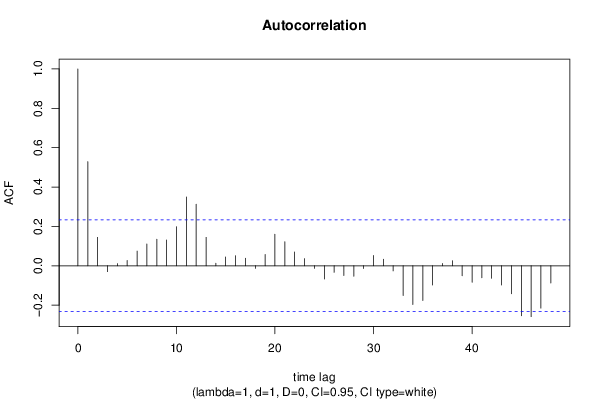
Autocorrelation Function
Time lag kACF(k)T-STATP-value
10.5289394.45691.5e-05
20.1442411.21540.114121
3-0.02992-0.25210.400841
40.0108250.09120.463788
50.026740.22530.411191
60.0742890.6260.266672
70.1109660.9350.176474
80.1346151.13430.130245
90.1307631.10180.137129
100.1978261.66690.049969
110.3496682.94640.002173
120.3129352.63680.005136
130.1441391.21450.114284
140.0130830.11020.456264
150.044680.37650.353843
160.0511350.43090.333935
170.0381990.32190.374249
18-0.013482-0.11360.454938
190.0571710.48170.31574
200.1600671.34870.090852
210.1220521.02840.153621
220.0698070.58820.279131
230.0361140.30430.380894
24-0.013283-0.11190.455599
25-0.067825-0.57150.28473
26-0.033552-0.28270.389109
27-0.049502-0.41710.338929
28-0.053407-0.450.327036
29-0.014023-0.11820.453137
300.0523320.4410.330293
310.0332130.27990.390202
32-0.026179-0.22060.413022
33-0.151115-1.27330.103529
34-0.197234-1.66190.050469
35-0.176552-1.48770.070636
36-0.098089-0.82650.205641
370.0118810.10010.46027
380.0253350.21350.415782
39-0.050951-0.42930.334495
40-0.084125-0.70880.24037
41-0.06144-0.51770.303137
42-0.063399-0.53420.297434
43-0.097717-0.82340.206525
44-0.14226-1.19870.117314
45-0.254052-2.14070.017868
46-0.258669-2.17960.016303
47-0.21533-1.81440.03692
48-0.087317-0.73570.232153

\begin{tabular}{lllllllll}
\hline
Autocorrelation Function \tabularnewline
Time lag k & ACF(k) & T-STAT & P-value \tabularnewline
1 & 0.528939 & 4.4569 & 1.5e-05 \tabularnewline
2 & 0.144241 & 1.2154 & 0.114121 \tabularnewline
3 & -0.02992 & -0.2521 & 0.400841 \tabularnewline
4 & 0.010825 & 0.0912 & 0.463788 \tabularnewline
5 & 0.02674 & 0.2253 & 0.411191 \tabularnewline
6 & 0.074289 & 0.626 & 0.266672 \tabularnewline
7 & 0.110966 & 0.935 & 0.176474 \tabularnewline
8 & 0.134615 & 1.1343 & 0.130245 \tabularnewline
9 & 0.130763 & 1.1018 & 0.137129 \tabularnewline
10 & 0.197826 & 1.6669 & 0.049969 \tabularnewline
11 & 0.349668 & 2.9464 & 0.002173 \tabularnewline
12 & 0.312935 & 2.6368 & 0.005136 \tabularnewline
13 & 0.144139 & 1.2145 & 0.114284 \tabularnewline
14 & 0.013083 & 0.1102 & 0.456264 \tabularnewline
15 & 0.04468 & 0.3765 & 0.353843 \tabularnewline
16 & 0.051135 & 0.4309 & 0.333935 \tabularnewline
17 & 0.038199 & 0.3219 & 0.374249 \tabularnewline
18 & -0.013482 & -0.1136 & 0.454938 \tabularnewline
19 & 0.057171 & 0.4817 & 0.31574 \tabularnewline
20 & 0.160067 & 1.3487 & 0.090852 \tabularnewline
21 & 0.122052 & 1.0284 & 0.153621 \tabularnewline
22 & 0.069807 & 0.5882 & 0.279131 \tabularnewline
23 & 0.036114 & 0.3043 & 0.380894 \tabularnewline
24 & -0.013283 & -0.1119 & 0.455599 \tabularnewline
25 & -0.067825 & -0.5715 & 0.28473 \tabularnewline
26 & -0.033552 & -0.2827 & 0.389109 \tabularnewline
27 & -0.049502 & -0.4171 & 0.338929 \tabularnewline
28 & -0.053407 & -0.45 & 0.327036 \tabularnewline
29 & -0.014023 & -0.1182 & 0.453137 \tabularnewline
30 & 0.052332 & 0.441 & 0.330293 \tabularnewline
31 & 0.033213 & 0.2799 & 0.390202 \tabularnewline
32 & -0.026179 & -0.2206 & 0.413022 \tabularnewline
33 & -0.151115 & -1.2733 & 0.103529 \tabularnewline
34 & -0.197234 & -1.6619 & 0.050469 \tabularnewline
35 & -0.176552 & -1.4877 & 0.070636 \tabularnewline
36 & -0.098089 & -0.8265 & 0.205641 \tabularnewline
37 & 0.011881 & 0.1001 & 0.46027 \tabularnewline
38 & 0.025335 & 0.2135 & 0.415782 \tabularnewline
39 & -0.050951 & -0.4293 & 0.334495 \tabularnewline
40 & -0.084125 & -0.7088 & 0.24037 \tabularnewline
41 & -0.06144 & -0.5177 & 0.303137 \tabularnewline
42 & -0.063399 & -0.5342 & 0.297434 \tabularnewline
43 & -0.097717 & -0.8234 & 0.206525 \tabularnewline
44 & -0.14226 & -1.1987 & 0.117314 \tabularnewline
45 & -0.254052 & -2.1407 & 0.017868 \tabularnewline
46 & -0.258669 & -2.1796 & 0.016303 \tabularnewline
47 & -0.21533 & -1.8144 & 0.03692 \tabularnewline
48 & -0.087317 & -0.7357 & 0.232153 \tabularnewline
\hline
\end{tabular}
%Source: https://freestatistics.org/blog/index.php?pk=&T=1

[TABLE]
[ROW][C]Autocorrelation Function[/C][/ROW]
[ROW][C]Time lag k[/C][C]ACF(k)[/C][C]T-STAT[/C][C]P-value[/C][/ROW]
[ROW][C]1[/C][C]0.528939[/C][C]4.4569[/C][C]1.5e-05[/C][/ROW]
[ROW][C]2[/C][C]0.144241[/C][C]1.2154[/C][C]0.114121[/C][/ROW]
[ROW][C]3[/C][C]-0.02992[/C][C]-0.2521[/C][C]0.400841[/C][/ROW]
[ROW][C]4[/C][C]0.010825[/C][C]0.0912[/C][C]0.463788[/C][/ROW]
[ROW][C]5[/C][C]0.02674[/C][C]0.2253[/C][C]0.411191[/C][/ROW]
[ROW][C]6[/C][C]0.074289[/C][C]0.626[/C][C]0.266672[/C][/ROW]
[ROW][C]7[/C][C]0.110966[/C][C]0.935[/C][C]0.176474[/C][/ROW]
[ROW][C]8[/C][C]0.134615[/C][C]1.1343[/C][C]0.130245[/C][/ROW]
[ROW][C]9[/C][C]0.130763[/C][C]1.1018[/C][C]0.137129[/C][/ROW]
[ROW][C]10[/C][C]0.197826[/C][C]1.6669[/C][C]0.049969[/C][/ROW]
[ROW][C]11[/C][C]0.349668[/C][C]2.9464[/C][C]0.002173[/C][/ROW]
[ROW][C]12[/C][C]0.312935[/C][C]2.6368[/C][C]0.005136[/C][/ROW]
[ROW][C]13[/C][C]0.144139[/C][C]1.2145[/C][C]0.114284[/C][/ROW]
[ROW][C]14[/C][C]0.013083[/C][C]0.1102[/C][C]0.456264[/C][/ROW]
[ROW][C]15[/C][C]0.04468[/C][C]0.3765[/C][C]0.353843[/C][/ROW]
[ROW][C]16[/C][C]0.051135[/C][C]0.4309[/C][C]0.333935[/C][/ROW]
[ROW][C]17[/C][C]0.038199[/C][C]0.3219[/C][C]0.374249[/C][/ROW]
[ROW][C]18[/C][C]-0.013482[/C][C]-0.1136[/C][C]0.454938[/C][/ROW]
[ROW][C]19[/C][C]0.057171[/C][C]0.4817[/C][C]0.31574[/C][/ROW]
[ROW][C]20[/C][C]0.160067[/C][C]1.3487[/C][C]0.090852[/C][/ROW]
[ROW][C]21[/C][C]0.122052[/C][C]1.0284[/C][C]0.153621[/C][/ROW]
[ROW][C]22[/C][C]0.069807[/C][C]0.5882[/C][C]0.279131[/C][/ROW]
[ROW][C]23[/C][C]0.036114[/C][C]0.3043[/C][C]0.380894[/C][/ROW]
[ROW][C]24[/C][C]-0.013283[/C][C]-0.1119[/C][C]0.455599[/C][/ROW]
[ROW][C]25[/C][C]-0.067825[/C][C]-0.5715[/C][C]0.28473[/C][/ROW]
[ROW][C]26[/C][C]-0.033552[/C][C]-0.2827[/C][C]0.389109[/C][/ROW]
[ROW][C]27[/C][C]-0.049502[/C][C]-0.4171[/C][C]0.338929[/C][/ROW]
[ROW][C]28[/C][C]-0.053407[/C][C]-0.45[/C][C]0.327036[/C][/ROW]
[ROW][C]29[/C][C]-0.014023[/C][C]-0.1182[/C][C]0.453137[/C][/ROW]
[ROW][C]30[/C][C]0.052332[/C][C]0.441[/C][C]0.330293[/C][/ROW]
[ROW][C]31[/C][C]0.033213[/C][C]0.2799[/C][C]0.390202[/C][/ROW]
[ROW][C]32[/C][C]-0.026179[/C][C]-0.2206[/C][C]0.413022[/C][/ROW]
[ROW][C]33[/C][C]-0.151115[/C][C]-1.2733[/C][C]0.103529[/C][/ROW]
[ROW][C]34[/C][C]-0.197234[/C][C]-1.6619[/C][C]0.050469[/C][/ROW]
[ROW][C]35[/C][C]-0.176552[/C][C]-1.4877[/C][C]0.070636[/C][/ROW]
[ROW][C]36[/C][C]-0.098089[/C][C]-0.8265[/C][C]0.205641[/C][/ROW]
[ROW][C]37[/C][C]0.011881[/C][C]0.1001[/C][C]0.46027[/C][/ROW]
[ROW][C]38[/C][C]0.025335[/C][C]0.2135[/C][C]0.415782[/C][/ROW]
[ROW][C]39[/C][C]-0.050951[/C][C]-0.4293[/C][C]0.334495[/C][/ROW]
[ROW][C]40[/C][C]-0.084125[/C][C]-0.7088[/C][C]0.24037[/C][/ROW]
[ROW][C]41[/C][C]-0.06144[/C][C]-0.5177[/C][C]0.303137[/C][/ROW]
[ROW][C]42[/C][C]-0.063399[/C][C]-0.5342[/C][C]0.297434[/C][/ROW]
[ROW][C]43[/C][C]-0.097717[/C][C]-0.8234[/C][C]0.206525[/C][/ROW]
[ROW][C]44[/C][C]-0.14226[/C][C]-1.1987[/C][C]0.117314[/C][/ROW]
[ROW][C]45[/C][C]-0.254052[/C][C]-2.1407[/C][C]0.017868[/C][/ROW]
[ROW][C]46[/C][C]-0.258669[/C][C]-2.1796[/C][C]0.016303[/C][/ROW]
[ROW][C]47[/C][C]-0.21533[/C][C]-1.8144[/C][C]0.03692[/C][/ROW]
[ROW][C]48[/C][C]-0.087317[/C][C]-0.7357[/C][C]0.232153[/C][/ROW]
[/TABLE]
Source: https://freestatistics.org/blog/index.php?pk=&T=1

Globally Unique Identifier (entire table): ba.freestatistics.org/blog/index.php?pk=&T=1

As an alternative you can also use a QR Code:  

The GUIDs for individual cells are displayed in the table below:

Autocorrelation Function
Time lag kACF(k)T-STATP-value
10.5289394.45691.5e-05
20.1442411.21540.114121
3-0.02992-0.25210.400841
40.0108250.09120.463788
50.026740.22530.411191
60.0742890.6260.266672
70.1109660.9350.176474
80.1346151.13430.130245
90.1307631.10180.137129
100.1978261.66690.049969
110.3496682.94640.002173
120.3129352.63680.005136
130.1441391.21450.114284
140.0130830.11020.456264
150.044680.37650.353843
160.0511350.43090.333935
170.0381990.32190.374249
18-0.013482-0.11360.454938
190.0571710.48170.31574
200.1600671.34870.090852
210.1220521.02840.153621
220.0698070.58820.279131
230.0361140.30430.380894
24-0.013283-0.11190.455599
25-0.067825-0.57150.28473
26-0.033552-0.28270.389109
27-0.049502-0.41710.338929
28-0.053407-0.450.327036
29-0.014023-0.11820.453137
300.0523320.4410.330293
310.0332130.27990.390202
32-0.026179-0.22060.413022
33-0.151115-1.27330.103529
34-0.197234-1.66190.050469
35-0.176552-1.48770.070636
36-0.098089-0.82650.205641
370.0118810.10010.46027
380.0253350.21350.415782
39-0.050951-0.42930.334495
40-0.084125-0.70880.24037
41-0.06144-0.51770.303137
42-0.063399-0.53420.297434
43-0.097717-0.82340.206525
44-0.14226-1.19870.117314
45-0.254052-2.14070.017868
46-0.258669-2.17960.016303
47-0.21533-1.81440.03692
48-0.087317-0.73570.232153


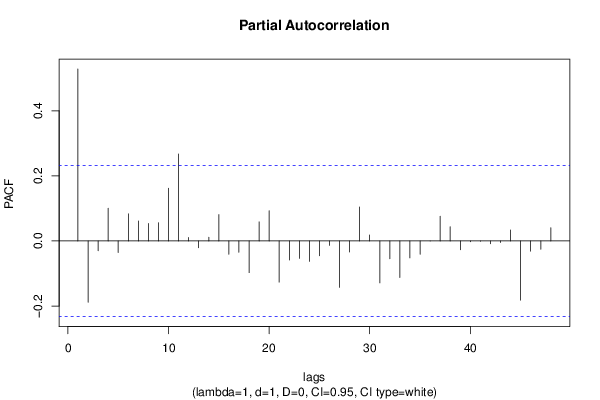
Partial Autocorrelation Function
Time lag kPACF(k)T-STATP-value
10.5289394.45691.5e-05
2-0.188186-1.58570.058627
3-0.030276-0.25510.399686
40.100670.84830.199571
5-0.03555-0.29960.382696
60.0834640.70330.242089
70.0616650.51960.30248
80.054010.45510.325215
90.0562280.47380.318554
100.1622171.36690.08799
110.267322.25250.013692
120.0109310.09210.463436
13-0.021058-0.17740.429835
140.011460.09660.461674
150.0810430.68290.248453
16-0.04068-0.34280.366391
17-0.034557-0.29120.38588
18-0.097371-0.82050.20735
190.0587560.49510.311034
200.0932550.78580.217305
21-0.126587-1.06660.144873
22-0.058286-0.49110.312426
23-0.053523-0.4510.326685
24-0.062667-0.5280.29956
25-0.045364-0.38220.351711
26-0.013503-0.11380.454867
27-0.142538-1.2010.116862
28-0.033926-0.28590.387907
290.1045410.88090.190677
300.0186260.15690.437867
31-0.128734-1.08470.140855
32-0.054821-0.46190.322772
33-0.112379-0.94690.173446
34-0.051854-0.43690.331745
35-0.041021-0.34560.365315
36-0.000331-0.00280.498891
370.0762960.64290.261186
380.0438910.36980.356304
39-0.026743-0.22530.41118
40-0.002271-0.01910.492393
41-0.000874-0.00740.497074
42-0.008611-0.07260.47118
43-0.004859-0.04090.483729
440.0336440.28350.388813
45-0.181905-1.53280.06489
46-0.031274-0.26350.396455
47-0.025616-0.21580.414863
480.0407150.34310.366279

\begin{tabular}{lllllllll}
\hline
Partial Autocorrelation Function \tabularnewline
Time lag k & PACF(k) & T-STAT & P-value \tabularnewline
1 & 0.528939 & 4.4569 & 1.5e-05 \tabularnewline
2 & -0.188186 & -1.5857 & 0.058627 \tabularnewline
3 & -0.030276 & -0.2551 & 0.399686 \tabularnewline
4 & 0.10067 & 0.8483 & 0.199571 \tabularnewline
5 & -0.03555 & -0.2996 & 0.382696 \tabularnewline
6 & 0.083464 & 0.7033 & 0.242089 \tabularnewline
7 & 0.061665 & 0.5196 & 0.30248 \tabularnewline
8 & 0.05401 & 0.4551 & 0.325215 \tabularnewline
9 & 0.056228 & 0.4738 & 0.318554 \tabularnewline
10 & 0.162217 & 1.3669 & 0.08799 \tabularnewline
11 & 0.26732 & 2.2525 & 0.013692 \tabularnewline
12 & 0.010931 & 0.0921 & 0.463436 \tabularnewline
13 & -0.021058 & -0.1774 & 0.429835 \tabularnewline
14 & 0.01146 & 0.0966 & 0.461674 \tabularnewline
15 & 0.081043 & 0.6829 & 0.248453 \tabularnewline
16 & -0.04068 & -0.3428 & 0.366391 \tabularnewline
17 & -0.034557 & -0.2912 & 0.38588 \tabularnewline
18 & -0.097371 & -0.8205 & 0.20735 \tabularnewline
19 & 0.058756 & 0.4951 & 0.311034 \tabularnewline
20 & 0.093255 & 0.7858 & 0.217305 \tabularnewline
21 & -0.126587 & -1.0666 & 0.144873 \tabularnewline
22 & -0.058286 & -0.4911 & 0.312426 \tabularnewline
23 & -0.053523 & -0.451 & 0.326685 \tabularnewline
24 & -0.062667 & -0.528 & 0.29956 \tabularnewline
25 & -0.045364 & -0.3822 & 0.351711 \tabularnewline
26 & -0.013503 & -0.1138 & 0.454867 \tabularnewline
27 & -0.142538 & -1.201 & 0.116862 \tabularnewline
28 & -0.033926 & -0.2859 & 0.387907 \tabularnewline
29 & 0.104541 & 0.8809 & 0.190677 \tabularnewline
30 & 0.018626 & 0.1569 & 0.437867 \tabularnewline
31 & -0.128734 & -1.0847 & 0.140855 \tabularnewline
32 & -0.054821 & -0.4619 & 0.322772 \tabularnewline
33 & -0.112379 & -0.9469 & 0.173446 \tabularnewline
34 & -0.051854 & -0.4369 & 0.331745 \tabularnewline
35 & -0.041021 & -0.3456 & 0.365315 \tabularnewline
36 & -0.000331 & -0.0028 & 0.498891 \tabularnewline
37 & 0.076296 & 0.6429 & 0.261186 \tabularnewline
38 & 0.043891 & 0.3698 & 0.356304 \tabularnewline
39 & -0.026743 & -0.2253 & 0.41118 \tabularnewline
40 & -0.002271 & -0.0191 & 0.492393 \tabularnewline
41 & -0.000874 & -0.0074 & 0.497074 \tabularnewline
42 & -0.008611 & -0.0726 & 0.47118 \tabularnewline
43 & -0.004859 & -0.0409 & 0.483729 \tabularnewline
44 & 0.033644 & 0.2835 & 0.388813 \tabularnewline
45 & -0.181905 & -1.5328 & 0.06489 \tabularnewline
46 & -0.031274 & -0.2635 & 0.396455 \tabularnewline
47 & -0.025616 & -0.2158 & 0.414863 \tabularnewline
48 & 0.040715 & 0.3431 & 0.366279 \tabularnewline
\hline
\end{tabular}
%Source: https://freestatistics.org/blog/index.php?pk=&T=2

[TABLE]
[ROW][C]Partial Autocorrelation Function[/C][/ROW]
[ROW][C]Time lag k[/C][C]PACF(k)[/C][C]T-STAT[/C][C]P-value[/C][/ROW]
[ROW][C]1[/C][C]0.528939[/C][C]4.4569[/C][C]1.5e-05[/C][/ROW]
[ROW][C]2[/C][C]-0.188186[/C][C]-1.5857[/C][C]0.058627[/C][/ROW]
[ROW][C]3[/C][C]-0.030276[/C][C]-0.2551[/C][C]0.399686[/C][/ROW]
[ROW][C]4[/C][C]0.10067[/C][C]0.8483[/C][C]0.199571[/C][/ROW]
[ROW][C]5[/C][C]-0.03555[/C][C]-0.2996[/C][C]0.382696[/C][/ROW]
[ROW][C]6[/C][C]0.083464[/C][C]0.7033[/C][C]0.242089[/C][/ROW]
[ROW][C]7[/C][C]0.061665[/C][C]0.5196[/C][C]0.30248[/C][/ROW]
[ROW][C]8[/C][C]0.05401[/C][C]0.4551[/C][C]0.325215[/C][/ROW]
[ROW][C]9[/C][C]0.056228[/C][C]0.4738[/C][C]0.318554[/C][/ROW]
[ROW][C]10[/C][C]0.162217[/C][C]1.3669[/C][C]0.08799[/C][/ROW]
[ROW][C]11[/C][C]0.26732[/C][C]2.2525[/C][C]0.013692[/C][/ROW]
[ROW][C]12[/C][C]0.010931[/C][C]0.0921[/C][C]0.463436[/C][/ROW]
[ROW][C]13[/C][C]-0.021058[/C][C]-0.1774[/C][C]0.429835[/C][/ROW]
[ROW][C]14[/C][C]0.01146[/C][C]0.0966[/C][C]0.461674[/C][/ROW]
[ROW][C]15[/C][C]0.081043[/C][C]0.6829[/C][C]0.248453[/C][/ROW]
[ROW][C]16[/C][C]-0.04068[/C][C]-0.3428[/C][C]0.366391[/C][/ROW]
[ROW][C]17[/C][C]-0.034557[/C][C]-0.2912[/C][C]0.38588[/C][/ROW]
[ROW][C]18[/C][C]-0.097371[/C][C]-0.8205[/C][C]0.20735[/C][/ROW]
[ROW][C]19[/C][C]0.058756[/C][C]0.4951[/C][C]0.311034[/C][/ROW]
[ROW][C]20[/C][C]0.093255[/C][C]0.7858[/C][C]0.217305[/C][/ROW]
[ROW][C]21[/C][C]-0.126587[/C][C]-1.0666[/C][C]0.144873[/C][/ROW]
[ROW][C]22[/C][C]-0.058286[/C][C]-0.4911[/C][C]0.312426[/C][/ROW]
[ROW][C]23[/C][C]-0.053523[/C][C]-0.451[/C][C]0.326685[/C][/ROW]
[ROW][C]24[/C][C]-0.062667[/C][C]-0.528[/C][C]0.29956[/C][/ROW]
[ROW][C]25[/C][C]-0.045364[/C][C]-0.3822[/C][C]0.351711[/C][/ROW]
[ROW][C]26[/C][C]-0.013503[/C][C]-0.1138[/C][C]0.454867[/C][/ROW]
[ROW][C]27[/C][C]-0.142538[/C][C]-1.201[/C][C]0.116862[/C][/ROW]
[ROW][C]28[/C][C]-0.033926[/C][C]-0.2859[/C][C]0.387907[/C][/ROW]
[ROW][C]29[/C][C]0.104541[/C][C]0.8809[/C][C]0.190677[/C][/ROW]
[ROW][C]30[/C][C]0.018626[/C][C]0.1569[/C][C]0.437867[/C][/ROW]
[ROW][C]31[/C][C]-0.128734[/C][C]-1.0847[/C][C]0.140855[/C][/ROW]
[ROW][C]32[/C][C]-0.054821[/C][C]-0.4619[/C][C]0.322772[/C][/ROW]
[ROW][C]33[/C][C]-0.112379[/C][C]-0.9469[/C][C]0.173446[/C][/ROW]
[ROW][C]34[/C][C]-0.051854[/C][C]-0.4369[/C][C]0.331745[/C][/ROW]
[ROW][C]35[/C][C]-0.041021[/C][C]-0.3456[/C][C]0.365315[/C][/ROW]
[ROW][C]36[/C][C]-0.000331[/C][C]-0.0028[/C][C]0.498891[/C][/ROW]
[ROW][C]37[/C][C]0.076296[/C][C]0.6429[/C][C]0.261186[/C][/ROW]
[ROW][C]38[/C][C]0.043891[/C][C]0.3698[/C][C]0.356304[/C][/ROW]
[ROW][C]39[/C][C]-0.026743[/C][C]-0.2253[/C][C]0.41118[/C][/ROW]
[ROW][C]40[/C][C]-0.002271[/C][C]-0.0191[/C][C]0.492393[/C][/ROW]
[ROW][C]41[/C][C]-0.000874[/C][C]-0.0074[/C][C]0.497074[/C][/ROW]
[ROW][C]42[/C][C]-0.008611[/C][C]-0.0726[/C][C]0.47118[/C][/ROW]
[ROW][C]43[/C][C]-0.004859[/C][C]-0.0409[/C][C]0.483729[/C][/ROW]
[ROW][C]44[/C][C]0.033644[/C][C]0.2835[/C][C]0.388813[/C][/ROW]
[ROW][C]45[/C][C]-0.181905[/C][C]-1.5328[/C][C]0.06489[/C][/ROW]
[ROW][C]46[/C][C]-0.031274[/C][C]-0.2635[/C][C]0.396455[/C][/ROW]
[ROW][C]47[/C][C]-0.025616[/C][C]-0.2158[/C][C]0.414863[/C][/ROW]
[ROW][C]48[/C][C]0.040715[/C][C]0.3431[/C][C]0.366279[/C][/ROW]
[/TABLE]
Source: https://freestatistics.org/blog/index.php?pk=&T=2

Globally Unique Identifier (entire table): ba.freestatistics.org/blog/index.php?pk=&T=2

As an alternative you can also use a QR Code:  

The GUIDs for individual cells are displayed in the table below:

Partial Autocorrelation Function
Time lag kPACF(k)T-STATP-value
10.5289394.45691.5e-05
2-0.188186-1.58570.058627
3-0.030276-0.25510.399686
40.100670.84830.199571
5-0.03555-0.29960.382696
60.0834640.70330.242089
70.0616650.51960.30248
80.054010.45510.325215
90.0562280.47380.318554
100.1622171.36690.08799
110.267322.25250.013692
120.0109310.09210.463436
13-0.021058-0.17740.429835
140.011460.09660.461674
150.0810430.68290.248453
16-0.04068-0.34280.366391
17-0.034557-0.29120.38588
18-0.097371-0.82050.20735
190.0587560.49510.311034
200.0932550.78580.217305
21-0.126587-1.06660.144873
22-0.058286-0.49110.312426
23-0.053523-0.4510.326685
24-0.062667-0.5280.29956
25-0.045364-0.38220.351711
26-0.013503-0.11380.454867
27-0.142538-1.2010.116862
28-0.033926-0.28590.387907
290.1045410.88090.190677
300.0186260.15690.437867
31-0.128734-1.08470.140855
32-0.054821-0.46190.322772
33-0.112379-0.94690.173446
34-0.051854-0.43690.331745
35-0.041021-0.34560.365315
36-0.000331-0.00280.498891
370.0762960.64290.261186
380.0438910.36980.356304
39-0.026743-0.22530.41118
40-0.002271-0.01910.492393
41-0.000874-0.00740.497074
42-0.008611-0.07260.47118
43-0.004859-0.04090.483729
440.0336440.28350.388813
45-0.181905-1.53280.06489
46-0.031274-0.26350.396455
47-0.025616-0.21580.414863
480.0407150.34310.366279


Parameters (Session):
par1 = 48 ; par2 = 1 ; par3 = 1 ; par4 = 0 ; par5 = 12 ; par6 = White Noise ; par7 = 0.95 ;
Parameters (R input):
par1 = 48 ; par2 = 1 ; par3 = 1 ; par4 = 0 ; par5 = 12 ; par6 = White Noise ; par7 = 0.95 ; par8 = ;
R code (references can be found in the software module):
par8 <- ''
par7 <- '0.95'
par6 <- 'White Noise'
par5 <- '12'
par4 <- '0'
par3 <- '0'
par2 <- '1'
par1 <- '48'
if (par1 == 'Default') {
par1 = 10*log10(length(x))
} else {
par1 <- as.numeric(par1)
}
par2 <- as.numeric(par2)
par3 <- as.numeric(par3)
par4 <- as.numeric(par4)
par5 <- as.numeric(par5)
if (par6 == 'White Noise') par6 <- 'white' else par6 <- 'ma'
par7 <- as.numeric(par7)
if (par8 != '') par8 <- as.numeric(par8)
x <- na.omit(x)
ox <- x
if (par8 == '') {
if (par2 == 0) {
x <- log(x)
} else {
x <- (x ^ par2 - 1) / par2
}
} else {
x <- log(x,base=par8)
}
if (par3 > 0) x <- diff(x,lag=1,difference=par3)
if (par4 > 0) x <- diff(x,lag=par5,difference=par4)
bitmap(file='picts.png')
op <- par(mfrow=c(2,1))
plot(ox,type='l',main='Original Time Series',xlab='time',ylab='value')
if (par8=='') {
mytitle <- paste('Working Time Series (lambda=',par2,', d=',par3,', D=',par4,')',sep='')
mysub <- paste('(lambda=',par2,', d=',par3,', D=',par4,', CI=', par7, ', CI type=',par6,')',sep='')
} else {
mytitle <- paste('Working Time Series (base=',par8,', d=',par3,', D=',par4,')',sep='')
mysub <- paste('(base=',par8,', d=',par3,', D=',par4,', CI=', par7, ', CI type=',par6,')',sep='')
}
plot(x,type='l', main=mytitle,xlab='time',ylab='value')
par(op)
dev.off()
bitmap(file='pic1.png')
racf <- acf(x, par1, main='Autocorrelation', xlab='time lag', ylab='ACF', ci.type=par6, ci=par7, sub=mysub)
dev.off()
bitmap(file='pic2.png')
rpacf <- pacf(x,par1,main='Partial Autocorrelation',xlab='lags',ylab='PACF',sub=mysub)
dev.off()
(myacf <- c(racf$acf))
(mypacf <- c(rpacf$acf))
lengthx <- length(x)
sqrtn <- sqrt(lengthx)
load(file='createtable')
a<-table.start()
a<-table.row.start(a)
a<-table.element(a,'Autocorrelation Function',4,TRUE)
a<-table.row.end(a)
a<-table.row.start(a)
a<-table.element(a,'Time lag k',header=TRUE)
a<-table.element(a,hyperlink('basics.htm','ACF(k)','click here for more information about the Autocorrelation Function'),header=TRUE)
a<-table.element(a,'T-STAT',header=TRUE)
a<-table.element(a,'P-value',header=TRUE)
a<-table.row.end(a)
for (i in 2:(par1+1)) {
a<-table.row.start(a)
a<-table.element(a,i-1,header=TRUE)
a<-table.element(a,round(myacf[i],6))
mytstat <- myacf[i]*sqrtn
a<-table.element(a,round(mytstat,4))
a<-table.element(a,round(1-pt(abs(mytstat),lengthx),6))
a<-table.row.end(a)
}
a<-table.end(a)
table.save(a,file='mytable.tab')
a<-table.start()
a<-table.row.start(a)
a<-table.element(a,'Partial Autocorrelation Function',4,TRUE)
a<-table.row.end(a)
a<-table.row.start(a)
a<-table.element(a,'Time lag k',header=TRUE)
a<-table.element(a,hyperlink('basics.htm','PACF(k)','click here for more information about the Partial Autocorrelation Function'),header=TRUE)
a<-table.element(a,'T-STAT',header=TRUE)
a<-table.element(a,'P-value',header=TRUE)
a<-table.row.end(a)
for (i in 1:par1) {
a<-table.row.start(a)
a<-table.element(a,i,header=TRUE)
a<-table.element(a,round(mypacf[i],6))
mytstat <- mypacf[i]*sqrtn
a<-table.element(a,round(mytstat,4))
a<-table.element(a,round(1-pt(abs(mytstat),lengthx),6))
a<-table.row.end(a)
}
a<-table.end(a)
table.save(a,file='mytable1.tab')