Free Statistics

of Irreproducible Research!

Author's title

Author*Unverified author*
R Software Modulerwasp_autocorrelation.wasp
Title produced by software(Partial) Autocorrelation Function
Date of computationSun, 19 Mar 2017 15:25:42 +0000
Cite this page as followsStatistical Computations at FreeStatistics.org, Office for Research Development and Education, URL https://freestatistics.org/blog/index.php?v=date/2017/Mar/19/t1489937168ocbnpfmduu30uk8.htm/, Retrieved Wed, 15 May 2024 02:49:06 +0200
Statistical Computations at FreeStatistics.org, Office for Research Development and Education, URL https://freestatistics.org/blog/index.php?pk=, Retrieved Wed, 15 May 2024 02:49:06 +0200
QR Codes:

Original text written by user:
IsPrivate?No (this computation is public)
User-defined keywords
Estimated Impact0
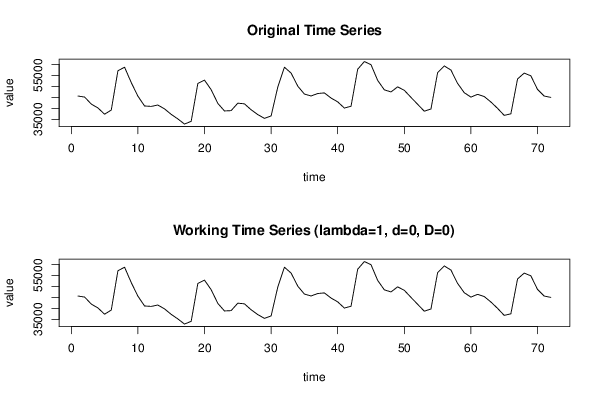
Dataseries X:
45570
45118
41921
40167
37315
39206
57075
58664
51705
45527
41057
40867
41484
39738
37254
35177
32846
34079
51287
52800
48443
42223
38796
38952
42343
42023
39340
37149
35431
36537
49626
58677
56009
50069
46470
45603
46729
46989
44666
42920
40125
40941
57748
61246
59809
52682
48394
47436
49750
48172
44960
41831
38672
39704
56207
59254
57374
51309
47083
45092
46353
45348
42867
39980
36790
37504
53331
55997
54764
48590
45565
44959


Summary of computational transaction
Raw Inputview raw input (R code)
Raw Outputview raw output of R engine
Computing time1 seconds
R Server'Gertrude Mary Cox' @ cox.wessa.net

\begin{tabular}{lllllllll}
\hline
Summary of computational transaction \tabularnewline
Raw Input & view raw input (R code)  \tabularnewline
Raw Output & view raw output of R engine  \tabularnewline
Computing time & 1 seconds \tabularnewline
R Server & 'Gertrude Mary Cox' @ cox.wessa.net \tabularnewline
\hline
\end{tabular}
%Source: https://freestatistics.org/blog/index.php?pk=&T=0

[TABLE]
[ROW][C]Summary of computational transaction[/C][/ROW]
[ROW][C]Raw Input[/C][C]view raw input (R code) [/C][/ROW]
[ROW][C]Raw Output[/C][C]view raw output of R engine [/C][/ROW]
[ROW][C]Computing time[/C][C]1 seconds[/C][/ROW]
[ROW][C]R Server[/C][C]'Gertrude Mary Cox' @ cox.wessa.net[/C][/ROW]
[/TABLE]
Source: https://freestatistics.org/blog/index.php?pk=&T=0

Globally Unique Identifier (entire table): ba.freestatistics.org/blog/index.php?pk=&T=0

As an alternative you can also use a QR Code:  

The GUIDs for individual cells are displayed in the table below:

Summary of computational transaction
Raw Inputview raw input (R code)
Raw Outputview raw output of R engine
Computing time1 seconds
R Server'Gertrude Mary Cox' @ cox.wessa.net


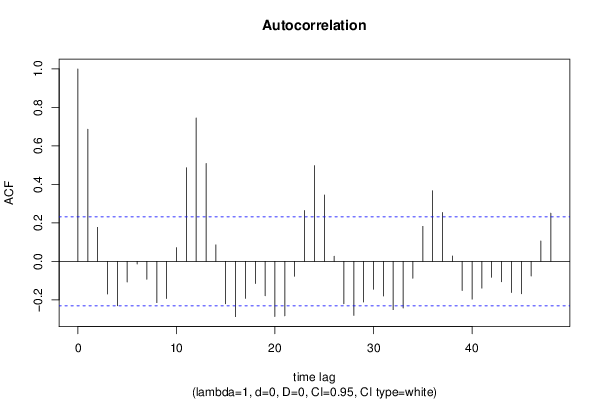
Autocorrelation Function
Time lag kACF(k)T-STATP-value
10.6867865.82760
20.1769051.50110.068852
3-0.169728-1.44020.077075
4-0.230167-1.9530.027351
5-0.107426-0.91150.182526
6-0.013648-0.11580.454063
7-0.092831-0.78770.216729
8-0.214241-1.81790.03662
9-0.192673-1.63490.05322
100.0716280.60780.272621
110.4864434.12764.9e-05
120.7449886.32140
130.5087784.31712.5e-05
140.0858010.7280.234473
15-0.220468-1.87070.032723
16-0.287136-2.43640.008654
17-0.192075-1.62980.053754
18-0.114848-0.97450.166532
19-0.178171-1.51180.067477
20-0.286031-2.42710.008863
21-0.282983-2.40120.009463
22-0.077379-0.65660.25677
230.2646352.24550.013903
240.4975854.22213.5e-05
250.3448612.92620.002294
260.0269260.22850.409964
27-0.219844-1.86540.033097
28-0.28048-2.380.009983
29-0.21109-1.79120.038735
30-0.145-1.23040.111282
31-0.17998-1.52720.065548
32-0.250618-2.12660.018442
33-0.242543-2.0580.021603
34-0.08778-0.74480.229398
350.1821911.54590.063251
360.3667193.11170.001333
370.2542292.15720.017164
380.0277590.23550.407229
39-0.151338-1.28410.101604
40-0.196054-1.66360.050272
41-0.13896-1.17910.121117
42-0.082287-0.69820.243641
43-0.10553-0.89550.186764
44-0.161346-1.36910.087618
45-0.168451-1.42940.078614
46-0.076037-0.64520.260427
470.1056350.89630.186529
480.2506822.12710.018419

\begin{tabular}{lllllllll}
\hline
Autocorrelation Function \tabularnewline
Time lag k & ACF(k) & T-STAT & P-value \tabularnewline
1 & 0.686786 & 5.8276 & 0 \tabularnewline
2 & 0.176905 & 1.5011 & 0.068852 \tabularnewline
3 & -0.169728 & -1.4402 & 0.077075 \tabularnewline
4 & -0.230167 & -1.953 & 0.027351 \tabularnewline
5 & -0.107426 & -0.9115 & 0.182526 \tabularnewline
6 & -0.013648 & -0.1158 & 0.454063 \tabularnewline
7 & -0.092831 & -0.7877 & 0.216729 \tabularnewline
8 & -0.214241 & -1.8179 & 0.03662 \tabularnewline
9 & -0.192673 & -1.6349 & 0.05322 \tabularnewline
10 & 0.071628 & 0.6078 & 0.272621 \tabularnewline
11 & 0.486443 & 4.1276 & 4.9e-05 \tabularnewline
12 & 0.744988 & 6.3214 & 0 \tabularnewline
13 & 0.508778 & 4.3171 & 2.5e-05 \tabularnewline
14 & 0.085801 & 0.728 & 0.234473 \tabularnewline
15 & -0.220468 & -1.8707 & 0.032723 \tabularnewline
16 & -0.287136 & -2.4364 & 0.008654 \tabularnewline
17 & -0.192075 & -1.6298 & 0.053754 \tabularnewline
18 & -0.114848 & -0.9745 & 0.166532 \tabularnewline
19 & -0.178171 & -1.5118 & 0.067477 \tabularnewline
20 & -0.286031 & -2.4271 & 0.008863 \tabularnewline
21 & -0.282983 & -2.4012 & 0.009463 \tabularnewline
22 & -0.077379 & -0.6566 & 0.25677 \tabularnewline
23 & 0.264635 & 2.2455 & 0.013903 \tabularnewline
24 & 0.497585 & 4.2221 & 3.5e-05 \tabularnewline
25 & 0.344861 & 2.9262 & 0.002294 \tabularnewline
26 & 0.026926 & 0.2285 & 0.409964 \tabularnewline
27 & -0.219844 & -1.8654 & 0.033097 \tabularnewline
28 & -0.28048 & -2.38 & 0.009983 \tabularnewline
29 & -0.21109 & -1.7912 & 0.038735 \tabularnewline
30 & -0.145 & -1.2304 & 0.111282 \tabularnewline
31 & -0.17998 & -1.5272 & 0.065548 \tabularnewline
32 & -0.250618 & -2.1266 & 0.018442 \tabularnewline
33 & -0.242543 & -2.058 & 0.021603 \tabularnewline
34 & -0.08778 & -0.7448 & 0.229398 \tabularnewline
35 & 0.182191 & 1.5459 & 0.063251 \tabularnewline
36 & 0.366719 & 3.1117 & 0.001333 \tabularnewline
37 & 0.254229 & 2.1572 & 0.017164 \tabularnewline
38 & 0.027759 & 0.2355 & 0.407229 \tabularnewline
39 & -0.151338 & -1.2841 & 0.101604 \tabularnewline
40 & -0.196054 & -1.6636 & 0.050272 \tabularnewline
41 & -0.13896 & -1.1791 & 0.121117 \tabularnewline
42 & -0.082287 & -0.6982 & 0.243641 \tabularnewline
43 & -0.10553 & -0.8955 & 0.186764 \tabularnewline
44 & -0.161346 & -1.3691 & 0.087618 \tabularnewline
45 & -0.168451 & -1.4294 & 0.078614 \tabularnewline
46 & -0.076037 & -0.6452 & 0.260427 \tabularnewline
47 & 0.105635 & 0.8963 & 0.186529 \tabularnewline
48 & 0.250682 & 2.1271 & 0.018419 \tabularnewline
\hline
\end{tabular}
%Source: https://freestatistics.org/blog/index.php?pk=&T=1

[TABLE]
[ROW][C]Autocorrelation Function[/C][/ROW]
[ROW][C]Time lag k[/C][C]ACF(k)[/C][C]T-STAT[/C][C]P-value[/C][/ROW]
[ROW][C]1[/C][C]0.686786[/C][C]5.8276[/C][C]0[/C][/ROW]
[ROW][C]2[/C][C]0.176905[/C][C]1.5011[/C][C]0.068852[/C][/ROW]
[ROW][C]3[/C][C]-0.169728[/C][C]-1.4402[/C][C]0.077075[/C][/ROW]
[ROW][C]4[/C][C]-0.230167[/C][C]-1.953[/C][C]0.027351[/C][/ROW]
[ROW][C]5[/C][C]-0.107426[/C][C]-0.9115[/C][C]0.182526[/C][/ROW]
[ROW][C]6[/C][C]-0.013648[/C][C]-0.1158[/C][C]0.454063[/C][/ROW]
[ROW][C]7[/C][C]-0.092831[/C][C]-0.7877[/C][C]0.216729[/C][/ROW]
[ROW][C]8[/C][C]-0.214241[/C][C]-1.8179[/C][C]0.03662[/C][/ROW]
[ROW][C]9[/C][C]-0.192673[/C][C]-1.6349[/C][C]0.05322[/C][/ROW]
[ROW][C]10[/C][C]0.071628[/C][C]0.6078[/C][C]0.272621[/C][/ROW]
[ROW][C]11[/C][C]0.486443[/C][C]4.1276[/C][C]4.9e-05[/C][/ROW]
[ROW][C]12[/C][C]0.744988[/C][C]6.3214[/C][C]0[/C][/ROW]
[ROW][C]13[/C][C]0.508778[/C][C]4.3171[/C][C]2.5e-05[/C][/ROW]
[ROW][C]14[/C][C]0.085801[/C][C]0.728[/C][C]0.234473[/C][/ROW]
[ROW][C]15[/C][C]-0.220468[/C][C]-1.8707[/C][C]0.032723[/C][/ROW]
[ROW][C]16[/C][C]-0.287136[/C][C]-2.4364[/C][C]0.008654[/C][/ROW]
[ROW][C]17[/C][C]-0.192075[/C][C]-1.6298[/C][C]0.053754[/C][/ROW]
[ROW][C]18[/C][C]-0.114848[/C][C]-0.9745[/C][C]0.166532[/C][/ROW]
[ROW][C]19[/C][C]-0.178171[/C][C]-1.5118[/C][C]0.067477[/C][/ROW]
[ROW][C]20[/C][C]-0.286031[/C][C]-2.4271[/C][C]0.008863[/C][/ROW]
[ROW][C]21[/C][C]-0.282983[/C][C]-2.4012[/C][C]0.009463[/C][/ROW]
[ROW][C]22[/C][C]-0.077379[/C][C]-0.6566[/C][C]0.25677[/C][/ROW]
[ROW][C]23[/C][C]0.264635[/C][C]2.2455[/C][C]0.013903[/C][/ROW]
[ROW][C]24[/C][C]0.497585[/C][C]4.2221[/C][C]3.5e-05[/C][/ROW]
[ROW][C]25[/C][C]0.344861[/C][C]2.9262[/C][C]0.002294[/C][/ROW]
[ROW][C]26[/C][C]0.026926[/C][C]0.2285[/C][C]0.409964[/C][/ROW]
[ROW][C]27[/C][C]-0.219844[/C][C]-1.8654[/C][C]0.033097[/C][/ROW]
[ROW][C]28[/C][C]-0.28048[/C][C]-2.38[/C][C]0.009983[/C][/ROW]
[ROW][C]29[/C][C]-0.21109[/C][C]-1.7912[/C][C]0.038735[/C][/ROW]
[ROW][C]30[/C][C]-0.145[/C][C]-1.2304[/C][C]0.111282[/C][/ROW]
[ROW][C]31[/C][C]-0.17998[/C][C]-1.5272[/C][C]0.065548[/C][/ROW]
[ROW][C]32[/C][C]-0.250618[/C][C]-2.1266[/C][C]0.018442[/C][/ROW]
[ROW][C]33[/C][C]-0.242543[/C][C]-2.058[/C][C]0.021603[/C][/ROW]
[ROW][C]34[/C][C]-0.08778[/C][C]-0.7448[/C][C]0.229398[/C][/ROW]
[ROW][C]35[/C][C]0.182191[/C][C]1.5459[/C][C]0.063251[/C][/ROW]
[ROW][C]36[/C][C]0.366719[/C][C]3.1117[/C][C]0.001333[/C][/ROW]
[ROW][C]37[/C][C]0.254229[/C][C]2.1572[/C][C]0.017164[/C][/ROW]
[ROW][C]38[/C][C]0.027759[/C][C]0.2355[/C][C]0.407229[/C][/ROW]
[ROW][C]39[/C][C]-0.151338[/C][C]-1.2841[/C][C]0.101604[/C][/ROW]
[ROW][C]40[/C][C]-0.196054[/C][C]-1.6636[/C][C]0.050272[/C][/ROW]
[ROW][C]41[/C][C]-0.13896[/C][C]-1.1791[/C][C]0.121117[/C][/ROW]
[ROW][C]42[/C][C]-0.082287[/C][C]-0.6982[/C][C]0.243641[/C][/ROW]
[ROW][C]43[/C][C]-0.10553[/C][C]-0.8955[/C][C]0.186764[/C][/ROW]
[ROW][C]44[/C][C]-0.161346[/C][C]-1.3691[/C][C]0.087618[/C][/ROW]
[ROW][C]45[/C][C]-0.168451[/C][C]-1.4294[/C][C]0.078614[/C][/ROW]
[ROW][C]46[/C][C]-0.076037[/C][C]-0.6452[/C][C]0.260427[/C][/ROW]
[ROW][C]47[/C][C]0.105635[/C][C]0.8963[/C][C]0.186529[/C][/ROW]
[ROW][C]48[/C][C]0.250682[/C][C]2.1271[/C][C]0.018419[/C][/ROW]
[/TABLE]
Source: https://freestatistics.org/blog/index.php?pk=&T=1

Globally Unique Identifier (entire table): ba.freestatistics.org/blog/index.php?pk=&T=1

As an alternative you can also use a QR Code:  

The GUIDs for individual cells are displayed in the table below:

Autocorrelation Function
Time lag kACF(k)T-STATP-value
10.6867865.82760
20.1769051.50110.068852
3-0.169728-1.44020.077075
4-0.230167-1.9530.027351
5-0.107426-0.91150.182526
6-0.013648-0.11580.454063
7-0.092831-0.78770.216729
8-0.214241-1.81790.03662
9-0.192673-1.63490.05322
100.0716280.60780.272621
110.4864434.12764.9e-05
120.7449886.32140
130.5087784.31712.5e-05
140.0858010.7280.234473
15-0.220468-1.87070.032723
16-0.287136-2.43640.008654
17-0.192075-1.62980.053754
18-0.114848-0.97450.166532
19-0.178171-1.51180.067477
20-0.286031-2.42710.008863
21-0.282983-2.40120.009463
22-0.077379-0.65660.25677
230.2646352.24550.013903
240.4975854.22213.5e-05
250.3448612.92620.002294
260.0269260.22850.409964
27-0.219844-1.86540.033097
28-0.28048-2.380.009983
29-0.21109-1.79120.038735
30-0.145-1.23040.111282
31-0.17998-1.52720.065548
32-0.250618-2.12660.018442
33-0.242543-2.0580.021603
34-0.08778-0.74480.229398
350.1821911.54590.063251
360.3667193.11170.001333
370.2542292.15720.017164
380.0277590.23550.407229
39-0.151338-1.28410.101604
40-0.196054-1.66360.050272
41-0.13896-1.17910.121117
42-0.082287-0.69820.243641
43-0.10553-0.89550.186764
44-0.161346-1.36910.087618
45-0.168451-1.42940.078614
46-0.076037-0.64520.260427
470.1056350.89630.186529
480.2506822.12710.018419


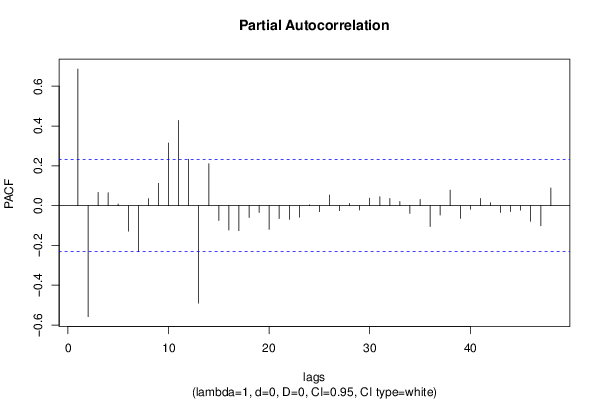
Partial Autocorrelation Function
Time lag kPACF(k)T-STATP-value
10.6867865.82760
2-0.557931-4.73425e-06
30.0664240.56360.287381
40.0645410.54770.292812
50.0085430.07250.471206
6-0.128311-1.08880.139947
7-0.231364-1.96320.026744
80.0352380.2990.382899
90.1120550.95080.172438
100.3144632.66830.004706
110.4273683.62630.000267
120.232741.97490.02606
13-0.489903-4.1574.4e-05
140.2101151.78290.03941
15-0.074993-0.63630.263286
16-0.122909-1.04290.150237
17-0.125642-1.06610.144968
18-0.059733-0.50690.306903
19-0.034223-0.29040.386177
20-0.119243-1.01180.157509
21-0.065076-0.55220.291264
22-0.069064-0.5860.279844
23-0.057712-0.48970.312916
240.0038940.0330.486868
25-0.030386-0.25780.398634
260.0531370.45090.326715
27-0.02524-0.21420.415512
280.0106030.090.46428
29-0.022038-0.1870.426095
300.0375450.31860.375484
310.0443330.37620.353945
320.0358410.30410.380957
330.0208460.17690.430048
34-0.039143-0.33210.370373
350.0312330.2650.395877
36-0.105287-0.89340.187312
37-0.047093-0.39960.345318
380.0780860.66260.254857
39-0.064274-0.54540.293588
40-0.018341-0.15560.43838
410.0360240.30570.380367
420.0147590.12520.450344
43-0.03481-0.29540.384278
44-0.02932-0.24880.402117
45-0.022696-0.19260.423916
46-0.078609-0.6670.253447
47-0.101487-0.86110.196007
480.0887270.75290.226991

\begin{tabular}{lllllllll}
\hline
Partial Autocorrelation Function \tabularnewline
Time lag k & PACF(k) & T-STAT & P-value \tabularnewline
1 & 0.686786 & 5.8276 & 0 \tabularnewline
2 & -0.557931 & -4.7342 & 5e-06 \tabularnewline
3 & 0.066424 & 0.5636 & 0.287381 \tabularnewline
4 & 0.064541 & 0.5477 & 0.292812 \tabularnewline
5 & 0.008543 & 0.0725 & 0.471206 \tabularnewline
6 & -0.128311 & -1.0888 & 0.139947 \tabularnewline
7 & -0.231364 & -1.9632 & 0.026744 \tabularnewline
8 & 0.035238 & 0.299 & 0.382899 \tabularnewline
9 & 0.112055 & 0.9508 & 0.172438 \tabularnewline
10 & 0.314463 & 2.6683 & 0.004706 \tabularnewline
11 & 0.427368 & 3.6263 & 0.000267 \tabularnewline
12 & 0.23274 & 1.9749 & 0.02606 \tabularnewline
13 & -0.489903 & -4.157 & 4.4e-05 \tabularnewline
14 & 0.210115 & 1.7829 & 0.03941 \tabularnewline
15 & -0.074993 & -0.6363 & 0.263286 \tabularnewline
16 & -0.122909 & -1.0429 & 0.150237 \tabularnewline
17 & -0.125642 & -1.0661 & 0.144968 \tabularnewline
18 & -0.059733 & -0.5069 & 0.306903 \tabularnewline
19 & -0.034223 & -0.2904 & 0.386177 \tabularnewline
20 & -0.119243 & -1.0118 & 0.157509 \tabularnewline
21 & -0.065076 & -0.5522 & 0.291264 \tabularnewline
22 & -0.069064 & -0.586 & 0.279844 \tabularnewline
23 & -0.057712 & -0.4897 & 0.312916 \tabularnewline
24 & 0.003894 & 0.033 & 0.486868 \tabularnewline
25 & -0.030386 & -0.2578 & 0.398634 \tabularnewline
26 & 0.053137 & 0.4509 & 0.326715 \tabularnewline
27 & -0.02524 & -0.2142 & 0.415512 \tabularnewline
28 & 0.010603 & 0.09 & 0.46428 \tabularnewline
29 & -0.022038 & -0.187 & 0.426095 \tabularnewline
30 & 0.037545 & 0.3186 & 0.375484 \tabularnewline
31 & 0.044333 & 0.3762 & 0.353945 \tabularnewline
32 & 0.035841 & 0.3041 & 0.380957 \tabularnewline
33 & 0.020846 & 0.1769 & 0.430048 \tabularnewline
34 & -0.039143 & -0.3321 & 0.370373 \tabularnewline
35 & 0.031233 & 0.265 & 0.395877 \tabularnewline
36 & -0.105287 & -0.8934 & 0.187312 \tabularnewline
37 & -0.047093 & -0.3996 & 0.345318 \tabularnewline
38 & 0.078086 & 0.6626 & 0.254857 \tabularnewline
39 & -0.064274 & -0.5454 & 0.293588 \tabularnewline
40 & -0.018341 & -0.1556 & 0.43838 \tabularnewline
41 & 0.036024 & 0.3057 & 0.380367 \tabularnewline
42 & 0.014759 & 0.1252 & 0.450344 \tabularnewline
43 & -0.03481 & -0.2954 & 0.384278 \tabularnewline
44 & -0.02932 & -0.2488 & 0.402117 \tabularnewline
45 & -0.022696 & -0.1926 & 0.423916 \tabularnewline
46 & -0.078609 & -0.667 & 0.253447 \tabularnewline
47 & -0.101487 & -0.8611 & 0.196007 \tabularnewline
48 & 0.088727 & 0.7529 & 0.226991 \tabularnewline
\hline
\end{tabular}
%Source: https://freestatistics.org/blog/index.php?pk=&T=2

[TABLE]
[ROW][C]Partial Autocorrelation Function[/C][/ROW]
[ROW][C]Time lag k[/C][C]PACF(k)[/C][C]T-STAT[/C][C]P-value[/C][/ROW]
[ROW][C]1[/C][C]0.686786[/C][C]5.8276[/C][C]0[/C][/ROW]
[ROW][C]2[/C][C]-0.557931[/C][C]-4.7342[/C][C]5e-06[/C][/ROW]
[ROW][C]3[/C][C]0.066424[/C][C]0.5636[/C][C]0.287381[/C][/ROW]
[ROW][C]4[/C][C]0.064541[/C][C]0.5477[/C][C]0.292812[/C][/ROW]
[ROW][C]5[/C][C]0.008543[/C][C]0.0725[/C][C]0.471206[/C][/ROW]
[ROW][C]6[/C][C]-0.128311[/C][C]-1.0888[/C][C]0.139947[/C][/ROW]
[ROW][C]7[/C][C]-0.231364[/C][C]-1.9632[/C][C]0.026744[/C][/ROW]
[ROW][C]8[/C][C]0.035238[/C][C]0.299[/C][C]0.382899[/C][/ROW]
[ROW][C]9[/C][C]0.112055[/C][C]0.9508[/C][C]0.172438[/C][/ROW]
[ROW][C]10[/C][C]0.314463[/C][C]2.6683[/C][C]0.004706[/C][/ROW]
[ROW][C]11[/C][C]0.427368[/C][C]3.6263[/C][C]0.000267[/C][/ROW]
[ROW][C]12[/C][C]0.23274[/C][C]1.9749[/C][C]0.02606[/C][/ROW]
[ROW][C]13[/C][C]-0.489903[/C][C]-4.157[/C][C]4.4e-05[/C][/ROW]
[ROW][C]14[/C][C]0.210115[/C][C]1.7829[/C][C]0.03941[/C][/ROW]
[ROW][C]15[/C][C]-0.074993[/C][C]-0.6363[/C][C]0.263286[/C][/ROW]
[ROW][C]16[/C][C]-0.122909[/C][C]-1.0429[/C][C]0.150237[/C][/ROW]
[ROW][C]17[/C][C]-0.125642[/C][C]-1.0661[/C][C]0.144968[/C][/ROW]
[ROW][C]18[/C][C]-0.059733[/C][C]-0.5069[/C][C]0.306903[/C][/ROW]
[ROW][C]19[/C][C]-0.034223[/C][C]-0.2904[/C][C]0.386177[/C][/ROW]
[ROW][C]20[/C][C]-0.119243[/C][C]-1.0118[/C][C]0.157509[/C][/ROW]
[ROW][C]21[/C][C]-0.065076[/C][C]-0.5522[/C][C]0.291264[/C][/ROW]
[ROW][C]22[/C][C]-0.069064[/C][C]-0.586[/C][C]0.279844[/C][/ROW]
[ROW][C]23[/C][C]-0.057712[/C][C]-0.4897[/C][C]0.312916[/C][/ROW]
[ROW][C]24[/C][C]0.003894[/C][C]0.033[/C][C]0.486868[/C][/ROW]
[ROW][C]25[/C][C]-0.030386[/C][C]-0.2578[/C][C]0.398634[/C][/ROW]
[ROW][C]26[/C][C]0.053137[/C][C]0.4509[/C][C]0.326715[/C][/ROW]
[ROW][C]27[/C][C]-0.02524[/C][C]-0.2142[/C][C]0.415512[/C][/ROW]
[ROW][C]28[/C][C]0.010603[/C][C]0.09[/C][C]0.46428[/C][/ROW]
[ROW][C]29[/C][C]-0.022038[/C][C]-0.187[/C][C]0.426095[/C][/ROW]
[ROW][C]30[/C][C]0.037545[/C][C]0.3186[/C][C]0.375484[/C][/ROW]
[ROW][C]31[/C][C]0.044333[/C][C]0.3762[/C][C]0.353945[/C][/ROW]
[ROW][C]32[/C][C]0.035841[/C][C]0.3041[/C][C]0.380957[/C][/ROW]
[ROW][C]33[/C][C]0.020846[/C][C]0.1769[/C][C]0.430048[/C][/ROW]
[ROW][C]34[/C][C]-0.039143[/C][C]-0.3321[/C][C]0.370373[/C][/ROW]
[ROW][C]35[/C][C]0.031233[/C][C]0.265[/C][C]0.395877[/C][/ROW]
[ROW][C]36[/C][C]-0.105287[/C][C]-0.8934[/C][C]0.187312[/C][/ROW]
[ROW][C]37[/C][C]-0.047093[/C][C]-0.3996[/C][C]0.345318[/C][/ROW]
[ROW][C]38[/C][C]0.078086[/C][C]0.6626[/C][C]0.254857[/C][/ROW]
[ROW][C]39[/C][C]-0.064274[/C][C]-0.5454[/C][C]0.293588[/C][/ROW]
[ROW][C]40[/C][C]-0.018341[/C][C]-0.1556[/C][C]0.43838[/C][/ROW]
[ROW][C]41[/C][C]0.036024[/C][C]0.3057[/C][C]0.380367[/C][/ROW]
[ROW][C]42[/C][C]0.014759[/C][C]0.1252[/C][C]0.450344[/C][/ROW]
[ROW][C]43[/C][C]-0.03481[/C][C]-0.2954[/C][C]0.384278[/C][/ROW]
[ROW][C]44[/C][C]-0.02932[/C][C]-0.2488[/C][C]0.402117[/C][/ROW]
[ROW][C]45[/C][C]-0.022696[/C][C]-0.1926[/C][C]0.423916[/C][/ROW]
[ROW][C]46[/C][C]-0.078609[/C][C]-0.667[/C][C]0.253447[/C][/ROW]
[ROW][C]47[/C][C]-0.101487[/C][C]-0.8611[/C][C]0.196007[/C][/ROW]
[ROW][C]48[/C][C]0.088727[/C][C]0.7529[/C][C]0.226991[/C][/ROW]
[/TABLE]
Source: https://freestatistics.org/blog/index.php?pk=&T=2

Globally Unique Identifier (entire table): ba.freestatistics.org/blog/index.php?pk=&T=2

As an alternative you can also use a QR Code:  

The GUIDs for individual cells are displayed in the table below:

Partial Autocorrelation Function
Time lag kPACF(k)T-STATP-value
10.6867865.82760
2-0.557931-4.73425e-06
30.0664240.56360.287381
40.0645410.54770.292812
50.0085430.07250.471206
6-0.128311-1.08880.139947
7-0.231364-1.96320.026744
80.0352380.2990.382899
90.1120550.95080.172438
100.3144632.66830.004706
110.4273683.62630.000267
120.232741.97490.02606
13-0.489903-4.1574.4e-05
140.2101151.78290.03941
15-0.074993-0.63630.263286
16-0.122909-1.04290.150237
17-0.125642-1.06610.144968
18-0.059733-0.50690.306903
19-0.034223-0.29040.386177
20-0.119243-1.01180.157509
21-0.065076-0.55220.291264
22-0.069064-0.5860.279844
23-0.057712-0.48970.312916
240.0038940.0330.486868
25-0.030386-0.25780.398634
260.0531370.45090.326715
27-0.02524-0.21420.415512
280.0106030.090.46428
29-0.022038-0.1870.426095
300.0375450.31860.375484
310.0443330.37620.353945
320.0358410.30410.380957
330.0208460.17690.430048
34-0.039143-0.33210.370373
350.0312330.2650.395877
36-0.105287-0.89340.187312
37-0.047093-0.39960.345318
380.0780860.66260.254857
39-0.064274-0.54540.293588
40-0.018341-0.15560.43838
410.0360240.30570.380367
420.0147590.12520.450344
43-0.03481-0.29540.384278
44-0.02932-0.24880.402117
45-0.022696-0.19260.423916
46-0.078609-0.6670.253447
47-0.101487-0.86110.196007
480.0887270.75290.226991


Parameters (Session):
par1 = 48 ; par2 = 1 ; par3 = 0 ; par4 = 0 ; par5 = 12 ; par6 = White Noise ; par7 = 0.95 ;
Parameters (R input):
par1 = 48 ; par2 = 1 ; par3 = 0 ; par4 = 0 ; par5 = 12 ; par6 = White Noise ; par7 = 0.95 ; par8 = ;
R code (references can be found in the software module):
if (par1 == 'Default') {
par1 = 10*log10(length(x))
} else {
par1 <- as.numeric(par1)
}
par2 <- as.numeric(par2)
par3 <- as.numeric(par3)
par4 <- as.numeric(par4)
par5 <- as.numeric(par5)
if (par6 == 'White Noise') par6 <- 'white' else par6 <- 'ma'
par7 <- as.numeric(par7)
if (par8 != '') par8 <- as.numeric(par8)
x <- na.omit(x)
ox <- x
if (par8 == '') {
if (par2 == 0) {
x <- log(x)
} else {
x <- (x ^ par2 - 1) / par2
}
} else {
x <- log(x,base=par8)
}
if (par3 > 0) x <- diff(x,lag=1,difference=par3)
if (par4 > 0) x <- diff(x,lag=par5,difference=par4)
bitmap(file='picts.png')
op <- par(mfrow=c(2,1))
plot(ox,type='l',main='Original Time Series',xlab='time',ylab='value')
if (par8=='') {
mytitle <- paste('Working Time Series (lambda=',par2,', d=',par3,', D=',par4,')',sep='')
mysub <- paste('(lambda=',par2,', d=',par3,', D=',par4,', CI=', par7, ', CI type=',par6,')',sep='')
} else {
mytitle <- paste('Working Time Series (base=',par8,', d=',par3,', D=',par4,')',sep='')
mysub <- paste('(base=',par8,', d=',par3,', D=',par4,', CI=', par7, ', CI type=',par6,')',sep='')
}
plot(x,type='l', main=mytitle,xlab='time',ylab='value')
par(op)
dev.off()
bitmap(file='pic1.png')
racf <- acf(x, par1, main='Autocorrelation', xlab='time lag', ylab='ACF', ci.type=par6, ci=par7, sub=mysub)
dev.off()
bitmap(file='pic2.png')
rpacf <- pacf(x,par1,main='Partial Autocorrelation',xlab='lags',ylab='PACF',sub=mysub)
dev.off()
(myacf <- c(racf$acf))
(mypacf <- c(rpacf$acf))
lengthx <- length(x)
sqrtn <- sqrt(lengthx)
load(file='createtable')
a<-table.start()
a<-table.row.start(a)
a<-table.element(a,'Autocorrelation Function',4,TRUE)
a<-table.row.end(a)
a<-table.row.start(a)
a<-table.element(a,'Time lag k',header=TRUE)
a<-table.element(a,hyperlink('basics.htm','ACF(k)','click here for more information about the Autocorrelation Function'),header=TRUE)
a<-table.element(a,'T-STAT',header=TRUE)
a<-table.element(a,'P-value',header=TRUE)
a<-table.row.end(a)
for (i in 2:(par1+1)) {
a<-table.row.start(a)
a<-table.element(a,i-1,header=TRUE)
a<-table.element(a,round(myacf[i],6))
mytstat <- myacf[i]*sqrtn
a<-table.element(a,round(mytstat,4))
a<-table.element(a,round(1-pt(abs(mytstat),lengthx),6))
a<-table.row.end(a)
}
a<-table.end(a)
table.save(a,file='mytable.tab')
a<-table.start()
a<-table.row.start(a)
a<-table.element(a,'Partial Autocorrelation Function',4,TRUE)
a<-table.row.end(a)
a<-table.row.start(a)
a<-table.element(a,'Time lag k',header=TRUE)
a<-table.element(a,hyperlink('basics.htm','PACF(k)','click here for more information about the Partial Autocorrelation Function'),header=TRUE)
a<-table.element(a,'T-STAT',header=TRUE)
a<-table.element(a,'P-value',header=TRUE)
a<-table.row.end(a)
for (i in 1:par1) {
a<-table.row.start(a)
a<-table.element(a,i,header=TRUE)
a<-table.element(a,round(mypacf[i],6))
mytstat <- mypacf[i]*sqrtn
a<-table.element(a,round(mytstat,4))
a<-table.element(a,round(1-pt(abs(mytstat),lengthx),6))
a<-table.row.end(a)
}
a<-table.end(a)
table.save(a,file='mytable1.tab')