Free Statistics

of Irreproducible Research!

Author's title

Author*Unverified author*
R Software Modulerwasp_autocorrelation.wasp
Title produced by software(Partial) Autocorrelation Function
Date of computationSun, 19 Mar 2017 15:28:33 +0000
Cite this page as followsStatistical Computations at FreeStatistics.org, Office for Research Development and Education, URL https://freestatistics.org/blog/index.php?v=date/2017/Mar/19/t1489937338n1cowt15nndlrnh.htm/, Retrieved Thu, 16 May 2024 02:01:42 +0200
Statistical Computations at FreeStatistics.org, Office for Research Development and Education, URL https://freestatistics.org/blog/index.php?pk=, Retrieved Thu, 16 May 2024 02:01:42 +0200
QR Codes:

Original text written by user:
IsPrivate?No (this computation is public)
User-defined keywords
Estimated Impact0
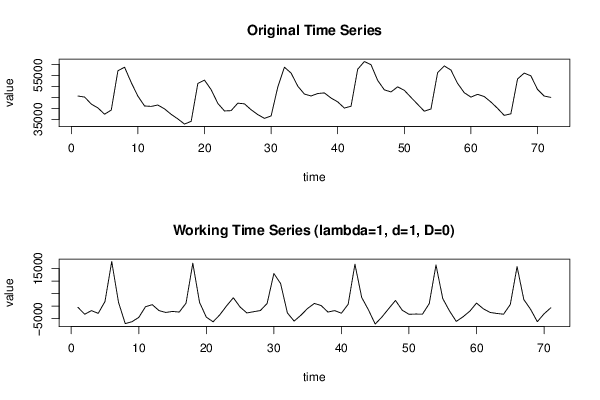
Dataseries X:
45570
45118
41921
40167
37315
39206
57075
58664
51705
45527
41057
40867
41484
39738
37254
35177
32846
34079
51287
52800
48443
42223
38796
38952
42343
42023
39340
37149
35431
36537
49626
58677
56009
50069
46470
45603
46729
46989
44666
42920
40125
40941
57748
61246
59809
52682
48394
47436
49750
48172
44960
41831
38672
39704
56207
59254
57374
51309
47083
45092
46353
45348
42867
39980
36790
37504
53331
55997
54764
48590
45565
44959


Summary of computational transaction
Raw Inputview raw input (R code)
Raw Outputview raw output of R engine
Computing time1 seconds
R Server'Sir Ronald Aylmer Fisher' @ fisher.wessa.net

\begin{tabular}{lllllllll}
\hline
Summary of computational transaction \tabularnewline
Raw Input & view raw input (R code)  \tabularnewline
Raw Output & view raw output of R engine  \tabularnewline
Computing time & 1 seconds \tabularnewline
R Server & 'Sir Ronald Aylmer Fisher' @ fisher.wessa.net \tabularnewline
\hline
\end{tabular}
%Source: https://freestatistics.org/blog/index.php?pk=&T=0

[TABLE]
[ROW][C]Summary of computational transaction[/C][/ROW]
[ROW][C]Raw Input[/C][C]view raw input (R code) [/C][/ROW]
[ROW][C]Raw Output[/C][C]view raw output of R engine [/C][/ROW]
[ROW][C]Computing time[/C][C]1 seconds[/C][/ROW]
[ROW][C]R Server[/C][C]'Sir Ronald Aylmer Fisher' @ fisher.wessa.net[/C][/ROW]
[/TABLE]
Source: https://freestatistics.org/blog/index.php?pk=&T=0

Globally Unique Identifier (entire table): ba.freestatistics.org/blog/index.php?pk=&T=0

As an alternative you can also use a QR Code:  

The GUIDs for individual cells are displayed in the table below:

Summary of computational transaction
Raw Inputview raw input (R code)
Raw Outputview raw output of R engine
Computing time1 seconds
R Server'Sir Ronald Aylmer Fisher' @ fisher.wessa.net


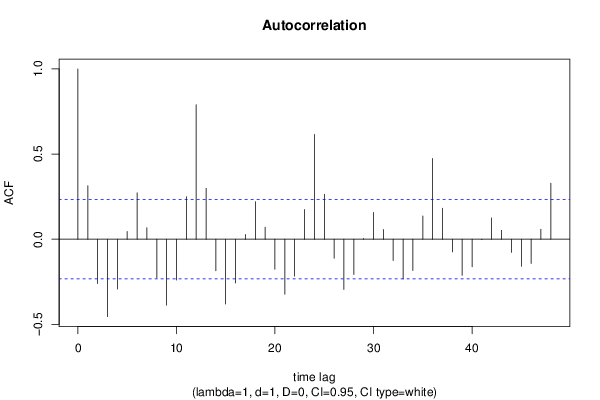
Autocorrelation Function
Time lag kACF(k)T-STATP-value
10.3142342.64780.004988
2-0.25987-2.18970.015917
3-0.454863-3.83270.000136
4-0.292282-2.46280.008106
50.0455120.38350.351252
60.2720942.29270.012415
70.0672470.56660.286376
8-0.227894-1.92030.029421
9-0.387187-3.26250.00085
10-0.239876-2.02120.023514
110.2499182.10590.019377
120.789686.6540
130.298832.5180.00703
14-0.185008-1.55890.061732
15-0.380505-3.20620.001009
16-0.257705-2.17150.01662
170.027560.23220.408516
180.2200541.85420.033932
190.0708370.59690.276241
20-0.176408-1.48640.070795
21-0.322926-2.7210.00409
22-0.216959-1.82810.035865
230.1748021.47290.072597
240.6153865.18531e-06
250.2641682.22590.014598
26-0.112283-0.94610.173651
27-0.294743-2.48350.007685
28-0.207184-1.74580.042589
290.004170.03510.486035
300.1564861.31860.095774
310.0574860.48440.314801
32-0.124983-1.05310.147928
33-0.234226-1.97360.026158
34-0.183479-1.5460.063273
350.1362611.14820.127379
360.4743.9947.8e-05
370.1823561.53660.064423
38-0.074539-0.62810.265986
39-0.212526-1.79080.038796
40-0.16181-1.36340.088526
41-0.002553-0.02150.491448
420.1244071.04830.149033
430.0518620.4370.331721
44-0.077383-0.6520.258239
45-0.158887-1.33880.092453
46-0.142004-1.19650.117732
470.0584850.49280.311837
480.3288152.77060.003568

\begin{tabular}{lllllllll}
\hline
Autocorrelation Function \tabularnewline
Time lag k & ACF(k) & T-STAT & P-value \tabularnewline
1 & 0.314234 & 2.6478 & 0.004988 \tabularnewline
2 & -0.25987 & -2.1897 & 0.015917 \tabularnewline
3 & -0.454863 & -3.8327 & 0.000136 \tabularnewline
4 & -0.292282 & -2.4628 & 0.008106 \tabularnewline
5 & 0.045512 & 0.3835 & 0.351252 \tabularnewline
6 & 0.272094 & 2.2927 & 0.012415 \tabularnewline
7 & 0.067247 & 0.5666 & 0.286376 \tabularnewline
8 & -0.227894 & -1.9203 & 0.029421 \tabularnewline
9 & -0.387187 & -3.2625 & 0.00085 \tabularnewline
10 & -0.239876 & -2.0212 & 0.023514 \tabularnewline
11 & 0.249918 & 2.1059 & 0.019377 \tabularnewline
12 & 0.78968 & 6.654 & 0 \tabularnewline
13 & 0.29883 & 2.518 & 0.00703 \tabularnewline
14 & -0.185008 & -1.5589 & 0.061732 \tabularnewline
15 & -0.380505 & -3.2062 & 0.001009 \tabularnewline
16 & -0.257705 & -2.1715 & 0.01662 \tabularnewline
17 & 0.02756 & 0.2322 & 0.408516 \tabularnewline
18 & 0.220054 & 1.8542 & 0.033932 \tabularnewline
19 & 0.070837 & 0.5969 & 0.276241 \tabularnewline
20 & -0.176408 & -1.4864 & 0.070795 \tabularnewline
21 & -0.322926 & -2.721 & 0.00409 \tabularnewline
22 & -0.216959 & -1.8281 & 0.035865 \tabularnewline
23 & 0.174802 & 1.4729 & 0.072597 \tabularnewline
24 & 0.615386 & 5.1853 & 1e-06 \tabularnewline
25 & 0.264168 & 2.2259 & 0.014598 \tabularnewline
26 & -0.112283 & -0.9461 & 0.173651 \tabularnewline
27 & -0.294743 & -2.4835 & 0.007685 \tabularnewline
28 & -0.207184 & -1.7458 & 0.042589 \tabularnewline
29 & 0.00417 & 0.0351 & 0.486035 \tabularnewline
30 & 0.156486 & 1.3186 & 0.095774 \tabularnewline
31 & 0.057486 & 0.4844 & 0.314801 \tabularnewline
32 & -0.124983 & -1.0531 & 0.147928 \tabularnewline
33 & -0.234226 & -1.9736 & 0.026158 \tabularnewline
34 & -0.183479 & -1.546 & 0.063273 \tabularnewline
35 & 0.136261 & 1.1482 & 0.127379 \tabularnewline
36 & 0.474 & 3.994 & 7.8e-05 \tabularnewline
37 & 0.182356 & 1.5366 & 0.064423 \tabularnewline
38 & -0.074539 & -0.6281 & 0.265986 \tabularnewline
39 & -0.212526 & -1.7908 & 0.038796 \tabularnewline
40 & -0.16181 & -1.3634 & 0.088526 \tabularnewline
41 & -0.002553 & -0.0215 & 0.491448 \tabularnewline
42 & 0.124407 & 1.0483 & 0.149033 \tabularnewline
43 & 0.051862 & 0.437 & 0.331721 \tabularnewline
44 & -0.077383 & -0.652 & 0.258239 \tabularnewline
45 & -0.158887 & -1.3388 & 0.092453 \tabularnewline
46 & -0.142004 & -1.1965 & 0.117732 \tabularnewline
47 & 0.058485 & 0.4928 & 0.311837 \tabularnewline
48 & 0.328815 & 2.7706 & 0.003568 \tabularnewline
\hline
\end{tabular}
%Source: https://freestatistics.org/blog/index.php?pk=&T=1

[TABLE]
[ROW][C]Autocorrelation Function[/C][/ROW]
[ROW][C]Time lag k[/C][C]ACF(k)[/C][C]T-STAT[/C][C]P-value[/C][/ROW]
[ROW][C]1[/C][C]0.314234[/C][C]2.6478[/C][C]0.004988[/C][/ROW]
[ROW][C]2[/C][C]-0.25987[/C][C]-2.1897[/C][C]0.015917[/C][/ROW]
[ROW][C]3[/C][C]-0.454863[/C][C]-3.8327[/C][C]0.000136[/C][/ROW]
[ROW][C]4[/C][C]-0.292282[/C][C]-2.4628[/C][C]0.008106[/C][/ROW]
[ROW][C]5[/C][C]0.045512[/C][C]0.3835[/C][C]0.351252[/C][/ROW]
[ROW][C]6[/C][C]0.272094[/C][C]2.2927[/C][C]0.012415[/C][/ROW]
[ROW][C]7[/C][C]0.067247[/C][C]0.5666[/C][C]0.286376[/C][/ROW]
[ROW][C]8[/C][C]-0.227894[/C][C]-1.9203[/C][C]0.029421[/C][/ROW]
[ROW][C]9[/C][C]-0.387187[/C][C]-3.2625[/C][C]0.00085[/C][/ROW]
[ROW][C]10[/C][C]-0.239876[/C][C]-2.0212[/C][C]0.023514[/C][/ROW]
[ROW][C]11[/C][C]0.249918[/C][C]2.1059[/C][C]0.019377[/C][/ROW]
[ROW][C]12[/C][C]0.78968[/C][C]6.654[/C][C]0[/C][/ROW]
[ROW][C]13[/C][C]0.29883[/C][C]2.518[/C][C]0.00703[/C][/ROW]
[ROW][C]14[/C][C]-0.185008[/C][C]-1.5589[/C][C]0.061732[/C][/ROW]
[ROW][C]15[/C][C]-0.380505[/C][C]-3.2062[/C][C]0.001009[/C][/ROW]
[ROW][C]16[/C][C]-0.257705[/C][C]-2.1715[/C][C]0.01662[/C][/ROW]
[ROW][C]17[/C][C]0.02756[/C][C]0.2322[/C][C]0.408516[/C][/ROW]
[ROW][C]18[/C][C]0.220054[/C][C]1.8542[/C][C]0.033932[/C][/ROW]
[ROW][C]19[/C][C]0.070837[/C][C]0.5969[/C][C]0.276241[/C][/ROW]
[ROW][C]20[/C][C]-0.176408[/C][C]-1.4864[/C][C]0.070795[/C][/ROW]
[ROW][C]21[/C][C]-0.322926[/C][C]-2.721[/C][C]0.00409[/C][/ROW]
[ROW][C]22[/C][C]-0.216959[/C][C]-1.8281[/C][C]0.035865[/C][/ROW]
[ROW][C]23[/C][C]0.174802[/C][C]1.4729[/C][C]0.072597[/C][/ROW]
[ROW][C]24[/C][C]0.615386[/C][C]5.1853[/C][C]1e-06[/C][/ROW]
[ROW][C]25[/C][C]0.264168[/C][C]2.2259[/C][C]0.014598[/C][/ROW]
[ROW][C]26[/C][C]-0.112283[/C][C]-0.9461[/C][C]0.173651[/C][/ROW]
[ROW][C]27[/C][C]-0.294743[/C][C]-2.4835[/C][C]0.007685[/C][/ROW]
[ROW][C]28[/C][C]-0.207184[/C][C]-1.7458[/C][C]0.042589[/C][/ROW]
[ROW][C]29[/C][C]0.00417[/C][C]0.0351[/C][C]0.486035[/C][/ROW]
[ROW][C]30[/C][C]0.156486[/C][C]1.3186[/C][C]0.095774[/C][/ROW]
[ROW][C]31[/C][C]0.057486[/C][C]0.4844[/C][C]0.314801[/C][/ROW]
[ROW][C]32[/C][C]-0.124983[/C][C]-1.0531[/C][C]0.147928[/C][/ROW]
[ROW][C]33[/C][C]-0.234226[/C][C]-1.9736[/C][C]0.026158[/C][/ROW]
[ROW][C]34[/C][C]-0.183479[/C][C]-1.546[/C][C]0.063273[/C][/ROW]
[ROW][C]35[/C][C]0.136261[/C][C]1.1482[/C][C]0.127379[/C][/ROW]
[ROW][C]36[/C][C]0.474[/C][C]3.994[/C][C]7.8e-05[/C][/ROW]
[ROW][C]37[/C][C]0.182356[/C][C]1.5366[/C][C]0.064423[/C][/ROW]
[ROW][C]38[/C][C]-0.074539[/C][C]-0.6281[/C][C]0.265986[/C][/ROW]
[ROW][C]39[/C][C]-0.212526[/C][C]-1.7908[/C][C]0.038796[/C][/ROW]
[ROW][C]40[/C][C]-0.16181[/C][C]-1.3634[/C][C]0.088526[/C][/ROW]
[ROW][C]41[/C][C]-0.002553[/C][C]-0.0215[/C][C]0.491448[/C][/ROW]
[ROW][C]42[/C][C]0.124407[/C][C]1.0483[/C][C]0.149033[/C][/ROW]
[ROW][C]43[/C][C]0.051862[/C][C]0.437[/C][C]0.331721[/C][/ROW]
[ROW][C]44[/C][C]-0.077383[/C][C]-0.652[/C][C]0.258239[/C][/ROW]
[ROW][C]45[/C][C]-0.158887[/C][C]-1.3388[/C][C]0.092453[/C][/ROW]
[ROW][C]46[/C][C]-0.142004[/C][C]-1.1965[/C][C]0.117732[/C][/ROW]
[ROW][C]47[/C][C]0.058485[/C][C]0.4928[/C][C]0.311837[/C][/ROW]
[ROW][C]48[/C][C]0.328815[/C][C]2.7706[/C][C]0.003568[/C][/ROW]
[/TABLE]
Source: https://freestatistics.org/blog/index.php?pk=&T=1

Globally Unique Identifier (entire table): ba.freestatistics.org/blog/index.php?pk=&T=1

As an alternative you can also use a QR Code:  

The GUIDs for individual cells are displayed in the table below:

Autocorrelation Function
Time lag kACF(k)T-STATP-value
10.3142342.64780.004988
2-0.25987-2.18970.015917
3-0.454863-3.83270.000136
4-0.292282-2.46280.008106
50.0455120.38350.351252
60.2720942.29270.012415
70.0672470.56660.286376
8-0.227894-1.92030.029421
9-0.387187-3.26250.00085
10-0.239876-2.02120.023514
110.2499182.10590.019377
120.789686.6540
130.298832.5180.00703
14-0.185008-1.55890.061732
15-0.380505-3.20620.001009
16-0.257705-2.17150.01662
170.027560.23220.408516
180.2200541.85420.033932
190.0708370.59690.276241
20-0.176408-1.48640.070795
21-0.322926-2.7210.00409
22-0.216959-1.82810.035865
230.1748021.47290.072597
240.6153865.18531e-06
250.2641682.22590.014598
26-0.112283-0.94610.173651
27-0.294743-2.48350.007685
28-0.207184-1.74580.042589
290.004170.03510.486035
300.1564861.31860.095774
310.0574860.48440.314801
32-0.124983-1.05310.147928
33-0.234226-1.97360.026158
34-0.183479-1.5460.063273
350.1362611.14820.127379
360.4743.9947.8e-05
370.1823561.53660.064423
38-0.074539-0.62810.265986
39-0.212526-1.79080.038796
40-0.16181-1.36340.088526
41-0.002553-0.02150.491448
420.1244071.04830.149033
430.0518620.4370.331721
44-0.077383-0.6520.258239
45-0.158887-1.33880.092453
46-0.142004-1.19650.117732
470.0584850.49280.311837
480.3288152.77060.003568


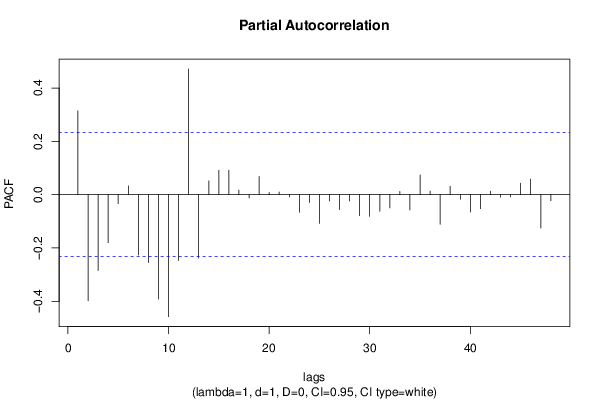
Partial Autocorrelation Function
Time lag kPACF(k)T-STATP-value
10.3142342.64780.004988
2-0.397903-3.35280.000643
3-0.284321-2.39570.009613
4-0.180051-1.51710.066836
5-0.033673-0.28370.388719
60.0328240.27660.391454
7-0.226437-1.9080.030218
8-0.254782-2.14680.017612
9-0.391895-3.30220.000752
10-0.457729-3.85690.000125
11-0.247266-2.08350.020403
120.4715693.97358.4e-05
13-0.237317-1.99970.024681
140.0516840.43550.332261
150.09170.77270.221139
160.0915370.77130.221544
170.0169320.14270.443476
18-0.012476-0.10510.458286
190.0681280.57410.283872
200.008040.06770.473091
210.0096770.08150.467622
22-0.007781-0.06560.473956
23-0.066344-0.5590.288951
24-0.029258-0.24650.402992
25-0.107684-0.90740.183643
26-0.023765-0.20030.420929
27-0.056384-0.47510.318088
28-0.023715-0.19980.421093
29-0.07873-0.66340.254615
30-0.081443-0.68630.247394
31-0.062471-0.52640.300128
32-0.049824-0.41980.337941
330.0115730.09750.461296
34-0.05784-0.48740.313751
350.073690.62090.268319
360.013350.11250.455377
37-0.111095-0.93610.176196
380.0314440.2650.395906
39-0.017225-0.14510.442507
40-0.065273-0.550.292023
41-0.05255-0.44280.32963
420.0128650.10840.456992
43-0.009456-0.07970.468358
44-0.008105-0.06830.472873
450.0430370.36260.358976
460.0583660.49180.31219
47-0.125511-1.05760.146917
48-0.022886-0.19280.423817

\begin{tabular}{lllllllll}
\hline
Partial Autocorrelation Function \tabularnewline
Time lag k & PACF(k) & T-STAT & P-value \tabularnewline
1 & 0.314234 & 2.6478 & 0.004988 \tabularnewline
2 & -0.397903 & -3.3528 & 0.000643 \tabularnewline
3 & -0.284321 & -2.3957 & 0.009613 \tabularnewline
4 & -0.180051 & -1.5171 & 0.066836 \tabularnewline
5 & -0.033673 & -0.2837 & 0.388719 \tabularnewline
6 & 0.032824 & 0.2766 & 0.391454 \tabularnewline
7 & -0.226437 & -1.908 & 0.030218 \tabularnewline
8 & -0.254782 & -2.1468 & 0.017612 \tabularnewline
9 & -0.391895 & -3.3022 & 0.000752 \tabularnewline
10 & -0.457729 & -3.8569 & 0.000125 \tabularnewline
11 & -0.247266 & -2.0835 & 0.020403 \tabularnewline
12 & 0.471569 & 3.9735 & 8.4e-05 \tabularnewline
13 & -0.237317 & -1.9997 & 0.024681 \tabularnewline
14 & 0.051684 & 0.4355 & 0.332261 \tabularnewline
15 & 0.0917 & 0.7727 & 0.221139 \tabularnewline
16 & 0.091537 & 0.7713 & 0.221544 \tabularnewline
17 & 0.016932 & 0.1427 & 0.443476 \tabularnewline
18 & -0.012476 & -0.1051 & 0.458286 \tabularnewline
19 & 0.068128 & 0.5741 & 0.283872 \tabularnewline
20 & 0.00804 & 0.0677 & 0.473091 \tabularnewline
21 & 0.009677 & 0.0815 & 0.467622 \tabularnewline
22 & -0.007781 & -0.0656 & 0.473956 \tabularnewline
23 & -0.066344 & -0.559 & 0.288951 \tabularnewline
24 & -0.029258 & -0.2465 & 0.402992 \tabularnewline
25 & -0.107684 & -0.9074 & 0.183643 \tabularnewline
26 & -0.023765 & -0.2003 & 0.420929 \tabularnewline
27 & -0.056384 & -0.4751 & 0.318088 \tabularnewline
28 & -0.023715 & -0.1998 & 0.421093 \tabularnewline
29 & -0.07873 & -0.6634 & 0.254615 \tabularnewline
30 & -0.081443 & -0.6863 & 0.247394 \tabularnewline
31 & -0.062471 & -0.5264 & 0.300128 \tabularnewline
32 & -0.049824 & -0.4198 & 0.337941 \tabularnewline
33 & 0.011573 & 0.0975 & 0.461296 \tabularnewline
34 & -0.05784 & -0.4874 & 0.313751 \tabularnewline
35 & 0.07369 & 0.6209 & 0.268319 \tabularnewline
36 & 0.01335 & 0.1125 & 0.455377 \tabularnewline
37 & -0.111095 & -0.9361 & 0.176196 \tabularnewline
38 & 0.031444 & 0.265 & 0.395906 \tabularnewline
39 & -0.017225 & -0.1451 & 0.442507 \tabularnewline
40 & -0.065273 & -0.55 & 0.292023 \tabularnewline
41 & -0.05255 & -0.4428 & 0.32963 \tabularnewline
42 & 0.012865 & 0.1084 & 0.456992 \tabularnewline
43 & -0.009456 & -0.0797 & 0.468358 \tabularnewline
44 & -0.008105 & -0.0683 & 0.472873 \tabularnewline
45 & 0.043037 & 0.3626 & 0.358976 \tabularnewline
46 & 0.058366 & 0.4918 & 0.31219 \tabularnewline
47 & -0.125511 & -1.0576 & 0.146917 \tabularnewline
48 & -0.022886 & -0.1928 & 0.423817 \tabularnewline
\hline
\end{tabular}
%Source: https://freestatistics.org/blog/index.php?pk=&T=2

[TABLE]
[ROW][C]Partial Autocorrelation Function[/C][/ROW]
[ROW][C]Time lag k[/C][C]PACF(k)[/C][C]T-STAT[/C][C]P-value[/C][/ROW]
[ROW][C]1[/C][C]0.314234[/C][C]2.6478[/C][C]0.004988[/C][/ROW]
[ROW][C]2[/C][C]-0.397903[/C][C]-3.3528[/C][C]0.000643[/C][/ROW]
[ROW][C]3[/C][C]-0.284321[/C][C]-2.3957[/C][C]0.009613[/C][/ROW]
[ROW][C]4[/C][C]-0.180051[/C][C]-1.5171[/C][C]0.066836[/C][/ROW]
[ROW][C]5[/C][C]-0.033673[/C][C]-0.2837[/C][C]0.388719[/C][/ROW]
[ROW][C]6[/C][C]0.032824[/C][C]0.2766[/C][C]0.391454[/C][/ROW]
[ROW][C]7[/C][C]-0.226437[/C][C]-1.908[/C][C]0.030218[/C][/ROW]
[ROW][C]8[/C][C]-0.254782[/C][C]-2.1468[/C][C]0.017612[/C][/ROW]
[ROW][C]9[/C][C]-0.391895[/C][C]-3.3022[/C][C]0.000752[/C][/ROW]
[ROW][C]10[/C][C]-0.457729[/C][C]-3.8569[/C][C]0.000125[/C][/ROW]
[ROW][C]11[/C][C]-0.247266[/C][C]-2.0835[/C][C]0.020403[/C][/ROW]
[ROW][C]12[/C][C]0.471569[/C][C]3.9735[/C][C]8.4e-05[/C][/ROW]
[ROW][C]13[/C][C]-0.237317[/C][C]-1.9997[/C][C]0.024681[/C][/ROW]
[ROW][C]14[/C][C]0.051684[/C][C]0.4355[/C][C]0.332261[/C][/ROW]
[ROW][C]15[/C][C]0.0917[/C][C]0.7727[/C][C]0.221139[/C][/ROW]
[ROW][C]16[/C][C]0.091537[/C][C]0.7713[/C][C]0.221544[/C][/ROW]
[ROW][C]17[/C][C]0.016932[/C][C]0.1427[/C][C]0.443476[/C][/ROW]
[ROW][C]18[/C][C]-0.012476[/C][C]-0.1051[/C][C]0.458286[/C][/ROW]
[ROW][C]19[/C][C]0.068128[/C][C]0.5741[/C][C]0.283872[/C][/ROW]
[ROW][C]20[/C][C]0.00804[/C][C]0.0677[/C][C]0.473091[/C][/ROW]
[ROW][C]21[/C][C]0.009677[/C][C]0.0815[/C][C]0.467622[/C][/ROW]
[ROW][C]22[/C][C]-0.007781[/C][C]-0.0656[/C][C]0.473956[/C][/ROW]
[ROW][C]23[/C][C]-0.066344[/C][C]-0.559[/C][C]0.288951[/C][/ROW]
[ROW][C]24[/C][C]-0.029258[/C][C]-0.2465[/C][C]0.402992[/C][/ROW]
[ROW][C]25[/C][C]-0.107684[/C][C]-0.9074[/C][C]0.183643[/C][/ROW]
[ROW][C]26[/C][C]-0.023765[/C][C]-0.2003[/C][C]0.420929[/C][/ROW]
[ROW][C]27[/C][C]-0.056384[/C][C]-0.4751[/C][C]0.318088[/C][/ROW]
[ROW][C]28[/C][C]-0.023715[/C][C]-0.1998[/C][C]0.421093[/C][/ROW]
[ROW][C]29[/C][C]-0.07873[/C][C]-0.6634[/C][C]0.254615[/C][/ROW]
[ROW][C]30[/C][C]-0.081443[/C][C]-0.6863[/C][C]0.247394[/C][/ROW]
[ROW][C]31[/C][C]-0.062471[/C][C]-0.5264[/C][C]0.300128[/C][/ROW]
[ROW][C]32[/C][C]-0.049824[/C][C]-0.4198[/C][C]0.337941[/C][/ROW]
[ROW][C]33[/C][C]0.011573[/C][C]0.0975[/C][C]0.461296[/C][/ROW]
[ROW][C]34[/C][C]-0.05784[/C][C]-0.4874[/C][C]0.313751[/C][/ROW]
[ROW][C]35[/C][C]0.07369[/C][C]0.6209[/C][C]0.268319[/C][/ROW]
[ROW][C]36[/C][C]0.01335[/C][C]0.1125[/C][C]0.455377[/C][/ROW]
[ROW][C]37[/C][C]-0.111095[/C][C]-0.9361[/C][C]0.176196[/C][/ROW]
[ROW][C]38[/C][C]0.031444[/C][C]0.265[/C][C]0.395906[/C][/ROW]
[ROW][C]39[/C][C]-0.017225[/C][C]-0.1451[/C][C]0.442507[/C][/ROW]
[ROW][C]40[/C][C]-0.065273[/C][C]-0.55[/C][C]0.292023[/C][/ROW]
[ROW][C]41[/C][C]-0.05255[/C][C]-0.4428[/C][C]0.32963[/C][/ROW]
[ROW][C]42[/C][C]0.012865[/C][C]0.1084[/C][C]0.456992[/C][/ROW]
[ROW][C]43[/C][C]-0.009456[/C][C]-0.0797[/C][C]0.468358[/C][/ROW]
[ROW][C]44[/C][C]-0.008105[/C][C]-0.0683[/C][C]0.472873[/C][/ROW]
[ROW][C]45[/C][C]0.043037[/C][C]0.3626[/C][C]0.358976[/C][/ROW]
[ROW][C]46[/C][C]0.058366[/C][C]0.4918[/C][C]0.31219[/C][/ROW]
[ROW][C]47[/C][C]-0.125511[/C][C]-1.0576[/C][C]0.146917[/C][/ROW]
[ROW][C]48[/C][C]-0.022886[/C][C]-0.1928[/C][C]0.423817[/C][/ROW]
[/TABLE]
Source: https://freestatistics.org/blog/index.php?pk=&T=2

Globally Unique Identifier (entire table): ba.freestatistics.org/blog/index.php?pk=&T=2

As an alternative you can also use a QR Code:  

The GUIDs for individual cells are displayed in the table below:

Partial Autocorrelation Function
Time lag kPACF(k)T-STATP-value
10.3142342.64780.004988
2-0.397903-3.35280.000643
3-0.284321-2.39570.009613
4-0.180051-1.51710.066836
5-0.033673-0.28370.388719
60.0328240.27660.391454
7-0.226437-1.9080.030218
8-0.254782-2.14680.017612
9-0.391895-3.30220.000752
10-0.457729-3.85690.000125
11-0.247266-2.08350.020403
120.4715693.97358.4e-05
13-0.237317-1.99970.024681
140.0516840.43550.332261
150.09170.77270.221139
160.0915370.77130.221544
170.0169320.14270.443476
18-0.012476-0.10510.458286
190.0681280.57410.283872
200.008040.06770.473091
210.0096770.08150.467622
22-0.007781-0.06560.473956
23-0.066344-0.5590.288951
24-0.029258-0.24650.402992
25-0.107684-0.90740.183643
26-0.023765-0.20030.420929
27-0.056384-0.47510.318088
28-0.023715-0.19980.421093
29-0.07873-0.66340.254615
30-0.081443-0.68630.247394
31-0.062471-0.52640.300128
32-0.049824-0.41980.337941
330.0115730.09750.461296
34-0.05784-0.48740.313751
350.073690.62090.268319
360.013350.11250.455377
37-0.111095-0.93610.176196
380.0314440.2650.395906
39-0.017225-0.14510.442507
40-0.065273-0.550.292023
41-0.05255-0.44280.32963
420.0128650.10840.456992
43-0.009456-0.07970.468358
44-0.008105-0.06830.472873
450.0430370.36260.358976
460.0583660.49180.31219
47-0.125511-1.05760.146917
48-0.022886-0.19280.423817


Parameters (Session):
par1 = 48 ; par2 = 1 ; par3 = 1 ; par4 = 0 ; par5 = 12 ; par6 = White Noise ; par7 = 0.95 ;
Parameters (R input):
par1 = 48 ; par2 = 1 ; par3 = 1 ; par4 = 0 ; par5 = 12 ; par6 = White Noise ; par7 = 0.95 ; par8 = ;
R code (references can be found in the software module):
if (par1 == 'Default') {
par1 = 10*log10(length(x))
} else {
par1 <- as.numeric(par1)
}
par2 <- as.numeric(par2)
par3 <- as.numeric(par3)
par4 <- as.numeric(par4)
par5 <- as.numeric(par5)
if (par6 == 'White Noise') par6 <- 'white' else par6 <- 'ma'
par7 <- as.numeric(par7)
if (par8 != '') par8 <- as.numeric(par8)
x <- na.omit(x)
ox <- x
if (par8 == '') {
if (par2 == 0) {
x <- log(x)
} else {
x <- (x ^ par2 - 1) / par2
}
} else {
x <- log(x,base=par8)
}
if (par3 > 0) x <- diff(x,lag=1,difference=par3)
if (par4 > 0) x <- diff(x,lag=par5,difference=par4)
bitmap(file='picts.png')
op <- par(mfrow=c(2,1))
plot(ox,type='l',main='Original Time Series',xlab='time',ylab='value')
if (par8=='') {
mytitle <- paste('Working Time Series (lambda=',par2,', d=',par3,', D=',par4,')',sep='')
mysub <- paste('(lambda=',par2,', d=',par3,', D=',par4,', CI=', par7, ', CI type=',par6,')',sep='')
} else {
mytitle <- paste('Working Time Series (base=',par8,', d=',par3,', D=',par4,')',sep='')
mysub <- paste('(base=',par8,', d=',par3,', D=',par4,', CI=', par7, ', CI type=',par6,')',sep='')
}
plot(x,type='l', main=mytitle,xlab='time',ylab='value')
par(op)
dev.off()
bitmap(file='pic1.png')
racf <- acf(x, par1, main='Autocorrelation', xlab='time lag', ylab='ACF', ci.type=par6, ci=par7, sub=mysub)
dev.off()
bitmap(file='pic2.png')
rpacf <- pacf(x,par1,main='Partial Autocorrelation',xlab='lags',ylab='PACF',sub=mysub)
dev.off()
(myacf <- c(racf$acf))
(mypacf <- c(rpacf$acf))
lengthx <- length(x)
sqrtn <- sqrt(lengthx)
load(file='createtable')
a<-table.start()
a<-table.row.start(a)
a<-table.element(a,'Autocorrelation Function',4,TRUE)
a<-table.row.end(a)
a<-table.row.start(a)
a<-table.element(a,'Time lag k',header=TRUE)
a<-table.element(a,hyperlink('basics.htm','ACF(k)','click here for more information about the Autocorrelation Function'),header=TRUE)
a<-table.element(a,'T-STAT',header=TRUE)
a<-table.element(a,'P-value',header=TRUE)
a<-table.row.end(a)
for (i in 2:(par1+1)) {
a<-table.row.start(a)
a<-table.element(a,i-1,header=TRUE)
a<-table.element(a,round(myacf[i],6))
mytstat <- myacf[i]*sqrtn
a<-table.element(a,round(mytstat,4))
a<-table.element(a,round(1-pt(abs(mytstat),lengthx),6))
a<-table.row.end(a)
}
a<-table.end(a)
table.save(a,file='mytable.tab')
a<-table.start()
a<-table.row.start(a)
a<-table.element(a,'Partial Autocorrelation Function',4,TRUE)
a<-table.row.end(a)
a<-table.row.start(a)
a<-table.element(a,'Time lag k',header=TRUE)
a<-table.element(a,hyperlink('basics.htm','PACF(k)','click here for more information about the Partial Autocorrelation Function'),header=TRUE)
a<-table.element(a,'T-STAT',header=TRUE)
a<-table.element(a,'P-value',header=TRUE)
a<-table.row.end(a)
for (i in 1:par1) {
a<-table.row.start(a)
a<-table.element(a,i,header=TRUE)
a<-table.element(a,round(mypacf[i],6))
mytstat <- mypacf[i]*sqrtn
a<-table.element(a,round(mytstat,4))
a<-table.element(a,round(1-pt(abs(mytstat),lengthx),6))
a<-table.row.end(a)
}
a<-table.end(a)
table.save(a,file='mytable1.tab')