Free Statistics

of Irreproducible Research!

Author's title

Author*Unverified author*
R Software Modulerwasp_autocorrelation.wasp
Title produced by software(Partial) Autocorrelation Function
Date of computationSun, 19 Mar 2017 18:30:16 +0000
Cite this page as followsStatistical Computations at FreeStatistics.org, Office for Research Development and Education, URL https://freestatistics.org/blog/index.php?v=date/2017/Mar/19/t148994825687p7cs4r9tr9hps.htm/, Retrieved Wed, 15 May 2024 23:39:13 +0200
Statistical Computations at FreeStatistics.org, Office for Research Development and Education, URL https://freestatistics.org/blog/index.php?pk=, Retrieved Wed, 15 May 2024 23:39:13 +0200
QR Codes:

Original text written by user:
IsPrivate?No (this computation is public)
User-defined keywords
Estimated Impact0
Dataseries X:
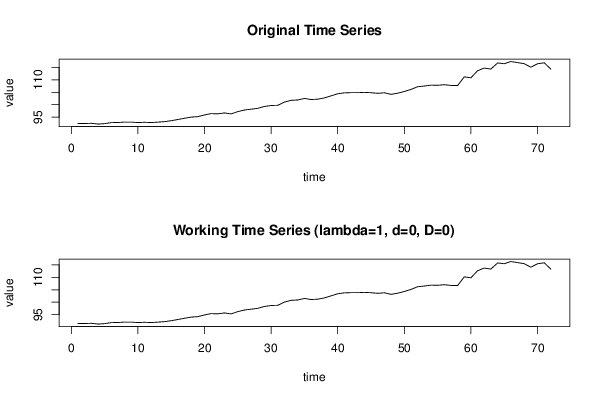
92,49
92,46
92,55
92,24
92,41
92,83
92,85
93,04
93,04
92,83
92,96
92,83
93,01
93,21
93,58
94,07
94,57
95,03
95,21
95,89
96,43
96,35
96,71
96,32
97,23
97,88
98,2
98,56
99,31
99,69
99,77
101,06
101,77
101,91
102,52
102,09
102,22
102,74
103,56
104,4
104,76
104,86
104,84
104,96
104,83
104,58
104,8
104,17
104,63
105,32
106,16
107,22
107,51
107,87
107,79
108,04
107,74
107,71
111,19
110,82
113,65
114,72
114,32
116,76
116,47
117,34
116,92
116,48
115,07
116,45
116,84
114,31


Summary of computational transaction
Raw Inputview raw input (R code)
Raw Outputview raw output of R engine
Computing time2 seconds
R Server'George Udny Yule' @ yule.wessa.net

\begin{tabular}{lllllllll}
\hline
Summary of computational transaction \tabularnewline
Raw Input & view raw input (R code)  \tabularnewline
Raw Output & view raw output of R engine  \tabularnewline
Computing time & 2 seconds \tabularnewline
R Server & 'George Udny Yule' @ yule.wessa.net \tabularnewline
\hline
\end{tabular}
%Source: https://freestatistics.org/blog/index.php?pk=&T=0

[TABLE]
[ROW][C]Summary of computational transaction[/C][/ROW]
[ROW][C]Raw Input[/C][C]view raw input (R code) [/C][/ROW]
[ROW][C]Raw Output[/C][C]view raw output of R engine [/C][/ROW]
[ROW][C]Computing time[/C][C]2 seconds[/C][/ROW]
[ROW][C]R Server[/C][C]'George Udny Yule' @ yule.wessa.net[/C][/ROW]
[/TABLE]
Source: https://freestatistics.org/blog/index.php?pk=&T=0

Globally Unique Identifier (entire table): ba.freestatistics.org/blog/index.php?pk=&T=0

As an alternative you can also use a QR Code:  

The GUIDs for individual cells are displayed in the table below:

Summary of computational transaction
Raw Inputview raw input (R code)
Raw Outputview raw output of R engine
Computing time2 seconds
R Server'George Udny Yule' @ yule.wessa.net


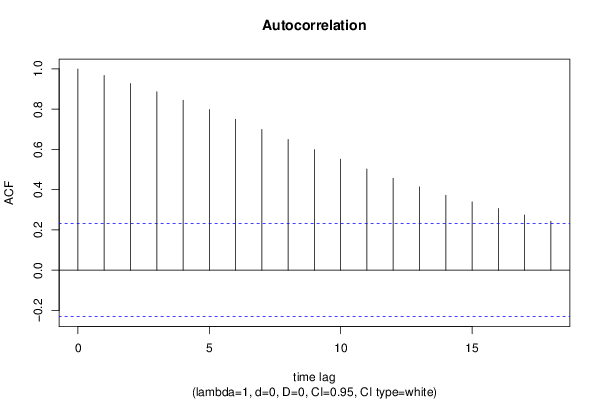
Autocorrelation Function
Time lag kACF(k)T-STATP-value
10.9675688.21010
20.9278957.87350
30.8864287.52160
40.8442267.16350
50.7985826.77620
60.7496996.36140
70.6991065.93210
80.6490975.50780
90.5989525.08231e-06
100.5517274.68167e-06
110.5029954.26813e-05
120.4562313.87130.000118
130.4138683.51180.000386
140.3724493.16030.001153
150.3395662.88130.002607
160.3066332.60190.005624
170.2745682.32980.011313
180.2433712.06510.021259

\begin{tabular}{lllllllll}
\hline
Autocorrelation Function \tabularnewline
Time lag k & ACF(k) & T-STAT & P-value \tabularnewline
1 & 0.967568 & 8.2101 & 0 \tabularnewline
2 & 0.927895 & 7.8735 & 0 \tabularnewline
3 & 0.886428 & 7.5216 & 0 \tabularnewline
4 & 0.844226 & 7.1635 & 0 \tabularnewline
5 & 0.798582 & 6.7762 & 0 \tabularnewline
6 & 0.749699 & 6.3614 & 0 \tabularnewline
7 & 0.699106 & 5.9321 & 0 \tabularnewline
8 & 0.649097 & 5.5078 & 0 \tabularnewline
9 & 0.598952 & 5.0823 & 1e-06 \tabularnewline
10 & 0.551727 & 4.6816 & 7e-06 \tabularnewline
11 & 0.502995 & 4.2681 & 3e-05 \tabularnewline
12 & 0.456231 & 3.8713 & 0.000118 \tabularnewline
13 & 0.413868 & 3.5118 & 0.000386 \tabularnewline
14 & 0.372449 & 3.1603 & 0.001153 \tabularnewline
15 & 0.339566 & 2.8813 & 0.002607 \tabularnewline
16 & 0.306633 & 2.6019 & 0.005624 \tabularnewline
17 & 0.274568 & 2.3298 & 0.011313 \tabularnewline
18 & 0.243371 & 2.0651 & 0.021259 \tabularnewline
\hline
\end{tabular}
%Source: https://freestatistics.org/blog/index.php?pk=&T=1

[TABLE]
[ROW][C]Autocorrelation Function[/C][/ROW]
[ROW][C]Time lag k[/C][C]ACF(k)[/C][C]T-STAT[/C][C]P-value[/C][/ROW]
[ROW][C]1[/C][C]0.967568[/C][C]8.2101[/C][C]0[/C][/ROW]
[ROW][C]2[/C][C]0.927895[/C][C]7.8735[/C][C]0[/C][/ROW]
[ROW][C]3[/C][C]0.886428[/C][C]7.5216[/C][C]0[/C][/ROW]
[ROW][C]4[/C][C]0.844226[/C][C]7.1635[/C][C]0[/C][/ROW]
[ROW][C]5[/C][C]0.798582[/C][C]6.7762[/C][C]0[/C][/ROW]
[ROW][C]6[/C][C]0.749699[/C][C]6.3614[/C][C]0[/C][/ROW]
[ROW][C]7[/C][C]0.699106[/C][C]5.9321[/C][C]0[/C][/ROW]
[ROW][C]8[/C][C]0.649097[/C][C]5.5078[/C][C]0[/C][/ROW]
[ROW][C]9[/C][C]0.598952[/C][C]5.0823[/C][C]1e-06[/C][/ROW]
[ROW][C]10[/C][C]0.551727[/C][C]4.6816[/C][C]7e-06[/C][/ROW]
[ROW][C]11[/C][C]0.502995[/C][C]4.2681[/C][C]3e-05[/C][/ROW]
[ROW][C]12[/C][C]0.456231[/C][C]3.8713[/C][C]0.000118[/C][/ROW]
[ROW][C]13[/C][C]0.413868[/C][C]3.5118[/C][C]0.000386[/C][/ROW]
[ROW][C]14[/C][C]0.372449[/C][C]3.1603[/C][C]0.001153[/C][/ROW]
[ROW][C]15[/C][C]0.339566[/C][C]2.8813[/C][C]0.002607[/C][/ROW]
[ROW][C]16[/C][C]0.306633[/C][C]2.6019[/C][C]0.005624[/C][/ROW]
[ROW][C]17[/C][C]0.274568[/C][C]2.3298[/C][C]0.011313[/C][/ROW]
[ROW][C]18[/C][C]0.243371[/C][C]2.0651[/C][C]0.021259[/C][/ROW]
[/TABLE]
Source: https://freestatistics.org/blog/index.php?pk=&T=1

Globally Unique Identifier (entire table): ba.freestatistics.org/blog/index.php?pk=&T=1

As an alternative you can also use a QR Code:  

The GUIDs for individual cells are displayed in the table below:

Autocorrelation Function
Time lag kACF(k)T-STATP-value
10.9675688.21010
20.9278957.87350
30.8864287.52160
40.8442267.16350
50.7985826.77620
60.7496996.36140
70.6991065.93210
80.6490975.50780
90.5989525.08231e-06
100.5517274.68167e-06
110.5029954.26813e-05
120.4562313.87130.000118
130.4138683.51180.000386
140.3724493.16030.001153
150.3395662.88130.002607
160.3066332.60190.005624
170.2745682.32980.011313
180.2433712.06510.021259


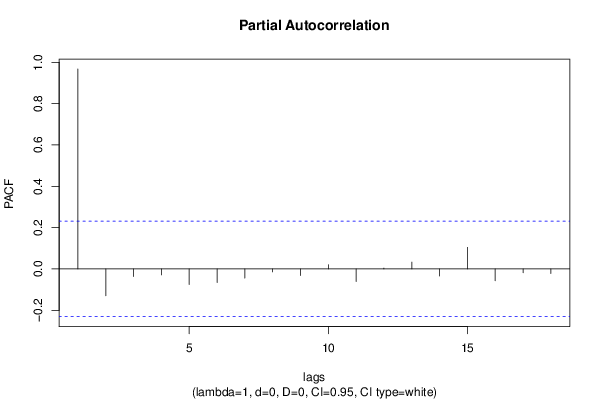
Partial Autocorrelation Function
Time lag kPACF(k)T-STATP-value
10.9675688.21010
2-0.129942-1.10260.136937
3-0.036784-0.31210.377926
4-0.029014-0.24620.403117
5-0.075517-0.64080.261849
6-0.065981-0.55990.288653
7-0.044431-0.3770.353637
8-0.014421-0.12240.451474
9-0.031971-0.27130.393476
100.0198720.16860.433284
11-0.060695-0.5150.304059
120.0040390.03430.486379
130.0328460.27870.390633
14-0.034122-0.28950.386503
150.1042680.88470.189621
16-0.057612-0.48890.313216
17-0.018658-0.15830.437324
18-0.0223-0.18920.425225

\begin{tabular}{lllllllll}
\hline
Partial Autocorrelation Function \tabularnewline
Time lag k & PACF(k) & T-STAT & P-value \tabularnewline
1 & 0.967568 & 8.2101 & 0 \tabularnewline
2 & -0.129942 & -1.1026 & 0.136937 \tabularnewline
3 & -0.036784 & -0.3121 & 0.377926 \tabularnewline
4 & -0.029014 & -0.2462 & 0.403117 \tabularnewline
5 & -0.075517 & -0.6408 & 0.261849 \tabularnewline
6 & -0.065981 & -0.5599 & 0.288653 \tabularnewline
7 & -0.044431 & -0.377 & 0.353637 \tabularnewline
8 & -0.014421 & -0.1224 & 0.451474 \tabularnewline
9 & -0.031971 & -0.2713 & 0.393476 \tabularnewline
10 & 0.019872 & 0.1686 & 0.433284 \tabularnewline
11 & -0.060695 & -0.515 & 0.304059 \tabularnewline
12 & 0.004039 & 0.0343 & 0.486379 \tabularnewline
13 & 0.032846 & 0.2787 & 0.390633 \tabularnewline
14 & -0.034122 & -0.2895 & 0.386503 \tabularnewline
15 & 0.104268 & 0.8847 & 0.189621 \tabularnewline
16 & -0.057612 & -0.4889 & 0.313216 \tabularnewline
17 & -0.018658 & -0.1583 & 0.437324 \tabularnewline
18 & -0.0223 & -0.1892 & 0.425225 \tabularnewline
\hline
\end{tabular}
%Source: https://freestatistics.org/blog/index.php?pk=&T=2

[TABLE]
[ROW][C]Partial Autocorrelation Function[/C][/ROW]
[ROW][C]Time lag k[/C][C]PACF(k)[/C][C]T-STAT[/C][C]P-value[/C][/ROW]
[ROW][C]1[/C][C]0.967568[/C][C]8.2101[/C][C]0[/C][/ROW]
[ROW][C]2[/C][C]-0.129942[/C][C]-1.1026[/C][C]0.136937[/C][/ROW]
[ROW][C]3[/C][C]-0.036784[/C][C]-0.3121[/C][C]0.377926[/C][/ROW]
[ROW][C]4[/C][C]-0.029014[/C][C]-0.2462[/C][C]0.403117[/C][/ROW]
[ROW][C]5[/C][C]-0.075517[/C][C]-0.6408[/C][C]0.261849[/C][/ROW]
[ROW][C]6[/C][C]-0.065981[/C][C]-0.5599[/C][C]0.288653[/C][/ROW]
[ROW][C]7[/C][C]-0.044431[/C][C]-0.377[/C][C]0.353637[/C][/ROW]
[ROW][C]8[/C][C]-0.014421[/C][C]-0.1224[/C][C]0.451474[/C][/ROW]
[ROW][C]9[/C][C]-0.031971[/C][C]-0.2713[/C][C]0.393476[/C][/ROW]
[ROW][C]10[/C][C]0.019872[/C][C]0.1686[/C][C]0.433284[/C][/ROW]
[ROW][C]11[/C][C]-0.060695[/C][C]-0.515[/C][C]0.304059[/C][/ROW]
[ROW][C]12[/C][C]0.004039[/C][C]0.0343[/C][C]0.486379[/C][/ROW]
[ROW][C]13[/C][C]0.032846[/C][C]0.2787[/C][C]0.390633[/C][/ROW]
[ROW][C]14[/C][C]-0.034122[/C][C]-0.2895[/C][C]0.386503[/C][/ROW]
[ROW][C]15[/C][C]0.104268[/C][C]0.8847[/C][C]0.189621[/C][/ROW]
[ROW][C]16[/C][C]-0.057612[/C][C]-0.4889[/C][C]0.313216[/C][/ROW]
[ROW][C]17[/C][C]-0.018658[/C][C]-0.1583[/C][C]0.437324[/C][/ROW]
[ROW][C]18[/C][C]-0.0223[/C][C]-0.1892[/C][C]0.425225[/C][/ROW]
[/TABLE]
Source: https://freestatistics.org/blog/index.php?pk=&T=2

Globally Unique Identifier (entire table): ba.freestatistics.org/blog/index.php?pk=&T=2

As an alternative you can also use a QR Code:  

The GUIDs for individual cells are displayed in the table below:

Partial Autocorrelation Function
Time lag kPACF(k)T-STATP-value
10.9675688.21010
2-0.129942-1.10260.136937
3-0.036784-0.31210.377926
4-0.029014-0.24620.403117
5-0.075517-0.64080.261849
6-0.065981-0.55990.288653
7-0.044431-0.3770.353637
8-0.014421-0.12240.451474
9-0.031971-0.27130.393476
100.0198720.16860.433284
11-0.060695-0.5150.304059
120.0040390.03430.486379
130.0328460.27870.390633
14-0.034122-0.28950.386503
150.1042680.88470.189621
16-0.057612-0.48890.313216
17-0.018658-0.15830.437324
18-0.0223-0.18920.425225


Parameters (Session):
par1 = Default ; par2 = 1 ; par3 = 0 ; par4 = 0 ; par5 = 12 ; par6 = White Noise ; par7 = 0.95 ;
Parameters (R input):
par1 = Default ; par2 = 1 ; par3 = 0 ; par4 = 0 ; par5 = 12 ; par6 = White Noise ; par7 = 0.95 ; par8 = ;
R code (references can be found in the software module):
if (par1 == 'Default') {
par1 = 10*log10(length(x))
} else {
par1 <- as.numeric(par1)
}
par2 <- as.numeric(par2)
par3 <- as.numeric(par3)
par4 <- as.numeric(par4)
par5 <- as.numeric(par5)
if (par6 == 'White Noise') par6 <- 'white' else par6 <- 'ma'
par7 <- as.numeric(par7)
if (par8 != '') par8 <- as.numeric(par8)
x <- na.omit(x)
ox <- x
if (par8 == '') {
if (par2 == 0) {
x <- log(x)
} else {
x <- (x ^ par2 - 1) / par2
}
} else {
x <- log(x,base=par8)
}
if (par3 > 0) x <- diff(x,lag=1,difference=par3)
if (par4 > 0) x <- diff(x,lag=par5,difference=par4)
bitmap(file='picts.png')
op <- par(mfrow=c(2,1))
plot(ox,type='l',main='Original Time Series',xlab='time',ylab='value')
if (par8=='') {
mytitle <- paste('Working Time Series (lambda=',par2,', d=',par3,', D=',par4,')',sep='')
mysub <- paste('(lambda=',par2,', d=',par3,', D=',par4,', CI=', par7, ', CI type=',par6,')',sep='')
} else {
mytitle <- paste('Working Time Series (base=',par8,', d=',par3,', D=',par4,')',sep='')
mysub <- paste('(base=',par8,', d=',par3,', D=',par4,', CI=', par7, ', CI type=',par6,')',sep='')
}
plot(x,type='l', main=mytitle,xlab='time',ylab='value')
par(op)
dev.off()
bitmap(file='pic1.png')
racf <- acf(x, par1, main='Autocorrelation', xlab='time lag', ylab='ACF', ci.type=par6, ci=par7, sub=mysub)
dev.off()
bitmap(file='pic2.png')
rpacf <- pacf(x,par1,main='Partial Autocorrelation',xlab='lags',ylab='PACF',sub=mysub)
dev.off()
(myacf <- c(racf$acf))
(mypacf <- c(rpacf$acf))
lengthx <- length(x)
sqrtn <- sqrt(lengthx)
load(file='createtable')
a<-table.start()
a<-table.row.start(a)
a<-table.element(a,'Autocorrelation Function',4,TRUE)
a<-table.row.end(a)
a<-table.row.start(a)
a<-table.element(a,'Time lag k',header=TRUE)
a<-table.element(a,hyperlink('basics.htm','ACF(k)','click here for more information about the Autocorrelation Function'),header=TRUE)
a<-table.element(a,'T-STAT',header=TRUE)
a<-table.element(a,'P-value',header=TRUE)
a<-table.row.end(a)
for (i in 2:(par1+1)) {
a<-table.row.start(a)
a<-table.element(a,i-1,header=TRUE)
a<-table.element(a,round(myacf[i],6))
mytstat <- myacf[i]*sqrtn
a<-table.element(a,round(mytstat,4))
a<-table.element(a,round(1-pt(abs(mytstat),lengthx),6))
a<-table.row.end(a)
}
a<-table.end(a)
table.save(a,file='mytable.tab')
a<-table.start()
a<-table.row.start(a)
a<-table.element(a,'Partial Autocorrelation Function',4,TRUE)
a<-table.row.end(a)
a<-table.row.start(a)
a<-table.element(a,'Time lag k',header=TRUE)
a<-table.element(a,hyperlink('basics.htm','PACF(k)','click here for more information about the Partial Autocorrelation Function'),header=TRUE)
a<-table.element(a,'T-STAT',header=TRUE)
a<-table.element(a,'P-value',header=TRUE)
a<-table.row.end(a)
for (i in 1:par1) {
a<-table.row.start(a)
a<-table.element(a,i,header=TRUE)
a<-table.element(a,round(mypacf[i],6))
mytstat <- mypacf[i]*sqrtn
a<-table.element(a,round(mytstat,4))
a<-table.element(a,round(1-pt(abs(mytstat),lengthx),6))
a<-table.row.end(a)
}
a<-table.end(a)
table.save(a,file='mytable1.tab')