Free Statistics

of Irreproducible Research!

Author's title

Author*Unverified author*
R Software Modulerwasp_autocorrelation.wasp
Title produced by software(Partial) Autocorrelation Function
Date of computationSun, 19 Mar 2017 21:57:51 +0000
Cite this page as followsStatistical Computations at FreeStatistics.org, Office for Research Development and Education, URL https://freestatistics.org/blog/index.php?v=date/2017/Mar/19/t1489960715ye2g3l5ckypcejq.htm/, Retrieved Thu, 16 May 2024 04:23:05 +0200
Statistical Computations at FreeStatistics.org, Office for Research Development and Education, URL https://freestatistics.org/blog/index.php?pk=, Retrieved Thu, 16 May 2024 04:23:05 +0200
QR Codes:

Original text written by user:
IsPrivate?No (this computation is public)
User-defined keywords
Estimated Impact0
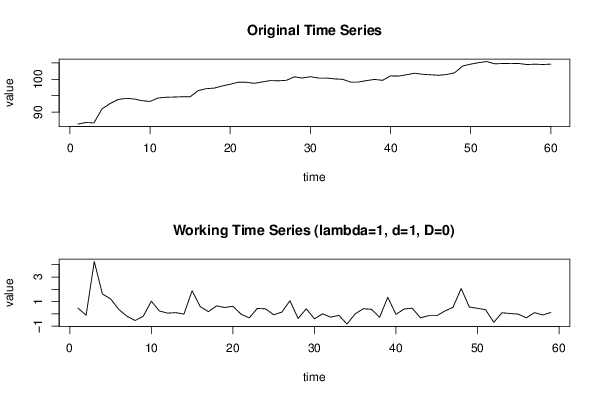
Dataseries X:
86.37	
86.84	
86.73	
90.99	
92.61	
93.83	
94.2	
94.01	
93.47	
93.27	
94.3	
94.53	
94.59	
94.69	
94.67	
96.55	
97.14	
97.32	
97.97	
98.49	
99.11	
99.09	
98.76	
99.2	
99.61	
99.54	
99.68	
100.75	
100.38	
100.79	
100.39	
100.39	
100.12	
100	
99.17	
99.17	
99.59	
99.96	
99.68	
101.03	
100.99	
101.38	
101.84	
101.52	
101.37	
101.22	
101.45	
101.99	
104.05	
104.61	
105.06	
105.4	
104.71	
104.8	
104.83	
104.81	
104.49	
104.59	
104.5	
104.61	


Summary of computational transaction
Raw Inputview raw input (R code)
Raw Outputview raw output of R engine
Computing time1 seconds
R Server'Herman Ole Andreas Wold' @ wold.wessa.net

\begin{tabular}{lllllllll}
\hline
Summary of computational transaction \tabularnewline
Raw Input & view raw input (R code)  \tabularnewline
Raw Output & view raw output of R engine  \tabularnewline
Computing time & 1 seconds \tabularnewline
R Server & 'Herman Ole Andreas Wold' @ wold.wessa.net \tabularnewline
\hline
\end{tabular}
%Source: https://freestatistics.org/blog/index.php?pk=&T=0

[TABLE]
[ROW][C]Summary of computational transaction[/C][/ROW]
[ROW][C]Raw Input[/C][C]view raw input (R code) [/C][/ROW]
[ROW][C]Raw Output[/C][C]view raw output of R engine [/C][/ROW]
[ROW][C]Computing time[/C][C]1 seconds[/C][/ROW]
[ROW][C]R Server[/C][C]'Herman Ole Andreas Wold' @ wold.wessa.net[/C][/ROW]
[/TABLE]
Source: https://freestatistics.org/blog/index.php?pk=&T=0

Globally Unique Identifier (entire table): ba.freestatistics.org/blog/index.php?pk=&T=0

As an alternative you can also use a QR Code:  

The GUIDs for individual cells are displayed in the table below:

Summary of computational transaction
Raw Inputview raw input (R code)
Raw Outputview raw output of R engine
Computing time1 seconds
R Server'Herman Ole Andreas Wold' @ wold.wessa.net


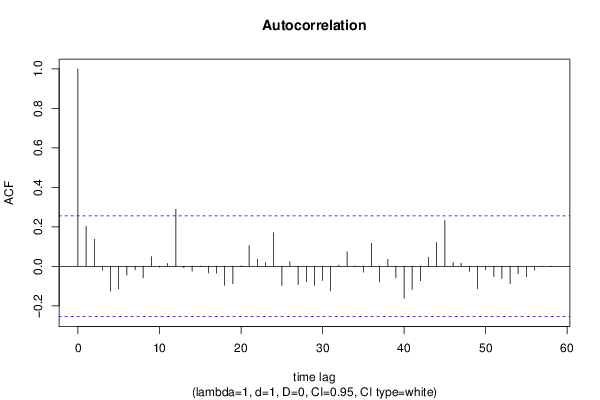
Autocorrelation Function
Time lag kACF(k)T-STATP-value
10.2029261.55870.062207
20.1363131.0470.149676
3-0.020246-0.15550.438475
4-0.124699-0.95780.171029
5-0.113489-0.87170.193446
6-0.044345-0.34060.3673
7-0.017722-0.13610.446092
8-0.057809-0.4440.32932
90.0487670.37460.354655
10-0.004164-0.0320.487297
110.0143260.110.456376
120.2883762.21510.015315
13-0.007094-0.05450.478365
14-0.02487-0.1910.424578
150.0014820.01140.495478
16-0.033938-0.26070.397623
17-0.034532-0.26520.395872
18-0.095877-0.73640.232188
19-0.087507-0.67220.252055
200.002870.0220.491245
210.1053680.80930.210784
220.0355170.27280.392974
230.0192440.14780.441497
240.170021.30590.09832
25-0.097688-0.75040.228011
260.023370.17950.429076
27-0.0918-0.70510.241752
28-0.077748-0.59720.27633
29-0.096563-0.74170.2306
30-0.072403-0.55610.290109
31-0.124045-0.95280.172287
320.0053810.04130.483586
330.0737440.56640.286622
340.0007320.00560.497767
35-0.029513-0.22670.410722
360.1161150.89190.188036
37-0.079212-0.60840.272617
380.0355370.2730.392917
39-0.05832-0.4480.327909
40-0.16176-1.24250.109484
41-0.116974-0.89850.186287
42-0.072801-0.55920.289074
430.045650.35060.363552
440.1200270.92190.180156
450.2321361.78310.039859
460.0190240.14610.442161
470.0148770.11430.454705
48-0.025485-0.19580.422737
49-0.113042-0.86830.194377
50-0.017218-0.13230.447616
51-0.05213-0.40040.345149
52-0.061811-0.47480.318348
53-0.087113-0.66910.253011
54-0.0378-0.29030.386284
55-0.053015-0.40720.342661
56-0.018701-0.14360.443134
570.0005520.00420.498316
58-0.000917-0.0070.497201
59NANANA
60NANANA

\begin{tabular}{lllllllll}
\hline
Autocorrelation Function \tabularnewline
Time lag k & ACF(k) & T-STAT & P-value \tabularnewline
1 & 0.202926 & 1.5587 & 0.062207 \tabularnewline
2 & 0.136313 & 1.047 & 0.149676 \tabularnewline
3 & -0.020246 & -0.1555 & 0.438475 \tabularnewline
4 & -0.124699 & -0.9578 & 0.171029 \tabularnewline
5 & -0.113489 & -0.8717 & 0.193446 \tabularnewline
6 & -0.044345 & -0.3406 & 0.3673 \tabularnewline
7 & -0.017722 & -0.1361 & 0.446092 \tabularnewline
8 & -0.057809 & -0.444 & 0.32932 \tabularnewline
9 & 0.048767 & 0.3746 & 0.354655 \tabularnewline
10 & -0.004164 & -0.032 & 0.487297 \tabularnewline
11 & 0.014326 & 0.11 & 0.456376 \tabularnewline
12 & 0.288376 & 2.2151 & 0.015315 \tabularnewline
13 & -0.007094 & -0.0545 & 0.478365 \tabularnewline
14 & -0.02487 & -0.191 & 0.424578 \tabularnewline
15 & 0.001482 & 0.0114 & 0.495478 \tabularnewline
16 & -0.033938 & -0.2607 & 0.397623 \tabularnewline
17 & -0.034532 & -0.2652 & 0.395872 \tabularnewline
18 & -0.095877 & -0.7364 & 0.232188 \tabularnewline
19 & -0.087507 & -0.6722 & 0.252055 \tabularnewline
20 & 0.00287 & 0.022 & 0.491245 \tabularnewline
21 & 0.105368 & 0.8093 & 0.210784 \tabularnewline
22 & 0.035517 & 0.2728 & 0.392974 \tabularnewline
23 & 0.019244 & 0.1478 & 0.441497 \tabularnewline
24 & 0.17002 & 1.3059 & 0.09832 \tabularnewline
25 & -0.097688 & -0.7504 & 0.228011 \tabularnewline
26 & 0.02337 & 0.1795 & 0.429076 \tabularnewline
27 & -0.0918 & -0.7051 & 0.241752 \tabularnewline
28 & -0.077748 & -0.5972 & 0.27633 \tabularnewline
29 & -0.096563 & -0.7417 & 0.2306 \tabularnewline
30 & -0.072403 & -0.5561 & 0.290109 \tabularnewline
31 & -0.124045 & -0.9528 & 0.172287 \tabularnewline
32 & 0.005381 & 0.0413 & 0.483586 \tabularnewline
33 & 0.073744 & 0.5664 & 0.286622 \tabularnewline
34 & 0.000732 & 0.0056 & 0.497767 \tabularnewline
35 & -0.029513 & -0.2267 & 0.410722 \tabularnewline
36 & 0.116115 & 0.8919 & 0.188036 \tabularnewline
37 & -0.079212 & -0.6084 & 0.272617 \tabularnewline
38 & 0.035537 & 0.273 & 0.392917 \tabularnewline
39 & -0.05832 & -0.448 & 0.327909 \tabularnewline
40 & -0.16176 & -1.2425 & 0.109484 \tabularnewline
41 & -0.116974 & -0.8985 & 0.186287 \tabularnewline
42 & -0.072801 & -0.5592 & 0.289074 \tabularnewline
43 & 0.04565 & 0.3506 & 0.363552 \tabularnewline
44 & 0.120027 & 0.9219 & 0.180156 \tabularnewline
45 & 0.232136 & 1.7831 & 0.039859 \tabularnewline
46 & 0.019024 & 0.1461 & 0.442161 \tabularnewline
47 & 0.014877 & 0.1143 & 0.454705 \tabularnewline
48 & -0.025485 & -0.1958 & 0.422737 \tabularnewline
49 & -0.113042 & -0.8683 & 0.194377 \tabularnewline
50 & -0.017218 & -0.1323 & 0.447616 \tabularnewline
51 & -0.05213 & -0.4004 & 0.345149 \tabularnewline
52 & -0.061811 & -0.4748 & 0.318348 \tabularnewline
53 & -0.087113 & -0.6691 & 0.253011 \tabularnewline
54 & -0.0378 & -0.2903 & 0.386284 \tabularnewline
55 & -0.053015 & -0.4072 & 0.342661 \tabularnewline
56 & -0.018701 & -0.1436 & 0.443134 \tabularnewline
57 & 0.000552 & 0.0042 & 0.498316 \tabularnewline
58 & -0.000917 & -0.007 & 0.497201 \tabularnewline
59 & NA & NA & NA \tabularnewline
60 & NA & NA & NA \tabularnewline
\hline
\end{tabular}
%Source: https://freestatistics.org/blog/index.php?pk=&T=1

[TABLE]
[ROW][C]Autocorrelation Function[/C][/ROW]
[ROW][C]Time lag k[/C][C]ACF(k)[/C][C]T-STAT[/C][C]P-value[/C][/ROW]
[ROW][C]1[/C][C]0.202926[/C][C]1.5587[/C][C]0.062207[/C][/ROW]
[ROW][C]2[/C][C]0.136313[/C][C]1.047[/C][C]0.149676[/C][/ROW]
[ROW][C]3[/C][C]-0.020246[/C][C]-0.1555[/C][C]0.438475[/C][/ROW]
[ROW][C]4[/C][C]-0.124699[/C][C]-0.9578[/C][C]0.171029[/C][/ROW]
[ROW][C]5[/C][C]-0.113489[/C][C]-0.8717[/C][C]0.193446[/C][/ROW]
[ROW][C]6[/C][C]-0.044345[/C][C]-0.3406[/C][C]0.3673[/C][/ROW]
[ROW][C]7[/C][C]-0.017722[/C][C]-0.1361[/C][C]0.446092[/C][/ROW]
[ROW][C]8[/C][C]-0.057809[/C][C]-0.444[/C][C]0.32932[/C][/ROW]
[ROW][C]9[/C][C]0.048767[/C][C]0.3746[/C][C]0.354655[/C][/ROW]
[ROW][C]10[/C][C]-0.004164[/C][C]-0.032[/C][C]0.487297[/C][/ROW]
[ROW][C]11[/C][C]0.014326[/C][C]0.11[/C][C]0.456376[/C][/ROW]
[ROW][C]12[/C][C]0.288376[/C][C]2.2151[/C][C]0.015315[/C][/ROW]
[ROW][C]13[/C][C]-0.007094[/C][C]-0.0545[/C][C]0.478365[/C][/ROW]
[ROW][C]14[/C][C]-0.02487[/C][C]-0.191[/C][C]0.424578[/C][/ROW]
[ROW][C]15[/C][C]0.001482[/C][C]0.0114[/C][C]0.495478[/C][/ROW]
[ROW][C]16[/C][C]-0.033938[/C][C]-0.2607[/C][C]0.397623[/C][/ROW]
[ROW][C]17[/C][C]-0.034532[/C][C]-0.2652[/C][C]0.395872[/C][/ROW]
[ROW][C]18[/C][C]-0.095877[/C][C]-0.7364[/C][C]0.232188[/C][/ROW]
[ROW][C]19[/C][C]-0.087507[/C][C]-0.6722[/C][C]0.252055[/C][/ROW]
[ROW][C]20[/C][C]0.00287[/C][C]0.022[/C][C]0.491245[/C][/ROW]
[ROW][C]21[/C][C]0.105368[/C][C]0.8093[/C][C]0.210784[/C][/ROW]
[ROW][C]22[/C][C]0.035517[/C][C]0.2728[/C][C]0.392974[/C][/ROW]
[ROW][C]23[/C][C]0.019244[/C][C]0.1478[/C][C]0.441497[/C][/ROW]
[ROW][C]24[/C][C]0.17002[/C][C]1.3059[/C][C]0.09832[/C][/ROW]
[ROW][C]25[/C][C]-0.097688[/C][C]-0.7504[/C][C]0.228011[/C][/ROW]
[ROW][C]26[/C][C]0.02337[/C][C]0.1795[/C][C]0.429076[/C][/ROW]
[ROW][C]27[/C][C]-0.0918[/C][C]-0.7051[/C][C]0.241752[/C][/ROW]
[ROW][C]28[/C][C]-0.077748[/C][C]-0.5972[/C][C]0.27633[/C][/ROW]
[ROW][C]29[/C][C]-0.096563[/C][C]-0.7417[/C][C]0.2306[/C][/ROW]
[ROW][C]30[/C][C]-0.072403[/C][C]-0.5561[/C][C]0.290109[/C][/ROW]
[ROW][C]31[/C][C]-0.124045[/C][C]-0.9528[/C][C]0.172287[/C][/ROW]
[ROW][C]32[/C][C]0.005381[/C][C]0.0413[/C][C]0.483586[/C][/ROW]
[ROW][C]33[/C][C]0.073744[/C][C]0.5664[/C][C]0.286622[/C][/ROW]
[ROW][C]34[/C][C]0.000732[/C][C]0.0056[/C][C]0.497767[/C][/ROW]
[ROW][C]35[/C][C]-0.029513[/C][C]-0.2267[/C][C]0.410722[/C][/ROW]
[ROW][C]36[/C][C]0.116115[/C][C]0.8919[/C][C]0.188036[/C][/ROW]
[ROW][C]37[/C][C]-0.079212[/C][C]-0.6084[/C][C]0.272617[/C][/ROW]
[ROW][C]38[/C][C]0.035537[/C][C]0.273[/C][C]0.392917[/C][/ROW]
[ROW][C]39[/C][C]-0.05832[/C][C]-0.448[/C][C]0.327909[/C][/ROW]
[ROW][C]40[/C][C]-0.16176[/C][C]-1.2425[/C][C]0.109484[/C][/ROW]
[ROW][C]41[/C][C]-0.116974[/C][C]-0.8985[/C][C]0.186287[/C][/ROW]
[ROW][C]42[/C][C]-0.072801[/C][C]-0.5592[/C][C]0.289074[/C][/ROW]
[ROW][C]43[/C][C]0.04565[/C][C]0.3506[/C][C]0.363552[/C][/ROW]
[ROW][C]44[/C][C]0.120027[/C][C]0.9219[/C][C]0.180156[/C][/ROW]
[ROW][C]45[/C][C]0.232136[/C][C]1.7831[/C][C]0.039859[/C][/ROW]
[ROW][C]46[/C][C]0.019024[/C][C]0.1461[/C][C]0.442161[/C][/ROW]
[ROW][C]47[/C][C]0.014877[/C][C]0.1143[/C][C]0.454705[/C][/ROW]
[ROW][C]48[/C][C]-0.025485[/C][C]-0.1958[/C][C]0.422737[/C][/ROW]
[ROW][C]49[/C][C]-0.113042[/C][C]-0.8683[/C][C]0.194377[/C][/ROW]
[ROW][C]50[/C][C]-0.017218[/C][C]-0.1323[/C][C]0.447616[/C][/ROW]
[ROW][C]51[/C][C]-0.05213[/C][C]-0.4004[/C][C]0.345149[/C][/ROW]
[ROW][C]52[/C][C]-0.061811[/C][C]-0.4748[/C][C]0.318348[/C][/ROW]
[ROW][C]53[/C][C]-0.087113[/C][C]-0.6691[/C][C]0.253011[/C][/ROW]
[ROW][C]54[/C][C]-0.0378[/C][C]-0.2903[/C][C]0.386284[/C][/ROW]
[ROW][C]55[/C][C]-0.053015[/C][C]-0.4072[/C][C]0.342661[/C][/ROW]
[ROW][C]56[/C][C]-0.018701[/C][C]-0.1436[/C][C]0.443134[/C][/ROW]
[ROW][C]57[/C][C]0.000552[/C][C]0.0042[/C][C]0.498316[/C][/ROW]
[ROW][C]58[/C][C]-0.000917[/C][C]-0.007[/C][C]0.497201[/C][/ROW]
[ROW][C]59[/C][C]NA[/C][C]NA[/C][C]NA[/C][/ROW]
[ROW][C]60[/C][C]NA[/C][C]NA[/C][C]NA[/C][/ROW]
[/TABLE]
Source: https://freestatistics.org/blog/index.php?pk=&T=1

Globally Unique Identifier (entire table): ba.freestatistics.org/blog/index.php?pk=&T=1

As an alternative you can also use a QR Code:  

The GUIDs for individual cells are displayed in the table below:

Autocorrelation Function
Time lag kACF(k)T-STATP-value
10.2029261.55870.062207
20.1363131.0470.149676
3-0.020246-0.15550.438475
4-0.124699-0.95780.171029
5-0.113489-0.87170.193446
6-0.044345-0.34060.3673
7-0.017722-0.13610.446092
8-0.057809-0.4440.32932
90.0487670.37460.354655
10-0.004164-0.0320.487297
110.0143260.110.456376
120.2883762.21510.015315
13-0.007094-0.05450.478365
14-0.02487-0.1910.424578
150.0014820.01140.495478
16-0.033938-0.26070.397623
17-0.034532-0.26520.395872
18-0.095877-0.73640.232188
19-0.087507-0.67220.252055
200.002870.0220.491245
210.1053680.80930.210784
220.0355170.27280.392974
230.0192440.14780.441497
240.170021.30590.09832
25-0.097688-0.75040.228011
260.023370.17950.429076
27-0.0918-0.70510.241752
28-0.077748-0.59720.27633
29-0.096563-0.74170.2306
30-0.072403-0.55610.290109
31-0.124045-0.95280.172287
320.0053810.04130.483586
330.0737440.56640.286622
340.0007320.00560.497767
35-0.029513-0.22670.410722
360.1161150.89190.188036
37-0.079212-0.60840.272617
380.0355370.2730.392917
39-0.05832-0.4480.327909
40-0.16176-1.24250.109484
41-0.116974-0.89850.186287
42-0.072801-0.55920.289074
430.045650.35060.363552
440.1200270.92190.180156
450.2321361.78310.039859
460.0190240.14610.442161
470.0148770.11430.454705
48-0.025485-0.19580.422737
49-0.113042-0.86830.194377
50-0.017218-0.13230.447616
51-0.05213-0.40040.345149
52-0.061811-0.47480.318348
53-0.087113-0.66910.253011
54-0.0378-0.29030.386284
55-0.053015-0.40720.342661
56-0.018701-0.14360.443134
570.0005520.00420.498316
58-0.000917-0.0070.497201
59NANANA
60NANANA


Partial Autocorrelation Function
Time lag kPACF(k)T-STATP-value
10.2029261.55870.062207
20.0992190.76210.224512
3-0.068778-0.52830.299638
4-0.129265-0.99290.162405
5-0.060415-0.46410.322159
60.019810.15220.43979
70.0022120.0170.493251
8-0.078487-0.60290.274453
90.054950.42210.337251
10-0.014966-0.1150.454437
11-0.000624-0.00480.498095
120.2998242.3030.012411
13-0.131153-1.00740.158927
14-0.090984-0.69890.243692
150.0717630.55120.291782
160.0315340.24220.404724
17-0.005717-0.04390.482562
18-0.139225-1.06940.144621
19-0.065489-0.5030.308409
200.134551.03350.152795
210.0804290.61780.269548
22-0.043996-0.33790.368305
23-0.04596-0.3530.362662
240.1031860.79260.215596
25-0.079834-0.61320.271045
260.0824890.63360.264392
27-0.132959-1.02130.155646
28-0.067425-0.51790.303232
29-0.033277-0.25560.399572
300.0278820.21420.415578
31-0.08888-0.68270.248734
32-0.021042-0.16160.436075
33-0.011247-0.08640.465725
340.0351880.27030.393941
35-0.061687-0.47380.318686
360.0408190.31350.377489
37-0.065081-0.49990.309503
380.0366210.28130.389735
39-0.015228-0.1170.453642
40-0.150423-1.15540.126287
41-0.072456-0.55650.289972
420.0276070.21210.416398
430.1695031.3020.098993
440.0619090.47550.318082
450.0458820.35240.362888
46-0.102475-0.78710.217179
470.0635010.48780.313763
48-0.037319-0.28670.387692
49-0.01784-0.1370.445735
50-0.063939-0.49110.31258
510.020140.15470.438793
520.0371880.28560.388075
53-0.050417-0.38730.349978
54-0.089737-0.68930.246675
55-0.055144-0.42360.33671
56-0.063961-0.49130.312522
57-0.040487-0.3110.378453
580.0136210.10460.458514
59NANANA
60NANANA

\begin{tabular}{lllllllll}
\hline
Partial Autocorrelation Function \tabularnewline
Time lag k & PACF(k) & T-STAT & P-value \tabularnewline
1 & 0.202926 & 1.5587 & 0.062207 \tabularnewline
2 & 0.099219 & 0.7621 & 0.224512 \tabularnewline
3 & -0.068778 & -0.5283 & 0.299638 \tabularnewline
4 & -0.129265 & -0.9929 & 0.162405 \tabularnewline
5 & -0.060415 & -0.4641 & 0.322159 \tabularnewline
6 & 0.01981 & 0.1522 & 0.43979 \tabularnewline
7 & 0.002212 & 0.017 & 0.493251 \tabularnewline
8 & -0.078487 & -0.6029 & 0.274453 \tabularnewline
9 & 0.05495 & 0.4221 & 0.337251 \tabularnewline
10 & -0.014966 & -0.115 & 0.454437 \tabularnewline
11 & -0.000624 & -0.0048 & 0.498095 \tabularnewline
12 & 0.299824 & 2.303 & 0.012411 \tabularnewline
13 & -0.131153 & -1.0074 & 0.158927 \tabularnewline
14 & -0.090984 & -0.6989 & 0.243692 \tabularnewline
15 & 0.071763 & 0.5512 & 0.291782 \tabularnewline
16 & 0.031534 & 0.2422 & 0.404724 \tabularnewline
17 & -0.005717 & -0.0439 & 0.482562 \tabularnewline
18 & -0.139225 & -1.0694 & 0.144621 \tabularnewline
19 & -0.065489 & -0.503 & 0.308409 \tabularnewline
20 & 0.13455 & 1.0335 & 0.152795 \tabularnewline
21 & 0.080429 & 0.6178 & 0.269548 \tabularnewline
22 & -0.043996 & -0.3379 & 0.368305 \tabularnewline
23 & -0.04596 & -0.353 & 0.362662 \tabularnewline
24 & 0.103186 & 0.7926 & 0.215596 \tabularnewline
25 & -0.079834 & -0.6132 & 0.271045 \tabularnewline
26 & 0.082489 & 0.6336 & 0.264392 \tabularnewline
27 & -0.132959 & -1.0213 & 0.155646 \tabularnewline
28 & -0.067425 & -0.5179 & 0.303232 \tabularnewline
29 & -0.033277 & -0.2556 & 0.399572 \tabularnewline
30 & 0.027882 & 0.2142 & 0.415578 \tabularnewline
31 & -0.08888 & -0.6827 & 0.248734 \tabularnewline
32 & -0.021042 & -0.1616 & 0.436075 \tabularnewline
33 & -0.011247 & -0.0864 & 0.465725 \tabularnewline
34 & 0.035188 & 0.2703 & 0.393941 \tabularnewline
35 & -0.061687 & -0.4738 & 0.318686 \tabularnewline
36 & 0.040819 & 0.3135 & 0.377489 \tabularnewline
37 & -0.065081 & -0.4999 & 0.309503 \tabularnewline
38 & 0.036621 & 0.2813 & 0.389735 \tabularnewline
39 & -0.015228 & -0.117 & 0.453642 \tabularnewline
40 & -0.150423 & -1.1554 & 0.126287 \tabularnewline
41 & -0.072456 & -0.5565 & 0.289972 \tabularnewline
42 & 0.027607 & 0.2121 & 0.416398 \tabularnewline
43 & 0.169503 & 1.302 & 0.098993 \tabularnewline
44 & 0.061909 & 0.4755 & 0.318082 \tabularnewline
45 & 0.045882 & 0.3524 & 0.362888 \tabularnewline
46 & -0.102475 & -0.7871 & 0.217179 \tabularnewline
47 & 0.063501 & 0.4878 & 0.313763 \tabularnewline
48 & -0.037319 & -0.2867 & 0.387692 \tabularnewline
49 & -0.01784 & -0.137 & 0.445735 \tabularnewline
50 & -0.063939 & -0.4911 & 0.31258 \tabularnewline
51 & 0.02014 & 0.1547 & 0.438793 \tabularnewline
52 & 0.037188 & 0.2856 & 0.388075 \tabularnewline
53 & -0.050417 & -0.3873 & 0.349978 \tabularnewline
54 & -0.089737 & -0.6893 & 0.246675 \tabularnewline
55 & -0.055144 & -0.4236 & 0.33671 \tabularnewline
56 & -0.063961 & -0.4913 & 0.312522 \tabularnewline
57 & -0.040487 & -0.311 & 0.378453 \tabularnewline
58 & 0.013621 & 0.1046 & 0.458514 \tabularnewline
59 & NA & NA & NA \tabularnewline
60 & NA & NA & NA \tabularnewline
\hline
\end{tabular}
%Source: https://freestatistics.org/blog/index.php?pk=&T=2

[TABLE]
[ROW][C]Partial Autocorrelation Function[/C][/ROW]
[ROW][C]Time lag k[/C][C]PACF(k)[/C][C]T-STAT[/C][C]P-value[/C][/ROW]
[ROW][C]1[/C][C]0.202926[/C][C]1.5587[/C][C]0.062207[/C][/ROW]
[ROW][C]2[/C][C]0.099219[/C][C]0.7621[/C][C]0.224512[/C][/ROW]
[ROW][C]3[/C][C]-0.068778[/C][C]-0.5283[/C][C]0.299638[/C][/ROW]
[ROW][C]4[/C][C]-0.129265[/C][C]-0.9929[/C][C]0.162405[/C][/ROW]
[ROW][C]5[/C][C]-0.060415[/C][C]-0.4641[/C][C]0.322159[/C][/ROW]
[ROW][C]6[/C][C]0.01981[/C][C]0.1522[/C][C]0.43979[/C][/ROW]
[ROW][C]7[/C][C]0.002212[/C][C]0.017[/C][C]0.493251[/C][/ROW]
[ROW][C]8[/C][C]-0.078487[/C][C]-0.6029[/C][C]0.274453[/C][/ROW]
[ROW][C]9[/C][C]0.05495[/C][C]0.4221[/C][C]0.337251[/C][/ROW]
[ROW][C]10[/C][C]-0.014966[/C][C]-0.115[/C][C]0.454437[/C][/ROW]
[ROW][C]11[/C][C]-0.000624[/C][C]-0.0048[/C][C]0.498095[/C][/ROW]
[ROW][C]12[/C][C]0.299824[/C][C]2.303[/C][C]0.012411[/C][/ROW]
[ROW][C]13[/C][C]-0.131153[/C][C]-1.0074[/C][C]0.158927[/C][/ROW]
[ROW][C]14[/C][C]-0.090984[/C][C]-0.6989[/C][C]0.243692[/C][/ROW]
[ROW][C]15[/C][C]0.071763[/C][C]0.5512[/C][C]0.291782[/C][/ROW]
[ROW][C]16[/C][C]0.031534[/C][C]0.2422[/C][C]0.404724[/C][/ROW]
[ROW][C]17[/C][C]-0.005717[/C][C]-0.0439[/C][C]0.482562[/C][/ROW]
[ROW][C]18[/C][C]-0.139225[/C][C]-1.0694[/C][C]0.144621[/C][/ROW]
[ROW][C]19[/C][C]-0.065489[/C][C]-0.503[/C][C]0.308409[/C][/ROW]
[ROW][C]20[/C][C]0.13455[/C][C]1.0335[/C][C]0.152795[/C][/ROW]
[ROW][C]21[/C][C]0.080429[/C][C]0.6178[/C][C]0.269548[/C][/ROW]
[ROW][C]22[/C][C]-0.043996[/C][C]-0.3379[/C][C]0.368305[/C][/ROW]
[ROW][C]23[/C][C]-0.04596[/C][C]-0.353[/C][C]0.362662[/C][/ROW]
[ROW][C]24[/C][C]0.103186[/C][C]0.7926[/C][C]0.215596[/C][/ROW]
[ROW][C]25[/C][C]-0.079834[/C][C]-0.6132[/C][C]0.271045[/C][/ROW]
[ROW][C]26[/C][C]0.082489[/C][C]0.6336[/C][C]0.264392[/C][/ROW]
[ROW][C]27[/C][C]-0.132959[/C][C]-1.0213[/C][C]0.155646[/C][/ROW]
[ROW][C]28[/C][C]-0.067425[/C][C]-0.5179[/C][C]0.303232[/C][/ROW]
[ROW][C]29[/C][C]-0.033277[/C][C]-0.2556[/C][C]0.399572[/C][/ROW]
[ROW][C]30[/C][C]0.027882[/C][C]0.2142[/C][C]0.415578[/C][/ROW]
[ROW][C]31[/C][C]-0.08888[/C][C]-0.6827[/C][C]0.248734[/C][/ROW]
[ROW][C]32[/C][C]-0.021042[/C][C]-0.1616[/C][C]0.436075[/C][/ROW]
[ROW][C]33[/C][C]-0.011247[/C][C]-0.0864[/C][C]0.465725[/C][/ROW]
[ROW][C]34[/C][C]0.035188[/C][C]0.2703[/C][C]0.393941[/C][/ROW]
[ROW][C]35[/C][C]-0.061687[/C][C]-0.4738[/C][C]0.318686[/C][/ROW]
[ROW][C]36[/C][C]0.040819[/C][C]0.3135[/C][C]0.377489[/C][/ROW]
[ROW][C]37[/C][C]-0.065081[/C][C]-0.4999[/C][C]0.309503[/C][/ROW]
[ROW][C]38[/C][C]0.036621[/C][C]0.2813[/C][C]0.389735[/C][/ROW]
[ROW][C]39[/C][C]-0.015228[/C][C]-0.117[/C][C]0.453642[/C][/ROW]
[ROW][C]40[/C][C]-0.150423[/C][C]-1.1554[/C][C]0.126287[/C][/ROW]
[ROW][C]41[/C][C]-0.072456[/C][C]-0.5565[/C][C]0.289972[/C][/ROW]
[ROW][C]42[/C][C]0.027607[/C][C]0.2121[/C][C]0.416398[/C][/ROW]
[ROW][C]43[/C][C]0.169503[/C][C]1.302[/C][C]0.098993[/C][/ROW]
[ROW][C]44[/C][C]0.061909[/C][C]0.4755[/C][C]0.318082[/C][/ROW]
[ROW][C]45[/C][C]0.045882[/C][C]0.3524[/C][C]0.362888[/C][/ROW]
[ROW][C]46[/C][C]-0.102475[/C][C]-0.7871[/C][C]0.217179[/C][/ROW]
[ROW][C]47[/C][C]0.063501[/C][C]0.4878[/C][C]0.313763[/C][/ROW]
[ROW][C]48[/C][C]-0.037319[/C][C]-0.2867[/C][C]0.387692[/C][/ROW]
[ROW][C]49[/C][C]-0.01784[/C][C]-0.137[/C][C]0.445735[/C][/ROW]
[ROW][C]50[/C][C]-0.063939[/C][C]-0.4911[/C][C]0.31258[/C][/ROW]
[ROW][C]51[/C][C]0.02014[/C][C]0.1547[/C][C]0.438793[/C][/ROW]
[ROW][C]52[/C][C]0.037188[/C][C]0.2856[/C][C]0.388075[/C][/ROW]
[ROW][C]53[/C][C]-0.050417[/C][C]-0.3873[/C][C]0.349978[/C][/ROW]
[ROW][C]54[/C][C]-0.089737[/C][C]-0.6893[/C][C]0.246675[/C][/ROW]
[ROW][C]55[/C][C]-0.055144[/C][C]-0.4236[/C][C]0.33671[/C][/ROW]
[ROW][C]56[/C][C]-0.063961[/C][C]-0.4913[/C][C]0.312522[/C][/ROW]
[ROW][C]57[/C][C]-0.040487[/C][C]-0.311[/C][C]0.378453[/C][/ROW]
[ROW][C]58[/C][C]0.013621[/C][C]0.1046[/C][C]0.458514[/C][/ROW]
[ROW][C]59[/C][C]NA[/C][C]NA[/C][C]NA[/C][/ROW]
[ROW][C]60[/C][C]NA[/C][C]NA[/C][C]NA[/C][/ROW]
[/TABLE]
Source: https://freestatistics.org/blog/index.php?pk=&T=2

Globally Unique Identifier (entire table): ba.freestatistics.org/blog/index.php?pk=&T=2

As an alternative you can also use a QR Code:  

The GUIDs for individual cells are displayed in the table below:

Partial Autocorrelation Function
Time lag kPACF(k)T-STATP-value
10.2029261.55870.062207
20.0992190.76210.224512
3-0.068778-0.52830.299638
4-0.129265-0.99290.162405
5-0.060415-0.46410.322159
60.019810.15220.43979
70.0022120.0170.493251
8-0.078487-0.60290.274453
90.054950.42210.337251
10-0.014966-0.1150.454437
11-0.000624-0.00480.498095
120.2998242.3030.012411
13-0.131153-1.00740.158927
14-0.090984-0.69890.243692
150.0717630.55120.291782
160.0315340.24220.404724
17-0.005717-0.04390.482562
18-0.139225-1.06940.144621
19-0.065489-0.5030.308409
200.134551.03350.152795
210.0804290.61780.269548
22-0.043996-0.33790.368305
23-0.04596-0.3530.362662
240.1031860.79260.215596
25-0.079834-0.61320.271045
260.0824890.63360.264392
27-0.132959-1.02130.155646
28-0.067425-0.51790.303232
29-0.033277-0.25560.399572
300.0278820.21420.415578
31-0.08888-0.68270.248734
32-0.021042-0.16160.436075
33-0.011247-0.08640.465725
340.0351880.27030.393941
35-0.061687-0.47380.318686
360.0408190.31350.377489
37-0.065081-0.49990.309503
380.0366210.28130.389735
39-0.015228-0.1170.453642
40-0.150423-1.15540.126287
41-0.072456-0.55650.289972
420.0276070.21210.416398
430.1695031.3020.098993
440.0619090.47550.318082
450.0458820.35240.362888
46-0.102475-0.78710.217179
470.0635010.48780.313763
48-0.037319-0.28670.387692
49-0.01784-0.1370.445735
50-0.063939-0.49110.31258
510.020140.15470.438793
520.0371880.28560.388075
53-0.050417-0.38730.349978
54-0.089737-0.68930.246675
55-0.055144-0.42360.33671
56-0.063961-0.49130.312522
57-0.040487-0.3110.378453
580.0136210.10460.458514
59NANANA
60NANANA


Parameters (Session):
par1 = 12 ;
Parameters (R input):
par1 = 60 ; par2 = 1 ; par3 = 1 ; par4 = 0 ; par5 = 12 ; par6 = White Noise ; par7 = 0.95 ; par8 = ;
R code (references can be found in the software module):
par8 <- ''
par7 <- '0.95'
par6 <- 'White Noise'
par5 <- '12'
par4 <- '0'
par3 <- '0'
par2 <- '1'
par1 <- '60'
if (par1 == 'Default') {
par1 = 10*log10(length(x))
} else {
par1 <- as.numeric(par1)
}
par2 <- as.numeric(par2)
par3 <- as.numeric(par3)
par4 <- as.numeric(par4)
par5 <- as.numeric(par5)
if (par6 == 'White Noise') par6 <- 'white' else par6 <- 'ma'
par7 <- as.numeric(par7)
if (par8 != '') par8 <- as.numeric(par8)
x <- na.omit(x)
ox <- x
if (par8 == '') {
if (par2 == 0) {
x <- log(x)
} else {
x <- (x ^ par2 - 1) / par2
}
} else {
x <- log(x,base=par8)
}
if (par3 > 0) x <- diff(x,lag=1,difference=par3)
if (par4 > 0) x <- diff(x,lag=par5,difference=par4)
bitmap(file='picts.png')
op <- par(mfrow=c(2,1))
plot(ox,type='l',main='Original Time Series',xlab='time',ylab='value')
if (par8=='') {
mytitle <- paste('Working Time Series (lambda=',par2,', d=',par3,', D=',par4,')',sep='')
mysub <- paste('(lambda=',par2,', d=',par3,', D=',par4,', CI=', par7, ', CI type=',par6,')',sep='')
} else {
mytitle <- paste('Working Time Series (base=',par8,', d=',par3,', D=',par4,')',sep='')
mysub <- paste('(base=',par8,', d=',par3,', D=',par4,', CI=', par7, ', CI type=',par6,')',sep='')
}
plot(x,type='l', main=mytitle,xlab='time',ylab='value')
par(op)
dev.off()
bitmap(file='pic1.png')
racf <- acf(x, par1, main='Autocorrelation', xlab='time lag', ylab='ACF', ci.type=par6, ci=par7, sub=mysub)
dev.off()
bitmap(file='pic2.png')
rpacf <- pacf(x,par1,main='Partial Autocorrelation',xlab='lags',ylab='PACF',sub=mysub)
dev.off()
(myacf <- c(racf$acf))
(mypacf <- c(rpacf$acf))
lengthx <- length(x)
sqrtn <- sqrt(lengthx)
load(file='createtable')
a<-table.start()
a<-table.row.start(a)
a<-table.element(a,'Autocorrelation Function',4,TRUE)
a<-table.row.end(a)
a<-table.row.start(a)
a<-table.element(a,'Time lag k',header=TRUE)
a<-table.element(a,hyperlink('basics.htm','ACF(k)','click here for more information about the Autocorrelation Function'),header=TRUE)
a<-table.element(a,'T-STAT',header=TRUE)
a<-table.element(a,'P-value',header=TRUE)
a<-table.row.end(a)
for (i in 2:(par1+1)) {
a<-table.row.start(a)
a<-table.element(a,i-1,header=TRUE)
a<-table.element(a,round(myacf[i],6))
mytstat <- myacf[i]*sqrtn
a<-table.element(a,round(mytstat,4))
a<-table.element(a,round(1-pt(abs(mytstat),lengthx),6))
a<-table.row.end(a)
}
a<-table.end(a)
table.save(a,file='mytable.tab')
a<-table.start()
a<-table.row.start(a)
a<-table.element(a,'Partial Autocorrelation Function',4,TRUE)
a<-table.row.end(a)
a<-table.row.start(a)
a<-table.element(a,'Time lag k',header=TRUE)
a<-table.element(a,hyperlink('basics.htm','PACF(k)','click here for more information about the Partial Autocorrelation Function'),header=TRUE)
a<-table.element(a,'T-STAT',header=TRUE)
a<-table.element(a,'P-value',header=TRUE)
a<-table.row.end(a)
for (i in 1:par1) {
a<-table.row.start(a)
a<-table.element(a,i,header=TRUE)
a<-table.element(a,round(mypacf[i],6))
mytstat <- mypacf[i]*sqrtn
a<-table.element(a,round(mytstat,4))
a<-table.element(a,round(1-pt(abs(mytstat),lengthx),6))
a<-table.row.end(a)
}
a<-table.end(a)
table.save(a,file='mytable1.tab')