Free Statistics

of Irreproducible Research!

Author's title

Author*The author of this computation has been verified*
R Software Modulerwasp_multipleregression.wasp
Title produced by softwareMultiple Regression
Date of computationThu, 02 Nov 2017 17:56:51 +0100
Cite this page as followsStatistical Computations at FreeStatistics.org, Office for Research Development and Education, URL https://freestatistics.org/blog/index.php?v=date/2017/Nov/02/t1509641827v6805wa1hqyh0gb.htm/, Retrieved Fri, 17 May 2024 07:17:22 +0000
Statistical Computations at FreeStatistics.org, Office for Research Development and Education, URL https://freestatistics.org/blog/index.php?pk=308075, Retrieved Fri, 17 May 2024 07:17:22 +0000
QR Codes:

Original text written by user:
IsPrivate?No (this computation is public)
User-defined keywords
Estimated Impact132
Family? (F = Feedback message, R = changed R code, M = changed R Module, P = changed Parameters, D = changed Data)
-       [Multiple Regression] [] [2017-11-02 16:56:51] [b4ce4907781ca48e64ab853e8b6ed861] [Current]
Feedback Forum

Post a new message
Dataseries X:
2570 5331 2.88 -5
2669 3075 2.62 -1
2450 2002 2.39 -2
2842 2306 1.7 -5
3440 1507 1.96 -4
2678 1992 2.2 -6
2981 2487 1.87 -2
2260 3490 1.61 -2
2844 4647 1.63 -2
2546 5594 1.23 -2
2456 5611 1.21 2
2295 5788 1.49 1
2379 6204 1.64 -8
2471 3013 1.67 -1
2057 1931 1.77 1
2280 2549 1.81 -1
2351 1504 1.78 2
2276 2090 1.28 2
2548 2702 1.29 1
2311 2939 1.37 -1
2201 4500 1.12 -2
2725 6208 1.5 -2
2408 6415 2.24 -1
2139 5657 2.95 -8
1898 5964 3.08 -4
2539 3163 3.46 -6
2070 1997 3.65 -3
2063 2422 4.39 -3
2565 1376 4.16 -7
2443 2202 5.21 -9
2196 2683 5.8 -11
2799 3303 5.9 -13
2076 5202 5.39 -11
2628 5231 5.47 -9
2292 4880 4.72 -17
2155 7998 3.14 -22
2476 4977 2.63 -25
2138 3531 2.32 -20
1854 2025 1.93 -24
2081 2205 0.62 -24
1795 1442 0.6 -22
1756 2238 -0.37 -19
2237 2179 -1.1 -18
1960 3218 -1.68 -17
1829 5139 -0.77 -11
2524 4990 -1.2 -11
2077 4914 -0.97 -12
2366 6084 -0.12 -10
2185 5672 0.26 -15
2098 3548 0.62 -15
1836 1793 0.7 -15
1863 2086 1.65 -13
2044 1262 1.79 -8
2136 1743 2.28 -13
2931 1964 2.46 -9
3263 3258 2.57 -7
3328 4966 2.32 -4
3570 4944 2.91 -4
2313 5907 3.01 -2
1623 5561 2.87 0
1316 5321 3.11 -2
1507 3582 3.22 -3
1419 1757 3.38 1
1660 1894 3.52 -2
1790 1192 3.41 -1
1733 1658 3.35 1
2086 1919 3.68 -3
1814 3354 3.75 -4
2241 4529 3.6 -9
1943 5233 3.56 -9
1773 5910 3.57 -7
2143 5164 3.85 -14
2087 5152 3.48 -12
1805 3057 3.65 -16
1913 1855 3.66 -20
2296 1978 3.36 -12
2500 1255 3.19 -12
2210 1693 2.81 -10
2526 2449 2.25 -10
2249 3178 2.32 -13
2024 4831 2.85 -16
2091 6025 2.75 -14
2045 4492 2.78 -17
1882 5174 2.26 -24
1831 5600 2.23 -25
1964 2752 1.46 -23
1763 1925 1.19 -17
1688 2824 1.11 -24
2149 1041 1 -20
1823 1476 1.18 -19
2094 2239 1.59 -18
2145 2727 1.51 -16
1791 4303 1.01 -12
1996 5160 0.9 -7
2097 4103 0.63 -6
1796 5554 0.81 -6
1963 4906 0.97 -5
2042 2677 1.14 -4
1746 1677 0.97 -4
2210 1991 0.89 -8
2968 993 0.62 -9
3126 1800 0.36 -6
3708 2012 0.27 -7
3015 2880 0.34 -10
1569 4705 0.02 -11
1518 5107 -0.12 -11
1393 4482 0.09 -12
1615 5966 -0.11 -14
1777 4858 -0.38 -12
1648 3036 -0.65 -9
1463 1844 -0.4 -5
1779 2196 -0.4 -6


Summary of computational transaction
Raw Input view raw input (R code)
Raw Outputview raw output of R engine
Computing time8 seconds
R ServerBig Analytics Cloud Computing Center

\begin{tabular}{lllllllll}
\hline
Summary of computational transaction \tabularnewline
Raw Input view raw input (R code)  \tabularnewline
Raw Outputview raw output of R engine  \tabularnewline
Computing time8 seconds \tabularnewline
R ServerBig Analytics Cloud Computing Center \tabularnewline
\hline
\end{tabular}
%Source: https://freestatistics.org/blog/index.php?pk=308075&T=0

[TABLE]
[ROW]
Summary of computational transaction[/C][/ROW] [ROW]Raw Input[/C] view raw input (R code) [/C][/ROW] [ROW]Raw Output[/C]view raw output of R engine [/C][/ROW] [ROW]Computing time[/C]8 seconds[/C][/ROW] [ROW]R Server[/C]Big Analytics Cloud Computing Center[/C][/ROW] [/TABLE] Source: https://freestatistics.org/blog/index.php?pk=308075&T=0

Globally Unique Identifier (entire table): ba.freestatistics.org/blog/index.php?pk=308075&T=0

As an alternative you can also use a QR Code:  

The GUIDs for individual cells are displayed in the table below:

Summary of computational transaction
Raw Input view raw input (R code)
Raw Outputview raw output of R engine
Computing time8 seconds
R ServerBig Analytics Cloud Computing Center


Multiple Linear Regression - Estimated Regression Equation
bouwvergunningen[t] = + 1739.18 + 0.060684huwelijken[t] + 20.6578Inflatie[t] + 12.4296Consumentenvertrouwen[t] + 80.7627M1[t] + 239.672M2[t] + 73.4323M3[t] + 284.061M4[t] + 652.396M5[t] + 456.356M6[t] + 776.132M7[t] + 567.71M8[t] + 251.842M9[t] + 383.572M10[t] + 100.506M11[t] + e[t]

\begin{tabular}{lllllllll}
\hline
Multiple Linear Regression - Estimated Regression Equation \tabularnewline
bouwvergunningen[t] =  +  1739.18 +  0.060684huwelijken[t] +  20.6578Inflatie[t] +  12.4296Consumentenvertrouwen[t] +  80.7627M1[t] +  239.672M2[t] +  73.4323M3[t] +  284.061M4[t] +  652.396M5[t] +  456.356M6[t] +  776.132M7[t] +  567.71M8[t] +  251.842M9[t] +  383.572M10[t] +  100.506M11[t]  + e[t] \tabularnewline
 \tabularnewline
\hline
\end{tabular}
%Source: https://freestatistics.org/blog/index.php?pk=308075&T=1

[TABLE]
[ROW][C]Multiple Linear Regression - Estimated Regression Equation[/C][/ROW]
[ROW][C]bouwvergunningen[t] =  +  1739.18 +  0.060684huwelijken[t] +  20.6578Inflatie[t] +  12.4296Consumentenvertrouwen[t] +  80.7627M1[t] +  239.672M2[t] +  73.4323M3[t] +  284.061M4[t] +  652.396M5[t] +  456.356M6[t] +  776.132M7[t] +  567.71M8[t] +  251.842M9[t] +  383.572M10[t] +  100.506M11[t]  + e[t][/C][/ROW]
[ROW][C][/C][/ROW]
[/TABLE]
Source: https://freestatistics.org/blog/index.php?pk=308075&T=1

Globally Unique Identifier (entire table): ba.freestatistics.org/blog/index.php?pk=308075&T=1

As an alternative you can also use a QR Code:  

The GUIDs for individual cells are displayed in the table below:

Multiple Linear Regression - Estimated Regression Equation
bouwvergunningen[t] = + 1739.18 + 0.060684huwelijken[t] + 20.6578Inflatie[t] + 12.4296Consumentenvertrouwen[t] + 80.7627M1[t] + 239.672M2[t] + 73.4323M3[t] + 284.061M4[t] + 652.396M5[t] + 456.356M6[t] + 776.132M7[t] + 567.71M8[t] + 251.842M9[t] + 383.572M10[t] + 100.506M11[t] + e[t]


Multiple Linear Regression - Ordinary Least Squares
VariableParameterS.D.T-STATH0: parameter = 02-tail p-value1-tail p-value
(Intercept)+1739 615.1+2.8280e+00 0.005698 0.002849
huwelijken+0.06068 0.1014+5.9840e-01 0.551 0.2755
Inflatie+20.66 26.78+7.7130e-01 0.4424 0.2212
Consumentenvertrouwen+12.43 5.894+2.1090e+00 0.03753 0.01876
M1+80.76 206.5+3.9110e-01 0.6966 0.3483
M2+239.7 343+6.9880e-01 0.4863 0.2432
M3+73.43 453.3+1.6200e-01 0.8716 0.4358
M4+284.1 419.9+6.7640e-01 0.5004 0.2502
M5+652.4 510.6+1.2780e+00 0.2044 0.1022
M6+456.4 456.4+1.0000e+00 0.3198 0.1599
M7+776.1 419.2+1.8520e+00 0.06712 0.03356
M8+567.7 345.7+1.6420e+00 0.1038 0.05191
M9+251.8 235.8+1.0680e+00 0.2881 0.144
M10+383.6 212.7+1.8040e+00 0.07438 0.03719
M11+100.5 218.2+4.6070e-01 0.6461 0.323

\begin{tabular}{lllllllll}
\hline
Multiple Linear Regression - Ordinary Least Squares \tabularnewline
Variable & Parameter & S.D. & T-STATH0: parameter = 0 & 2-tail p-value & 1-tail p-value \tabularnewline
(Intercept) & +1739 &  615.1 & +2.8280e+00 &  0.005698 &  0.002849 \tabularnewline
huwelijken & +0.06068 &  0.1014 & +5.9840e-01 &  0.551 &  0.2755 \tabularnewline
Inflatie & +20.66 &  26.78 & +7.7130e-01 &  0.4424 &  0.2212 \tabularnewline
Consumentenvertrouwen & +12.43 &  5.894 & +2.1090e+00 &  0.03753 &  0.01876 \tabularnewline
M1 & +80.76 &  206.5 & +3.9110e-01 &  0.6966 &  0.3483 \tabularnewline
M2 & +239.7 &  343 & +6.9880e-01 &  0.4863 &  0.2432 \tabularnewline
M3 & +73.43 &  453.3 & +1.6200e-01 &  0.8716 &  0.4358 \tabularnewline
M4 & +284.1 &  419.9 & +6.7640e-01 &  0.5004 &  0.2502 \tabularnewline
M5 & +652.4 &  510.6 & +1.2780e+00 &  0.2044 &  0.1022 \tabularnewline
M6 & +456.4 &  456.4 & +1.0000e+00 &  0.3198 &  0.1599 \tabularnewline
M7 & +776.1 &  419.2 & +1.8520e+00 &  0.06712 &  0.03356 \tabularnewline
M8 & +567.7 &  345.7 & +1.6420e+00 &  0.1038 &  0.05191 \tabularnewline
M9 & +251.8 &  235.8 & +1.0680e+00 &  0.2881 &  0.144 \tabularnewline
M10 & +383.6 &  212.7 & +1.8040e+00 &  0.07438 &  0.03719 \tabularnewline
M11 & +100.5 &  218.2 & +4.6070e-01 &  0.6461 &  0.323 \tabularnewline
\hline
\end{tabular}
%Source: https://freestatistics.org/blog/index.php?pk=308075&T=2

[TABLE]
[ROW][C]Multiple Linear Regression - Ordinary Least Squares[/C][/ROW]
[ROW][C]Variable[/C][C]Parameter[/C][C]S.D.[/C][C]T-STATH0: parameter = 0[/C][C]2-tail p-value[/C][C]1-tail p-value[/C][/ROW]
[ROW][C](Intercept)[/C][C]+1739[/C][C] 615.1[/C][C]+2.8280e+00[/C][C] 0.005698[/C][C] 0.002849[/C][/ROW]
[ROW][C]huwelijken[/C][C]+0.06068[/C][C] 0.1014[/C][C]+5.9840e-01[/C][C] 0.551[/C][C] 0.2755[/C][/ROW]
[ROW][C]Inflatie[/C][C]+20.66[/C][C] 26.78[/C][C]+7.7130e-01[/C][C] 0.4424[/C][C] 0.2212[/C][/ROW]
[ROW][C]Consumentenvertrouwen[/C][C]+12.43[/C][C] 5.894[/C][C]+2.1090e+00[/C][C] 0.03753[/C][C] 0.01876[/C][/ROW]
[ROW][C]M1[/C][C]+80.76[/C][C] 206.5[/C][C]+3.9110e-01[/C][C] 0.6966[/C][C] 0.3483[/C][/ROW]
[ROW][C]M2[/C][C]+239.7[/C][C] 343[/C][C]+6.9880e-01[/C][C] 0.4863[/C][C] 0.2432[/C][/ROW]
[ROW][C]M3[/C][C]+73.43[/C][C] 453.3[/C][C]+1.6200e-01[/C][C] 0.8716[/C][C] 0.4358[/C][/ROW]
[ROW][C]M4[/C][C]+284.1[/C][C] 419.9[/C][C]+6.7640e-01[/C][C] 0.5004[/C][C] 0.2502[/C][/ROW]
[ROW][C]M5[/C][C]+652.4[/C][C] 510.6[/C][C]+1.2780e+00[/C][C] 0.2044[/C][C] 0.1022[/C][/ROW]
[ROW][C]M6[/C][C]+456.4[/C][C] 456.4[/C][C]+1.0000e+00[/C][C] 0.3198[/C][C] 0.1599[/C][/ROW]
[ROW][C]M7[/C][C]+776.1[/C][C] 419.2[/C][C]+1.8520e+00[/C][C] 0.06712[/C][C] 0.03356[/C][/ROW]
[ROW][C]M8[/C][C]+567.7[/C][C] 345.7[/C][C]+1.6420e+00[/C][C] 0.1038[/C][C] 0.05191[/C][/ROW]
[ROW][C]M9[/C][C]+251.8[/C][C] 235.8[/C][C]+1.0680e+00[/C][C] 0.2881[/C][C] 0.144[/C][/ROW]
[ROW][C]M10[/C][C]+383.6[/C][C] 212.7[/C][C]+1.8040e+00[/C][C] 0.07438[/C][C] 0.03719[/C][/ROW]
[ROW][C]M11[/C][C]+100.5[/C][C] 218.2[/C][C]+4.6070e-01[/C][C] 0.6461[/C][C] 0.323[/C][/ROW]
[/TABLE]
Source: https://freestatistics.org/blog/index.php?pk=308075&T=2

Globally Unique Identifier (entire table): ba.freestatistics.org/blog/index.php?pk=308075&T=2

As an alternative you can also use a QR Code:  

The GUIDs for individual cells are displayed in the table below:

Multiple Linear Regression - Ordinary Least Squares
VariableParameterS.D.T-STATH0: parameter = 02-tail p-value1-tail p-value
(Intercept)+1739 615.1+2.8280e+00 0.005698 0.002849
huwelijken+0.06068 0.1014+5.9840e-01 0.551 0.2755
Inflatie+20.66 26.78+7.7130e-01 0.4424 0.2212
Consumentenvertrouwen+12.43 5.894+2.1090e+00 0.03753 0.01876
M1+80.76 206.5+3.9110e-01 0.6966 0.3483
M2+239.7 343+6.9880e-01 0.4863 0.2432
M3+73.43 453.3+1.6200e-01 0.8716 0.4358
M4+284.1 419.9+6.7640e-01 0.5004 0.2502
M5+652.4 510.6+1.2780e+00 0.2044 0.1022
M6+456.4 456.4+1.0000e+00 0.3198 0.1599
M7+776.1 419.2+1.8520e+00 0.06712 0.03356
M8+567.7 345.7+1.6420e+00 0.1038 0.05191
M9+251.8 235.8+1.0680e+00 0.2881 0.144
M10+383.6 212.7+1.8040e+00 0.07438 0.03719
M11+100.5 218.2+4.6070e-01 0.6461 0.323


Multiple Linear Regression - Regression Statistics
Multiple R 0.4904
R-squared 0.2405
Adjusted R-squared 0.1309
F-TEST (value) 2.194
F-TEST (DF numerator)14
F-TEST (DF denominator)97
p-value 0.01307
Multiple Linear Regression - Residual Statistics
Residual Standard Deviation 436.3
Sum Squared Residuals 1.847e+07

\begin{tabular}{lllllllll}
\hline
Multiple Linear Regression - Regression Statistics \tabularnewline
Multiple R &  0.4904 \tabularnewline
R-squared &  0.2405 \tabularnewline
Adjusted R-squared &  0.1309 \tabularnewline
F-TEST (value) &  2.194 \tabularnewline
F-TEST (DF numerator) & 14 \tabularnewline
F-TEST (DF denominator) & 97 \tabularnewline
p-value &  0.01307 \tabularnewline
Multiple Linear Regression - Residual Statistics \tabularnewline
Residual Standard Deviation &  436.3 \tabularnewline
Sum Squared Residuals &  1.847e+07 \tabularnewline
\hline
\end{tabular}
%Source: https://freestatistics.org/blog/index.php?pk=308075&T=3

[TABLE]
[ROW][C]Multiple Linear Regression - Regression Statistics[/C][/ROW]
[ROW][C]Multiple R[/C][C] 0.4904[/C][/ROW]
[ROW][C]R-squared[/C][C] 0.2405[/C][/ROW]
[ROW][C]Adjusted R-squared[/C][C] 0.1309[/C][/ROW]
[ROW][C]F-TEST (value)[/C][C] 2.194[/C][/ROW]
[ROW][C]F-TEST (DF numerator)[/C][C]14[/C][/ROW]
[ROW][C]F-TEST (DF denominator)[/C][C]97[/C][/ROW]
[ROW][C]p-value[/C][C] 0.01307[/C][/ROW]
[ROW][C]Multiple Linear Regression - Residual Statistics[/C][/ROW]
[ROW][C]Residual Standard Deviation[/C][C] 436.3[/C][/ROW]
[ROW][C]Sum Squared Residuals[/C][C] 1.847e+07[/C][/ROW]
[/TABLE]
Source: https://freestatistics.org/blog/index.php?pk=308075&T=3

Globally Unique Identifier (entire table): ba.freestatistics.org/blog/index.php?pk=308075&T=3

As an alternative you can also use a QR Code:  

The GUIDs for individual cells are displayed in the table below:

Multiple Linear Regression - Regression Statistics
Multiple R 0.4904
R-squared 0.2405
Adjusted R-squared 0.1309
F-TEST (value) 2.194
F-TEST (DF numerator)14
F-TEST (DF denominator)97
p-value 0.01307
Multiple Linear Regression - Residual Statistics
Residual Standard Deviation 436.3
Sum Squared Residuals 1.847e+07


Menu of Residual Diagnostics
DescriptionLink
HistogramCompute
Central TendencyCompute
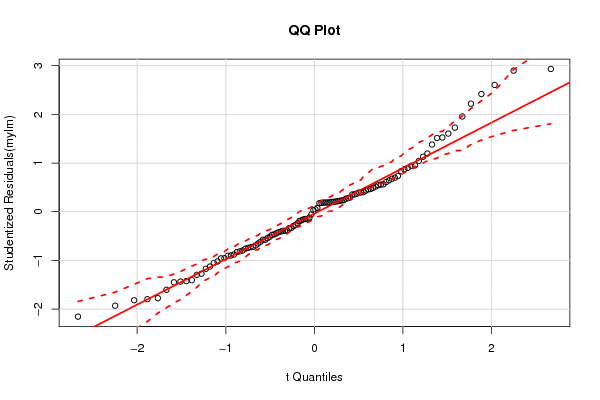
QQ PlotCompute
Kernel Density PlotCompute
Skewness/Kurtosis TestCompute
Skewness-Kurtosis PlotCompute
Harrell-Davis PlotCompute
Bootstrap Plot -- Central TendencyCompute
Blocked Bootstrap Plot -- Central TendencyCompute
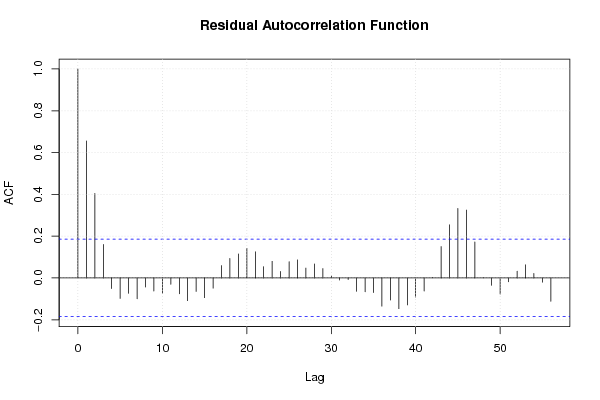
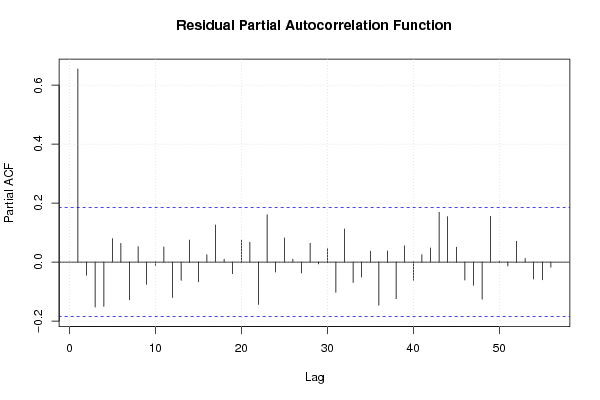
(Partial) Autocorrelation PlotCompute
Spectral AnalysisCompute
Tukey lambda PPCC PlotCompute
Box-Cox Normality PlotCompute
Summary StatisticsCompute

\begin{tabular}{lllllllll}
\hline
Menu of Residual Diagnostics \tabularnewline
Description & Link \tabularnewline
Histogram & Compute \tabularnewline
Central Tendency & Compute \tabularnewline
QQ Plot & Compute \tabularnewline
Kernel Density Plot & Compute \tabularnewline
Skewness/Kurtosis Test & Compute \tabularnewline
Skewness-Kurtosis Plot & Compute \tabularnewline
Harrell-Davis Plot & Compute \tabularnewline
Bootstrap Plot -- Central Tendency & Compute \tabularnewline
Blocked Bootstrap Plot -- Central Tendency & Compute \tabularnewline
(Partial) Autocorrelation Plot & Compute \tabularnewline
Spectral Analysis & Compute \tabularnewline
Tukey lambda PPCC Plot & Compute \tabularnewline
Box-Cox Normality Plot & Compute \tabularnewline
Summary Statistics & Compute \tabularnewline
\hline
\end{tabular}
%Source: https://freestatistics.org/blog/index.php?pk=308075&T=4

[TABLE]
[ROW][C]Menu of Residual Diagnostics[/C][/ROW]
[ROW][C]Description[/C][C]Link[/C][/ROW]
[ROW][C]Histogram[/C][C]Compute[/C][/ROW]
[ROW][C]Central Tendency[/C][C]Compute[/C][/ROW]
[ROW][C]QQ Plot[/C][C]Compute[/C][/ROW]
[ROW][C]Kernel Density Plot[/C][C]Compute[/C][/ROW]
[ROW][C]Skewness/Kurtosis Test[/C][C]Compute[/C][/ROW]
[ROW][C]Skewness-Kurtosis Plot[/C][C]Compute[/C][/ROW]
[ROW][C]Harrell-Davis Plot[/C][C]Compute[/C][/ROW]
[ROW][C]Bootstrap Plot -- Central Tendency[/C][C]Compute[/C][/ROW]
[ROW][C]Blocked Bootstrap Plot -- Central Tendency[/C][C]Compute[/C][/ROW]
[ROW][C](Partial) Autocorrelation Plot[/C][C]Compute[/C][/ROW]
[ROW][C]Spectral Analysis[/C][C]Compute[/C][/ROW]
[ROW][C]Tukey lambda PPCC Plot[/C][C]Compute[/C][/ROW]
[ROW][C]Box-Cox Normality Plot[/C][C]Compute[/C][/ROW]
[ROW][C]Summary Statistics[/C][C]Compute[/C][/ROW]
[/TABLE]
Source: https://freestatistics.org/blog/index.php?pk=308075&T=4

Globally Unique Identifier (entire table): ba.freestatistics.org/blog/index.php?pk=308075&T=4

As an alternative you can also use a QR Code:  

The GUIDs for individual cells are displayed in the table below:

Menu of Residual Diagnostics
DescriptionLink
HistogramCompute
Central TendencyCompute
QQ PlotCompute
Kernel Density PlotCompute
Skewness/Kurtosis TestCompute
Skewness-Kurtosis PlotCompute
Harrell-Davis PlotCompute
Bootstrap Plot -- Central TendencyCompute
Blocked Bootstrap Plot -- Central TendencyCompute
(Partial) Autocorrelation PlotCompute
Spectral AnalysisCompute
Tukey lambda PPCC PlotCompute
Box-Cox Normality PlotCompute
Summary StatisticsCompute


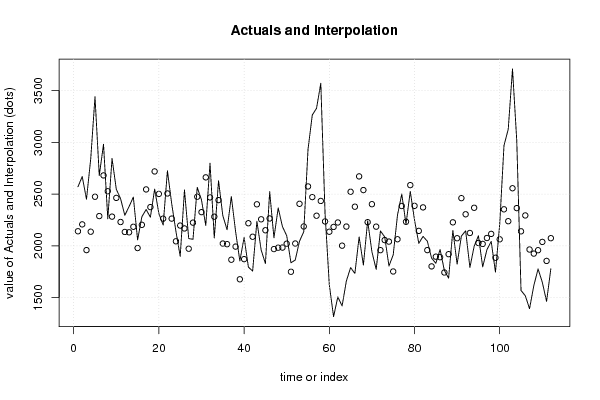
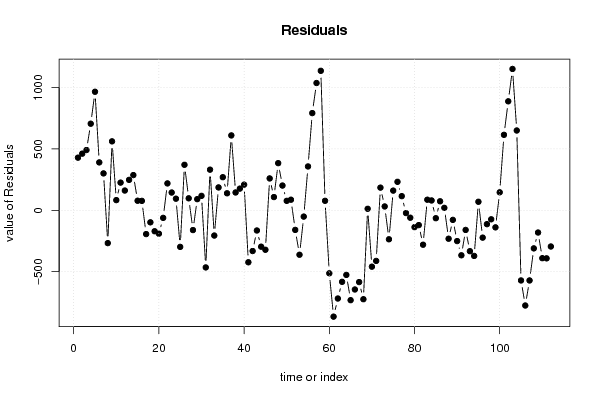
Multiple Linear Regression - Actuals, Interpolation, and Residuals
Time or IndexActualsInterpolationForecastResidualsPrediction Error
1 2570 2141 429.2
2 2669 2207 461.9
3 2450 1959 491.4
4 2842 2136 705.9
5 3440 2474 966.2
6 2678 2287 390.7
7 2981 2680 301
8 2260 2527-267.1
9 2844 2282 562.2
10 2546 2463 83.23
11 2456 2230 226
12 2295 2134 161.4
13 2379 2131 248.1
14 2471 2184 287.2
15 2057 1979 78.21
16 2280 2203 77.11
17 2351 2544-193.5
18 2276 2374-97.67
19 2548 2718-170.4
20 2311 2501-190.1
21 2201 2262-61.38
22 2725 2506 219.4
23 2408 2263 145.2
24 2139 2044 95.03
25 1898 2196-297.8
26 2539 2168 371.3
27 2070 1972 98.09
28 2063 2224-160.6
29 2565 2474 90.99
30 2443 2325 118.1
31 2196 2661-465.2
32 2799 2468 331.4
33 2076 2281-205.3
34 2628 2441 186.7
35 2292 2022 270
36 2155 2016 139.1
37 2476 1866 610.4
38 2138 1992 145.5
39 1854 1677 176.9
40 2081 1872 209.5
41 1795 2218-423
42 1756 2088-331.5
43 2237 2401-164.1
44 1960 2256-296.2
45 1829 2150-321.2
46 2524 2264 259.9
47 2077 1969 108.3
48 2366 1982 384.4
49 2185 1983 201.9
50 2098 2021 77.48
51 1836 1749 86.56
52 1863 2022-159.3
53 2044 2406-361.7
54 2136 2187-50.82
55 2931 2573 357.6
56 3263 2471 792.3
57 3328 2291 1037
58 3570 2433 1137
59 2313 2235 77.53
60 1623 2136-512.9
61 1316 2182-866.2
62 1507 2225-718.5
63 1419 2001-582.5
64 1660 2186-526
65 1790 2522-731.9
66 1733 2378-644.8
67 2086 2670-584.5
68 1814 2538-724.2
69 2241 2228 12.64
70 1943 2402-459
71 1773 2185-412.1
72 2143 1958 184.9
73 2087 2055 31.68
74 1805 2041-235.9
75 1913 1752 160.8
76 2296 2064 232.5
77 2500 2384 115.5
78 2210 2232-22.03
79 2526 2586-60.11
80 2249 2386-137.1
81 2024 2144-120.2
82 2091 2371-280.2
83 2045 1958 86.6
84 1882 1802 80.46
85 1831 1895-64.1
86 1964 1890 73.87
87 1763 1743 20.29
88 1688 1919-231.2
89 2149 2227-77.81
90 1823 2073-250.3
91 2094 2460-366.3
92 2145 2305-159.7
93 1791 2124-332.9
94 1996 2367-371.5
95 2097 2027 69.89
96 1796 2018-222.4
97 1963 2076-112.5
98 2042 2115-73.14
99 1746 1885-138.7
100 2210 2063 147
101 2968 2353 615.2
102 3126 2238 888.4
103 3708 2556 1152
104 3015 2364 650.6
105 1569 2140-571.2
106 1518 2293-775.5
107 1393 1964-571.4
108 1615 1925-309.9
109 1777 1958-180.7
110 1648 2038-389.8
111 1463 1854-391.1
112 1779 2074-294.7

\begin{tabular}{lllllllll}
\hline
Multiple Linear Regression - Actuals, Interpolation, and Residuals \tabularnewline
Time or Index & Actuals & InterpolationForecast & ResidualsPrediction Error \tabularnewline
1 &  2570 &  2141 &  429.2 \tabularnewline
2 &  2669 &  2207 &  461.9 \tabularnewline
3 &  2450 &  1959 &  491.4 \tabularnewline
4 &  2842 &  2136 &  705.9 \tabularnewline
5 &  3440 &  2474 &  966.2 \tabularnewline
6 &  2678 &  2287 &  390.7 \tabularnewline
7 &  2981 &  2680 &  301 \tabularnewline
8 &  2260 &  2527 & -267.1 \tabularnewline
9 &  2844 &  2282 &  562.2 \tabularnewline
10 &  2546 &  2463 &  83.23 \tabularnewline
11 &  2456 &  2230 &  226 \tabularnewline
12 &  2295 &  2134 &  161.4 \tabularnewline
13 &  2379 &  2131 &  248.1 \tabularnewline
14 &  2471 &  2184 &  287.2 \tabularnewline
15 &  2057 &  1979 &  78.21 \tabularnewline
16 &  2280 &  2203 &  77.11 \tabularnewline
17 &  2351 &  2544 & -193.5 \tabularnewline
18 &  2276 &  2374 & -97.67 \tabularnewline
19 &  2548 &  2718 & -170.4 \tabularnewline
20 &  2311 &  2501 & -190.1 \tabularnewline
21 &  2201 &  2262 & -61.38 \tabularnewline
22 &  2725 &  2506 &  219.4 \tabularnewline
23 &  2408 &  2263 &  145.2 \tabularnewline
24 &  2139 &  2044 &  95.03 \tabularnewline
25 &  1898 &  2196 & -297.8 \tabularnewline
26 &  2539 &  2168 &  371.3 \tabularnewline
27 &  2070 &  1972 &  98.09 \tabularnewline
28 &  2063 &  2224 & -160.6 \tabularnewline
29 &  2565 &  2474 &  90.99 \tabularnewline
30 &  2443 &  2325 &  118.1 \tabularnewline
31 &  2196 &  2661 & -465.2 \tabularnewline
32 &  2799 &  2468 &  331.4 \tabularnewline
33 &  2076 &  2281 & -205.3 \tabularnewline
34 &  2628 &  2441 &  186.7 \tabularnewline
35 &  2292 &  2022 &  270 \tabularnewline
36 &  2155 &  2016 &  139.1 \tabularnewline
37 &  2476 &  1866 &  610.4 \tabularnewline
38 &  2138 &  1992 &  145.5 \tabularnewline
39 &  1854 &  1677 &  176.9 \tabularnewline
40 &  2081 &  1872 &  209.5 \tabularnewline
41 &  1795 &  2218 & -423 \tabularnewline
42 &  1756 &  2088 & -331.5 \tabularnewline
43 &  2237 &  2401 & -164.1 \tabularnewline
44 &  1960 &  2256 & -296.2 \tabularnewline
45 &  1829 &  2150 & -321.2 \tabularnewline
46 &  2524 &  2264 &  259.9 \tabularnewline
47 &  2077 &  1969 &  108.3 \tabularnewline
48 &  2366 &  1982 &  384.4 \tabularnewline
49 &  2185 &  1983 &  201.9 \tabularnewline
50 &  2098 &  2021 &  77.48 \tabularnewline
51 &  1836 &  1749 &  86.56 \tabularnewline
52 &  1863 &  2022 & -159.3 \tabularnewline
53 &  2044 &  2406 & -361.7 \tabularnewline
54 &  2136 &  2187 & -50.82 \tabularnewline
55 &  2931 &  2573 &  357.6 \tabularnewline
56 &  3263 &  2471 &  792.3 \tabularnewline
57 &  3328 &  2291 &  1037 \tabularnewline
58 &  3570 &  2433 &  1137 \tabularnewline
59 &  2313 &  2235 &  77.53 \tabularnewline
60 &  1623 &  2136 & -512.9 \tabularnewline
61 &  1316 &  2182 & -866.2 \tabularnewline
62 &  1507 &  2225 & -718.5 \tabularnewline
63 &  1419 &  2001 & -582.5 \tabularnewline
64 &  1660 &  2186 & -526 \tabularnewline
65 &  1790 &  2522 & -731.9 \tabularnewline
66 &  1733 &  2378 & -644.8 \tabularnewline
67 &  2086 &  2670 & -584.5 \tabularnewline
68 &  1814 &  2538 & -724.2 \tabularnewline
69 &  2241 &  2228 &  12.64 \tabularnewline
70 &  1943 &  2402 & -459 \tabularnewline
71 &  1773 &  2185 & -412.1 \tabularnewline
72 &  2143 &  1958 &  184.9 \tabularnewline
73 &  2087 &  2055 &  31.68 \tabularnewline
74 &  1805 &  2041 & -235.9 \tabularnewline
75 &  1913 &  1752 &  160.8 \tabularnewline
76 &  2296 &  2064 &  232.5 \tabularnewline
77 &  2500 &  2384 &  115.5 \tabularnewline
78 &  2210 &  2232 & -22.03 \tabularnewline
79 &  2526 &  2586 & -60.11 \tabularnewline
80 &  2249 &  2386 & -137.1 \tabularnewline
81 &  2024 &  2144 & -120.2 \tabularnewline
82 &  2091 &  2371 & -280.2 \tabularnewline
83 &  2045 &  1958 &  86.6 \tabularnewline
84 &  1882 &  1802 &  80.46 \tabularnewline
85 &  1831 &  1895 & -64.1 \tabularnewline
86 &  1964 &  1890 &  73.87 \tabularnewline
87 &  1763 &  1743 &  20.29 \tabularnewline
88 &  1688 &  1919 & -231.2 \tabularnewline
89 &  2149 &  2227 & -77.81 \tabularnewline
90 &  1823 &  2073 & -250.3 \tabularnewline
91 &  2094 &  2460 & -366.3 \tabularnewline
92 &  2145 &  2305 & -159.7 \tabularnewline
93 &  1791 &  2124 & -332.9 \tabularnewline
94 &  1996 &  2367 & -371.5 \tabularnewline
95 &  2097 &  2027 &  69.89 \tabularnewline
96 &  1796 &  2018 & -222.4 \tabularnewline
97 &  1963 &  2076 & -112.5 \tabularnewline
98 &  2042 &  2115 & -73.14 \tabularnewline
99 &  1746 &  1885 & -138.7 \tabularnewline
100 &  2210 &  2063 &  147 \tabularnewline
101 &  2968 &  2353 &  615.2 \tabularnewline
102 &  3126 &  2238 &  888.4 \tabularnewline
103 &  3708 &  2556 &  1152 \tabularnewline
104 &  3015 &  2364 &  650.6 \tabularnewline
105 &  1569 &  2140 & -571.2 \tabularnewline
106 &  1518 &  2293 & -775.5 \tabularnewline
107 &  1393 &  1964 & -571.4 \tabularnewline
108 &  1615 &  1925 & -309.9 \tabularnewline
109 &  1777 &  1958 & -180.7 \tabularnewline
110 &  1648 &  2038 & -389.8 \tabularnewline
111 &  1463 &  1854 & -391.1 \tabularnewline
112 &  1779 &  2074 & -294.7 \tabularnewline
\hline
\end{tabular}
%Source: https://freestatistics.org/blog/index.php?pk=308075&T=5

[TABLE]
[ROW][C]Multiple Linear Regression - Actuals, Interpolation, and Residuals[/C][/ROW]
[ROW][C]Time or Index[/C][C]Actuals[/C][C]InterpolationForecast[/C][C]ResidualsPrediction Error[/C][/ROW]
[ROW][C]1[/C][C] 2570[/C][C] 2141[/C][C] 429.2[/C][/ROW]
[ROW][C]2[/C][C] 2669[/C][C] 2207[/C][C] 461.9[/C][/ROW]
[ROW][C]3[/C][C] 2450[/C][C] 1959[/C][C] 491.4[/C][/ROW]
[ROW][C]4[/C][C] 2842[/C][C] 2136[/C][C] 705.9[/C][/ROW]
[ROW][C]5[/C][C] 3440[/C][C] 2474[/C][C] 966.2[/C][/ROW]
[ROW][C]6[/C][C] 2678[/C][C] 2287[/C][C] 390.7[/C][/ROW]
[ROW][C]7[/C][C] 2981[/C][C] 2680[/C][C] 301[/C][/ROW]
[ROW][C]8[/C][C] 2260[/C][C] 2527[/C][C]-267.1[/C][/ROW]
[ROW][C]9[/C][C] 2844[/C][C] 2282[/C][C] 562.2[/C][/ROW]
[ROW][C]10[/C][C] 2546[/C][C] 2463[/C][C] 83.23[/C][/ROW]
[ROW][C]11[/C][C] 2456[/C][C] 2230[/C][C] 226[/C][/ROW]
[ROW][C]12[/C][C] 2295[/C][C] 2134[/C][C] 161.4[/C][/ROW]
[ROW][C]13[/C][C] 2379[/C][C] 2131[/C][C] 248.1[/C][/ROW]
[ROW][C]14[/C][C] 2471[/C][C] 2184[/C][C] 287.2[/C][/ROW]
[ROW][C]15[/C][C] 2057[/C][C] 1979[/C][C] 78.21[/C][/ROW]
[ROW][C]16[/C][C] 2280[/C][C] 2203[/C][C] 77.11[/C][/ROW]
[ROW][C]17[/C][C] 2351[/C][C] 2544[/C][C]-193.5[/C][/ROW]
[ROW][C]18[/C][C] 2276[/C][C] 2374[/C][C]-97.67[/C][/ROW]
[ROW][C]19[/C][C] 2548[/C][C] 2718[/C][C]-170.4[/C][/ROW]
[ROW][C]20[/C][C] 2311[/C][C] 2501[/C][C]-190.1[/C][/ROW]
[ROW][C]21[/C][C] 2201[/C][C] 2262[/C][C]-61.38[/C][/ROW]
[ROW][C]22[/C][C] 2725[/C][C] 2506[/C][C] 219.4[/C][/ROW]
[ROW][C]23[/C][C] 2408[/C][C] 2263[/C][C] 145.2[/C][/ROW]
[ROW][C]24[/C][C] 2139[/C][C] 2044[/C][C] 95.03[/C][/ROW]
[ROW][C]25[/C][C] 1898[/C][C] 2196[/C][C]-297.8[/C][/ROW]
[ROW][C]26[/C][C] 2539[/C][C] 2168[/C][C] 371.3[/C][/ROW]
[ROW][C]27[/C][C] 2070[/C][C] 1972[/C][C] 98.09[/C][/ROW]
[ROW][C]28[/C][C] 2063[/C][C] 2224[/C][C]-160.6[/C][/ROW]
[ROW][C]29[/C][C] 2565[/C][C] 2474[/C][C] 90.99[/C][/ROW]
[ROW][C]30[/C][C] 2443[/C][C] 2325[/C][C] 118.1[/C][/ROW]
[ROW][C]31[/C][C] 2196[/C][C] 2661[/C][C]-465.2[/C][/ROW]
[ROW][C]32[/C][C] 2799[/C][C] 2468[/C][C] 331.4[/C][/ROW]
[ROW][C]33[/C][C] 2076[/C][C] 2281[/C][C]-205.3[/C][/ROW]
[ROW][C]34[/C][C] 2628[/C][C] 2441[/C][C] 186.7[/C][/ROW]
[ROW][C]35[/C][C] 2292[/C][C] 2022[/C][C] 270[/C][/ROW]
[ROW][C]36[/C][C] 2155[/C][C] 2016[/C][C] 139.1[/C][/ROW]
[ROW][C]37[/C][C] 2476[/C][C] 1866[/C][C] 610.4[/C][/ROW]
[ROW][C]38[/C][C] 2138[/C][C] 1992[/C][C] 145.5[/C][/ROW]
[ROW][C]39[/C][C] 1854[/C][C] 1677[/C][C] 176.9[/C][/ROW]
[ROW][C]40[/C][C] 2081[/C][C] 1872[/C][C] 209.5[/C][/ROW]
[ROW][C]41[/C][C] 1795[/C][C] 2218[/C][C]-423[/C][/ROW]
[ROW][C]42[/C][C] 1756[/C][C] 2088[/C][C]-331.5[/C][/ROW]
[ROW][C]43[/C][C] 2237[/C][C] 2401[/C][C]-164.1[/C][/ROW]
[ROW][C]44[/C][C] 1960[/C][C] 2256[/C][C]-296.2[/C][/ROW]
[ROW][C]45[/C][C] 1829[/C][C] 2150[/C][C]-321.2[/C][/ROW]
[ROW][C]46[/C][C] 2524[/C][C] 2264[/C][C] 259.9[/C][/ROW]
[ROW][C]47[/C][C] 2077[/C][C] 1969[/C][C] 108.3[/C][/ROW]
[ROW][C]48[/C][C] 2366[/C][C] 1982[/C][C] 384.4[/C][/ROW]
[ROW][C]49[/C][C] 2185[/C][C] 1983[/C][C] 201.9[/C][/ROW]
[ROW][C]50[/C][C] 2098[/C][C] 2021[/C][C] 77.48[/C][/ROW]
[ROW][C]51[/C][C] 1836[/C][C] 1749[/C][C] 86.56[/C][/ROW]
[ROW][C]52[/C][C] 1863[/C][C] 2022[/C][C]-159.3[/C][/ROW]
[ROW][C]53[/C][C] 2044[/C][C] 2406[/C][C]-361.7[/C][/ROW]
[ROW][C]54[/C][C] 2136[/C][C] 2187[/C][C]-50.82[/C][/ROW]
[ROW][C]55[/C][C] 2931[/C][C] 2573[/C][C] 357.6[/C][/ROW]
[ROW][C]56[/C][C] 3263[/C][C] 2471[/C][C] 792.3[/C][/ROW]
[ROW][C]57[/C][C] 3328[/C][C] 2291[/C][C] 1037[/C][/ROW]
[ROW][C]58[/C][C] 3570[/C][C] 2433[/C][C] 1137[/C][/ROW]
[ROW][C]59[/C][C] 2313[/C][C] 2235[/C][C] 77.53[/C][/ROW]
[ROW][C]60[/C][C] 1623[/C][C] 2136[/C][C]-512.9[/C][/ROW]
[ROW][C]61[/C][C] 1316[/C][C] 2182[/C][C]-866.2[/C][/ROW]
[ROW][C]62[/C][C] 1507[/C][C] 2225[/C][C]-718.5[/C][/ROW]
[ROW][C]63[/C][C] 1419[/C][C] 2001[/C][C]-582.5[/C][/ROW]
[ROW][C]64[/C][C] 1660[/C][C] 2186[/C][C]-526[/C][/ROW]
[ROW][C]65[/C][C] 1790[/C][C] 2522[/C][C]-731.9[/C][/ROW]
[ROW][C]66[/C][C] 1733[/C][C] 2378[/C][C]-644.8[/C][/ROW]
[ROW][C]67[/C][C] 2086[/C][C] 2670[/C][C]-584.5[/C][/ROW]
[ROW][C]68[/C][C] 1814[/C][C] 2538[/C][C]-724.2[/C][/ROW]
[ROW][C]69[/C][C] 2241[/C][C] 2228[/C][C] 12.64[/C][/ROW]
[ROW][C]70[/C][C] 1943[/C][C] 2402[/C][C]-459[/C][/ROW]
[ROW][C]71[/C][C] 1773[/C][C] 2185[/C][C]-412.1[/C][/ROW]
[ROW][C]72[/C][C] 2143[/C][C] 1958[/C][C] 184.9[/C][/ROW]
[ROW][C]73[/C][C] 2087[/C][C] 2055[/C][C] 31.68[/C][/ROW]
[ROW][C]74[/C][C] 1805[/C][C] 2041[/C][C]-235.9[/C][/ROW]
[ROW][C]75[/C][C] 1913[/C][C] 1752[/C][C] 160.8[/C][/ROW]
[ROW][C]76[/C][C] 2296[/C][C] 2064[/C][C] 232.5[/C][/ROW]
[ROW][C]77[/C][C] 2500[/C][C] 2384[/C][C] 115.5[/C][/ROW]
[ROW][C]78[/C][C] 2210[/C][C] 2232[/C][C]-22.03[/C][/ROW]
[ROW][C]79[/C][C] 2526[/C][C] 2586[/C][C]-60.11[/C][/ROW]
[ROW][C]80[/C][C] 2249[/C][C] 2386[/C][C]-137.1[/C][/ROW]
[ROW][C]81[/C][C] 2024[/C][C] 2144[/C][C]-120.2[/C][/ROW]
[ROW][C]82[/C][C] 2091[/C][C] 2371[/C][C]-280.2[/C][/ROW]
[ROW][C]83[/C][C] 2045[/C][C] 1958[/C][C] 86.6[/C][/ROW]
[ROW][C]84[/C][C] 1882[/C][C] 1802[/C][C] 80.46[/C][/ROW]
[ROW][C]85[/C][C] 1831[/C][C] 1895[/C][C]-64.1[/C][/ROW]
[ROW][C]86[/C][C] 1964[/C][C] 1890[/C][C] 73.87[/C][/ROW]
[ROW][C]87[/C][C] 1763[/C][C] 1743[/C][C] 20.29[/C][/ROW]
[ROW][C]88[/C][C] 1688[/C][C] 1919[/C][C]-231.2[/C][/ROW]
[ROW][C]89[/C][C] 2149[/C][C] 2227[/C][C]-77.81[/C][/ROW]
[ROW][C]90[/C][C] 1823[/C][C] 2073[/C][C]-250.3[/C][/ROW]
[ROW][C]91[/C][C] 2094[/C][C] 2460[/C][C]-366.3[/C][/ROW]
[ROW][C]92[/C][C] 2145[/C][C] 2305[/C][C]-159.7[/C][/ROW]
[ROW][C]93[/C][C] 1791[/C][C] 2124[/C][C]-332.9[/C][/ROW]
[ROW][C]94[/C][C] 1996[/C][C] 2367[/C][C]-371.5[/C][/ROW]
[ROW][C]95[/C][C] 2097[/C][C] 2027[/C][C] 69.89[/C][/ROW]
[ROW][C]96[/C][C] 1796[/C][C] 2018[/C][C]-222.4[/C][/ROW]
[ROW][C]97[/C][C] 1963[/C][C] 2076[/C][C]-112.5[/C][/ROW]
[ROW][C]98[/C][C] 2042[/C][C] 2115[/C][C]-73.14[/C][/ROW]
[ROW][C]99[/C][C] 1746[/C][C] 1885[/C][C]-138.7[/C][/ROW]
[ROW][C]100[/C][C] 2210[/C][C] 2063[/C][C] 147[/C][/ROW]
[ROW][C]101[/C][C] 2968[/C][C] 2353[/C][C] 615.2[/C][/ROW]
[ROW][C]102[/C][C] 3126[/C][C] 2238[/C][C] 888.4[/C][/ROW]
[ROW][C]103[/C][C] 3708[/C][C] 2556[/C][C] 1152[/C][/ROW]
[ROW][C]104[/C][C] 3015[/C][C] 2364[/C][C] 650.6[/C][/ROW]
[ROW][C]105[/C][C] 1569[/C][C] 2140[/C][C]-571.2[/C][/ROW]
[ROW][C]106[/C][C] 1518[/C][C] 2293[/C][C]-775.5[/C][/ROW]
[ROW][C]107[/C][C] 1393[/C][C] 1964[/C][C]-571.4[/C][/ROW]
[ROW][C]108[/C][C] 1615[/C][C] 1925[/C][C]-309.9[/C][/ROW]
[ROW][C]109[/C][C] 1777[/C][C] 1958[/C][C]-180.7[/C][/ROW]
[ROW][C]110[/C][C] 1648[/C][C] 2038[/C][C]-389.8[/C][/ROW]
[ROW][C]111[/C][C] 1463[/C][C] 1854[/C][C]-391.1[/C][/ROW]
[ROW][C]112[/C][C] 1779[/C][C] 2074[/C][C]-294.7[/C][/ROW]
[/TABLE]
Source: https://freestatistics.org/blog/index.php?pk=308075&T=5

Globally Unique Identifier (entire table): ba.freestatistics.org/blog/index.php?pk=308075&T=5

As an alternative you can also use a QR Code:  

The GUIDs for individual cells are displayed in the table below:

Multiple Linear Regression - Actuals, Interpolation, and Residuals
Time or IndexActualsInterpolationForecastResidualsPrediction Error
1 2570 2141 429.2
2 2669 2207 461.9
3 2450 1959 491.4
4 2842 2136 705.9
5 3440 2474 966.2
6 2678 2287 390.7
7 2981 2680 301
8 2260 2527-267.1
9 2844 2282 562.2
10 2546 2463 83.23
11 2456 2230 226
12 2295 2134 161.4
13 2379 2131 248.1
14 2471 2184 287.2
15 2057 1979 78.21
16 2280 2203 77.11
17 2351 2544-193.5
18 2276 2374-97.67
19 2548 2718-170.4
20 2311 2501-190.1
21 2201 2262-61.38
22 2725 2506 219.4
23 2408 2263 145.2
24 2139 2044 95.03
25 1898 2196-297.8
26 2539 2168 371.3
27 2070 1972 98.09
28 2063 2224-160.6
29 2565 2474 90.99
30 2443 2325 118.1
31 2196 2661-465.2
32 2799 2468 331.4
33 2076 2281-205.3
34 2628 2441 186.7
35 2292 2022 270
36 2155 2016 139.1
37 2476 1866 610.4
38 2138 1992 145.5
39 1854 1677 176.9
40 2081 1872 209.5
41 1795 2218-423
42 1756 2088-331.5
43 2237 2401-164.1
44 1960 2256-296.2
45 1829 2150-321.2
46 2524 2264 259.9
47 2077 1969 108.3
48 2366 1982 384.4
49 2185 1983 201.9
50 2098 2021 77.48
51 1836 1749 86.56
52 1863 2022-159.3
53 2044 2406-361.7
54 2136 2187-50.82
55 2931 2573 357.6
56 3263 2471 792.3
57 3328 2291 1037
58 3570 2433 1137
59 2313 2235 77.53
60 1623 2136-512.9
61 1316 2182-866.2
62 1507 2225-718.5
63 1419 2001-582.5
64 1660 2186-526
65 1790 2522-731.9
66 1733 2378-644.8
67 2086 2670-584.5
68 1814 2538-724.2
69 2241 2228 12.64
70 1943 2402-459
71 1773 2185-412.1
72 2143 1958 184.9
73 2087 2055 31.68
74 1805 2041-235.9
75 1913 1752 160.8
76 2296 2064 232.5
77 2500 2384 115.5
78 2210 2232-22.03
79 2526 2586-60.11
80 2249 2386-137.1
81 2024 2144-120.2
82 2091 2371-280.2
83 2045 1958 86.6
84 1882 1802 80.46
85 1831 1895-64.1
86 1964 1890 73.87
87 1763 1743 20.29
88 1688 1919-231.2
89 2149 2227-77.81
90 1823 2073-250.3
91 2094 2460-366.3
92 2145 2305-159.7
93 1791 2124-332.9
94 1996 2367-371.5
95 2097 2027 69.89
96 1796 2018-222.4
97 1963 2076-112.5
98 2042 2115-73.14
99 1746 1885-138.7
100 2210 2063 147
101 2968 2353 615.2
102 3126 2238 888.4
103 3708 2556 1152
104 3015 2364 650.6
105 1569 2140-571.2
106 1518 2293-775.5
107 1393 1964-571.4
108 1615 1925-309.9
109 1777 1958-180.7
110 1648 2038-389.8
111 1463 1854-391.1
112 1779 2074-294.7


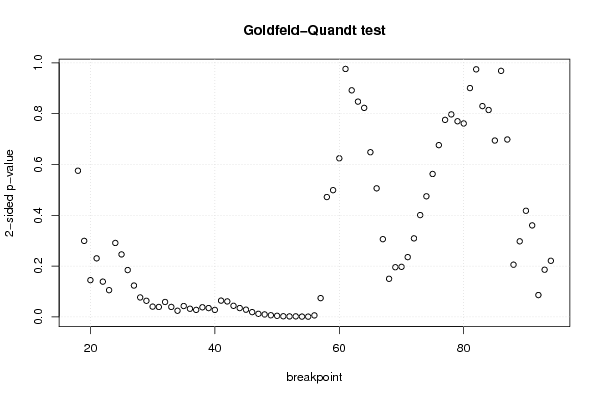
Goldfeld-Quandt test for Heteroskedasticity
p-valuesAlternative Hypothesis
breakpoint indexgreater2-sidedless
18 0.2876 0.5752 0.7124
19 0.1496 0.2993 0.8504
20 0.0724 0.1448 0.9276
21 0.1153 0.2306 0.8847
22 0.06948 0.139 0.9305
23 0.05271 0.1054 0.9473
24 0.1456 0.2911 0.8544
25 0.1231 0.2462 0.8769
26 0.0923 0.1846 0.9077
27 0.0618 0.1236 0.9382
28 0.0384 0.0768 0.9616
29 0.03179 0.06359 0.9682
30 0.0203 0.0406 0.9797
31 0.01967 0.03933 0.9803
32 0.02944 0.05888 0.9706
33 0.01975 0.03949 0.9803
34 0.01224 0.02448 0.9878
35 0.02151 0.04302 0.9785
36 0.01614 0.03228 0.9839
37 0.01391 0.02782 0.9861
38 0.01907 0.03814 0.9809
39 0.01748 0.03497 0.9825
40 0.01387 0.02774 0.9861
41 0.03212 0.06424 0.9679
42 0.03057 0.06114 0.9694
43 0.02196 0.04392 0.978
44 0.01753 0.03506 0.9825
45 0.01433 0.02865 0.9857
46 0.009542 0.01908 0.9905
47 0.006162 0.01232 0.9938
48 0.004968 0.009935 0.995
49 0.003358 0.006717 0.9966
50 0.002258 0.004517 0.9977
51 0.001389 0.002777 0.9986
52 0.001119 0.002239 0.9989
53 0.001173 0.002346 0.9988
54 0.000692 0.001384 0.9993
55 0.0006063 0.001213 0.9994
56 0.003127 0.006253 0.9969
57 0.03704 0.07408 0.963
58 0.2359 0.4718 0.7641
59 0.2494 0.4988 0.7506
60 0.3121 0.6242 0.6879
61 0.4878 0.9757 0.5122
62 0.5541 0.8917 0.4459
63 0.5764 0.8471 0.4236
64 0.5887 0.8226 0.4113
65 0.676 0.6481 0.324
66 0.7469 0.5061 0.2531
67 0.847 0.306 0.153
68 0.9249 0.1501 0.07507
69 0.9022 0.1956 0.09782
70 0.9014 0.1972 0.09861
71 0.8823 0.2354 0.1177
72 0.8454 0.3092 0.1546
73 0.7996 0.4009 0.2004
74 0.7627 0.4747 0.2373
75 0.7187 0.5625 0.2813
76 0.662 0.676 0.338
77 0.6123 0.7753 0.3877
78 0.6015 0.797 0.3985
79 0.615 0.77 0.385
80 0.6193 0.7613 0.3807
81 0.5497 0.9005 0.4503
82 0.4871 0.9742 0.5129
83 0.4148 0.8295 0.5852
84 0.4071 0.8142 0.5929
85 0.3471 0.6941 0.6529
86 0.4841 0.9682 0.5159
87 0.6509 0.6982 0.3491
88 0.8972 0.2056 0.1028
89 0.8512 0.2977 0.1488
90 0.7911 0.4178 0.2089
91 0.8199 0.3602 0.1801
92 0.9569 0.08617 0.04308
93 0.9071 0.1859 0.09294
94 0.8895 0.221 0.1105

\begin{tabular}{lllllllll}
\hline
Goldfeld-Quandt test for Heteroskedasticity \tabularnewline
p-values & Alternative Hypothesis \tabularnewline
breakpoint index & greater & 2-sided & less \tabularnewline
18 &  0.2876 &  0.5752 &  0.7124 \tabularnewline
19 &  0.1496 &  0.2993 &  0.8504 \tabularnewline
20 &  0.0724 &  0.1448 &  0.9276 \tabularnewline
21 &  0.1153 &  0.2306 &  0.8847 \tabularnewline
22 &  0.06948 &  0.139 &  0.9305 \tabularnewline
23 &  0.05271 &  0.1054 &  0.9473 \tabularnewline
24 &  0.1456 &  0.2911 &  0.8544 \tabularnewline
25 &  0.1231 &  0.2462 &  0.8769 \tabularnewline
26 &  0.0923 &  0.1846 &  0.9077 \tabularnewline
27 &  0.0618 &  0.1236 &  0.9382 \tabularnewline
28 &  0.0384 &  0.0768 &  0.9616 \tabularnewline
29 &  0.03179 &  0.06359 &  0.9682 \tabularnewline
30 &  0.0203 &  0.0406 &  0.9797 \tabularnewline
31 &  0.01967 &  0.03933 &  0.9803 \tabularnewline
32 &  0.02944 &  0.05888 &  0.9706 \tabularnewline
33 &  0.01975 &  0.03949 &  0.9803 \tabularnewline
34 &  0.01224 &  0.02448 &  0.9878 \tabularnewline
35 &  0.02151 &  0.04302 &  0.9785 \tabularnewline
36 &  0.01614 &  0.03228 &  0.9839 \tabularnewline
37 &  0.01391 &  0.02782 &  0.9861 \tabularnewline
38 &  0.01907 &  0.03814 &  0.9809 \tabularnewline
39 &  0.01748 &  0.03497 &  0.9825 \tabularnewline
40 &  0.01387 &  0.02774 &  0.9861 \tabularnewline
41 &  0.03212 &  0.06424 &  0.9679 \tabularnewline
42 &  0.03057 &  0.06114 &  0.9694 \tabularnewline
43 &  0.02196 &  0.04392 &  0.978 \tabularnewline
44 &  0.01753 &  0.03506 &  0.9825 \tabularnewline
45 &  0.01433 &  0.02865 &  0.9857 \tabularnewline
46 &  0.009542 &  0.01908 &  0.9905 \tabularnewline
47 &  0.006162 &  0.01232 &  0.9938 \tabularnewline
48 &  0.004968 &  0.009935 &  0.995 \tabularnewline
49 &  0.003358 &  0.006717 &  0.9966 \tabularnewline
50 &  0.002258 &  0.004517 &  0.9977 \tabularnewline
51 &  0.001389 &  0.002777 &  0.9986 \tabularnewline
52 &  0.001119 &  0.002239 &  0.9989 \tabularnewline
53 &  0.001173 &  0.002346 &  0.9988 \tabularnewline
54 &  0.000692 &  0.001384 &  0.9993 \tabularnewline
55 &  0.0006063 &  0.001213 &  0.9994 \tabularnewline
56 &  0.003127 &  0.006253 &  0.9969 \tabularnewline
57 &  0.03704 &  0.07408 &  0.963 \tabularnewline
58 &  0.2359 &  0.4718 &  0.7641 \tabularnewline
59 &  0.2494 &  0.4988 &  0.7506 \tabularnewline
60 &  0.3121 &  0.6242 &  0.6879 \tabularnewline
61 &  0.4878 &  0.9757 &  0.5122 \tabularnewline
62 &  0.5541 &  0.8917 &  0.4459 \tabularnewline
63 &  0.5764 &  0.8471 &  0.4236 \tabularnewline
64 &  0.5887 &  0.8226 &  0.4113 \tabularnewline
65 &  0.676 &  0.6481 &  0.324 \tabularnewline
66 &  0.7469 &  0.5061 &  0.2531 \tabularnewline
67 &  0.847 &  0.306 &  0.153 \tabularnewline
68 &  0.9249 &  0.1501 &  0.07507 \tabularnewline
69 &  0.9022 &  0.1956 &  0.09782 \tabularnewline
70 &  0.9014 &  0.1972 &  0.09861 \tabularnewline
71 &  0.8823 &  0.2354 &  0.1177 \tabularnewline
72 &  0.8454 &  0.3092 &  0.1546 \tabularnewline
73 &  0.7996 &  0.4009 &  0.2004 \tabularnewline
74 &  0.7627 &  0.4747 &  0.2373 \tabularnewline
75 &  0.7187 &  0.5625 &  0.2813 \tabularnewline
76 &  0.662 &  0.676 &  0.338 \tabularnewline
77 &  0.6123 &  0.7753 &  0.3877 \tabularnewline
78 &  0.6015 &  0.797 &  0.3985 \tabularnewline
79 &  0.615 &  0.77 &  0.385 \tabularnewline
80 &  0.6193 &  0.7613 &  0.3807 \tabularnewline
81 &  0.5497 &  0.9005 &  0.4503 \tabularnewline
82 &  0.4871 &  0.9742 &  0.5129 \tabularnewline
83 &  0.4148 &  0.8295 &  0.5852 \tabularnewline
84 &  0.4071 &  0.8142 &  0.5929 \tabularnewline
85 &  0.3471 &  0.6941 &  0.6529 \tabularnewline
86 &  0.4841 &  0.9682 &  0.5159 \tabularnewline
87 &  0.6509 &  0.6982 &  0.3491 \tabularnewline
88 &  0.8972 &  0.2056 &  0.1028 \tabularnewline
89 &  0.8512 &  0.2977 &  0.1488 \tabularnewline
90 &  0.7911 &  0.4178 &  0.2089 \tabularnewline
91 &  0.8199 &  0.3602 &  0.1801 \tabularnewline
92 &  0.9569 &  0.08617 &  0.04308 \tabularnewline
93 &  0.9071 &  0.1859 &  0.09294 \tabularnewline
94 &  0.8895 &  0.221 &  0.1105 \tabularnewline
\hline
\end{tabular}
%Source: https://freestatistics.org/blog/index.php?pk=308075&T=6

[TABLE]
[ROW][C]Goldfeld-Quandt test for Heteroskedasticity[/C][/ROW]
[ROW][C]p-values[/C][C]Alternative Hypothesis[/C][/ROW]
[ROW][C]breakpoint index[/C][C]greater[/C][C]2-sided[/C][C]less[/C][/ROW]
[ROW][C]18[/C][C] 0.2876[/C][C] 0.5752[/C][C] 0.7124[/C][/ROW]
[ROW][C]19[/C][C] 0.1496[/C][C] 0.2993[/C][C] 0.8504[/C][/ROW]
[ROW][C]20[/C][C] 0.0724[/C][C] 0.1448[/C][C] 0.9276[/C][/ROW]
[ROW][C]21[/C][C] 0.1153[/C][C] 0.2306[/C][C] 0.8847[/C][/ROW]
[ROW][C]22[/C][C] 0.06948[/C][C] 0.139[/C][C] 0.9305[/C][/ROW]
[ROW][C]23[/C][C] 0.05271[/C][C] 0.1054[/C][C] 0.9473[/C][/ROW]
[ROW][C]24[/C][C] 0.1456[/C][C] 0.2911[/C][C] 0.8544[/C][/ROW]
[ROW][C]25[/C][C] 0.1231[/C][C] 0.2462[/C][C] 0.8769[/C][/ROW]
[ROW][C]26[/C][C] 0.0923[/C][C] 0.1846[/C][C] 0.9077[/C][/ROW]
[ROW][C]27[/C][C] 0.0618[/C][C] 0.1236[/C][C] 0.9382[/C][/ROW]
[ROW][C]28[/C][C] 0.0384[/C][C] 0.0768[/C][C] 0.9616[/C][/ROW]
[ROW][C]29[/C][C] 0.03179[/C][C] 0.06359[/C][C] 0.9682[/C][/ROW]
[ROW][C]30[/C][C] 0.0203[/C][C] 0.0406[/C][C] 0.9797[/C][/ROW]
[ROW][C]31[/C][C] 0.01967[/C][C] 0.03933[/C][C] 0.9803[/C][/ROW]
[ROW][C]32[/C][C] 0.02944[/C][C] 0.05888[/C][C] 0.9706[/C][/ROW]
[ROW][C]33[/C][C] 0.01975[/C][C] 0.03949[/C][C] 0.9803[/C][/ROW]
[ROW][C]34[/C][C] 0.01224[/C][C] 0.02448[/C][C] 0.9878[/C][/ROW]
[ROW][C]35[/C][C] 0.02151[/C][C] 0.04302[/C][C] 0.9785[/C][/ROW]
[ROW][C]36[/C][C] 0.01614[/C][C] 0.03228[/C][C] 0.9839[/C][/ROW]
[ROW][C]37[/C][C] 0.01391[/C][C] 0.02782[/C][C] 0.9861[/C][/ROW]
[ROW][C]38[/C][C] 0.01907[/C][C] 0.03814[/C][C] 0.9809[/C][/ROW]
[ROW][C]39[/C][C] 0.01748[/C][C] 0.03497[/C][C] 0.9825[/C][/ROW]
[ROW][C]40[/C][C] 0.01387[/C][C] 0.02774[/C][C] 0.9861[/C][/ROW]
[ROW][C]41[/C][C] 0.03212[/C][C] 0.06424[/C][C] 0.9679[/C][/ROW]
[ROW][C]42[/C][C] 0.03057[/C][C] 0.06114[/C][C] 0.9694[/C][/ROW]
[ROW][C]43[/C][C] 0.02196[/C][C] 0.04392[/C][C] 0.978[/C][/ROW]
[ROW][C]44[/C][C] 0.01753[/C][C] 0.03506[/C][C] 0.9825[/C][/ROW]
[ROW][C]45[/C][C] 0.01433[/C][C] 0.02865[/C][C] 0.9857[/C][/ROW]
[ROW][C]46[/C][C] 0.009542[/C][C] 0.01908[/C][C] 0.9905[/C][/ROW]
[ROW][C]47[/C][C] 0.006162[/C][C] 0.01232[/C][C] 0.9938[/C][/ROW]
[ROW][C]48[/C][C] 0.004968[/C][C] 0.009935[/C][C] 0.995[/C][/ROW]
[ROW][C]49[/C][C] 0.003358[/C][C] 0.006717[/C][C] 0.9966[/C][/ROW]
[ROW][C]50[/C][C] 0.002258[/C][C] 0.004517[/C][C] 0.9977[/C][/ROW]
[ROW][C]51[/C][C] 0.001389[/C][C] 0.002777[/C][C] 0.9986[/C][/ROW]
[ROW][C]52[/C][C] 0.001119[/C][C] 0.002239[/C][C] 0.9989[/C][/ROW]
[ROW][C]53[/C][C] 0.001173[/C][C] 0.002346[/C][C] 0.9988[/C][/ROW]
[ROW][C]54[/C][C] 0.000692[/C][C] 0.001384[/C][C] 0.9993[/C][/ROW]
[ROW][C]55[/C][C] 0.0006063[/C][C] 0.001213[/C][C] 0.9994[/C][/ROW]
[ROW][C]56[/C][C] 0.003127[/C][C] 0.006253[/C][C] 0.9969[/C][/ROW]
[ROW][C]57[/C][C] 0.03704[/C][C] 0.07408[/C][C] 0.963[/C][/ROW]
[ROW][C]58[/C][C] 0.2359[/C][C] 0.4718[/C][C] 0.7641[/C][/ROW]
[ROW][C]59[/C][C] 0.2494[/C][C] 0.4988[/C][C] 0.7506[/C][/ROW]
[ROW][C]60[/C][C] 0.3121[/C][C] 0.6242[/C][C] 0.6879[/C][/ROW]
[ROW][C]61[/C][C] 0.4878[/C][C] 0.9757[/C][C] 0.5122[/C][/ROW]
[ROW][C]62[/C][C] 0.5541[/C][C] 0.8917[/C][C] 0.4459[/C][/ROW]
[ROW][C]63[/C][C] 0.5764[/C][C] 0.8471[/C][C] 0.4236[/C][/ROW]
[ROW][C]64[/C][C] 0.5887[/C][C] 0.8226[/C][C] 0.4113[/C][/ROW]
[ROW][C]65[/C][C] 0.676[/C][C] 0.6481[/C][C] 0.324[/C][/ROW]
[ROW][C]66[/C][C] 0.7469[/C][C] 0.5061[/C][C] 0.2531[/C][/ROW]
[ROW][C]67[/C][C] 0.847[/C][C] 0.306[/C][C] 0.153[/C][/ROW]
[ROW][C]68[/C][C] 0.9249[/C][C] 0.1501[/C][C] 0.07507[/C][/ROW]
[ROW][C]69[/C][C] 0.9022[/C][C] 0.1956[/C][C] 0.09782[/C][/ROW]
[ROW][C]70[/C][C] 0.9014[/C][C] 0.1972[/C][C] 0.09861[/C][/ROW]
[ROW][C]71[/C][C] 0.8823[/C][C] 0.2354[/C][C] 0.1177[/C][/ROW]
[ROW][C]72[/C][C] 0.8454[/C][C] 0.3092[/C][C] 0.1546[/C][/ROW]
[ROW][C]73[/C][C] 0.7996[/C][C] 0.4009[/C][C] 0.2004[/C][/ROW]
[ROW][C]74[/C][C] 0.7627[/C][C] 0.4747[/C][C] 0.2373[/C][/ROW]
[ROW][C]75[/C][C] 0.7187[/C][C] 0.5625[/C][C] 0.2813[/C][/ROW]
[ROW][C]76[/C][C] 0.662[/C][C] 0.676[/C][C] 0.338[/C][/ROW]
[ROW][C]77[/C][C] 0.6123[/C][C] 0.7753[/C][C] 0.3877[/C][/ROW]
[ROW][C]78[/C][C] 0.6015[/C][C] 0.797[/C][C] 0.3985[/C][/ROW]
[ROW][C]79[/C][C] 0.615[/C][C] 0.77[/C][C] 0.385[/C][/ROW]
[ROW][C]80[/C][C] 0.6193[/C][C] 0.7613[/C][C] 0.3807[/C][/ROW]
[ROW][C]81[/C][C] 0.5497[/C][C] 0.9005[/C][C] 0.4503[/C][/ROW]
[ROW][C]82[/C][C] 0.4871[/C][C] 0.9742[/C][C] 0.5129[/C][/ROW]
[ROW][C]83[/C][C] 0.4148[/C][C] 0.8295[/C][C] 0.5852[/C][/ROW]
[ROW][C]84[/C][C] 0.4071[/C][C] 0.8142[/C][C] 0.5929[/C][/ROW]
[ROW][C]85[/C][C] 0.3471[/C][C] 0.6941[/C][C] 0.6529[/C][/ROW]
[ROW][C]86[/C][C] 0.4841[/C][C] 0.9682[/C][C] 0.5159[/C][/ROW]
[ROW][C]87[/C][C] 0.6509[/C][C] 0.6982[/C][C] 0.3491[/C][/ROW]
[ROW][C]88[/C][C] 0.8972[/C][C] 0.2056[/C][C] 0.1028[/C][/ROW]
[ROW][C]89[/C][C] 0.8512[/C][C] 0.2977[/C][C] 0.1488[/C][/ROW]
[ROW][C]90[/C][C] 0.7911[/C][C] 0.4178[/C][C] 0.2089[/C][/ROW]
[ROW][C]91[/C][C] 0.8199[/C][C] 0.3602[/C][C] 0.1801[/C][/ROW]
[ROW][C]92[/C][C] 0.9569[/C][C] 0.08617[/C][C] 0.04308[/C][/ROW]
[ROW][C]93[/C][C] 0.9071[/C][C] 0.1859[/C][C] 0.09294[/C][/ROW]
[ROW][C]94[/C][C] 0.8895[/C][C] 0.221[/C][C] 0.1105[/C][/ROW]
[/TABLE]
Source: https://freestatistics.org/blog/index.php?pk=308075&T=6

Globally Unique Identifier (entire table): ba.freestatistics.org/blog/index.php?pk=308075&T=6

As an alternative you can also use a QR Code:  

The GUIDs for individual cells are displayed in the table below:

Goldfeld-Quandt test for Heteroskedasticity
p-valuesAlternative Hypothesis
breakpoint indexgreater2-sidedless
18 0.2876 0.5752 0.7124
19 0.1496 0.2993 0.8504
20 0.0724 0.1448 0.9276
21 0.1153 0.2306 0.8847
22 0.06948 0.139 0.9305
23 0.05271 0.1054 0.9473
24 0.1456 0.2911 0.8544
25 0.1231 0.2462 0.8769
26 0.0923 0.1846 0.9077
27 0.0618 0.1236 0.9382
28 0.0384 0.0768 0.9616
29 0.03179 0.06359 0.9682
30 0.0203 0.0406 0.9797
31 0.01967 0.03933 0.9803
32 0.02944 0.05888 0.9706
33 0.01975 0.03949 0.9803
34 0.01224 0.02448 0.9878
35 0.02151 0.04302 0.9785
36 0.01614 0.03228 0.9839
37 0.01391 0.02782 0.9861
38 0.01907 0.03814 0.9809
39 0.01748 0.03497 0.9825
40 0.01387 0.02774 0.9861
41 0.03212 0.06424 0.9679
42 0.03057 0.06114 0.9694
43 0.02196 0.04392 0.978
44 0.01753 0.03506 0.9825
45 0.01433 0.02865 0.9857
46 0.009542 0.01908 0.9905
47 0.006162 0.01232 0.9938
48 0.004968 0.009935 0.995
49 0.003358 0.006717 0.9966
50 0.002258 0.004517 0.9977
51 0.001389 0.002777 0.9986
52 0.001119 0.002239 0.9989
53 0.001173 0.002346 0.9988
54 0.000692 0.001384 0.9993
55 0.0006063 0.001213 0.9994
56 0.003127 0.006253 0.9969
57 0.03704 0.07408 0.963
58 0.2359 0.4718 0.7641
59 0.2494 0.4988 0.7506
60 0.3121 0.6242 0.6879
61 0.4878 0.9757 0.5122
62 0.5541 0.8917 0.4459
63 0.5764 0.8471 0.4236
64 0.5887 0.8226 0.4113
65 0.676 0.6481 0.324
66 0.7469 0.5061 0.2531
67 0.847 0.306 0.153
68 0.9249 0.1501 0.07507
69 0.9022 0.1956 0.09782
70 0.9014 0.1972 0.09861
71 0.8823 0.2354 0.1177
72 0.8454 0.3092 0.1546
73 0.7996 0.4009 0.2004
74 0.7627 0.4747 0.2373
75 0.7187 0.5625 0.2813
76 0.662 0.676 0.338
77 0.6123 0.7753 0.3877
78 0.6015 0.797 0.3985
79 0.615 0.77 0.385
80 0.6193 0.7613 0.3807
81 0.5497 0.9005 0.4503
82 0.4871 0.9742 0.5129
83 0.4148 0.8295 0.5852
84 0.4071 0.8142 0.5929
85 0.3471 0.6941 0.6529
86 0.4841 0.9682 0.5159
87 0.6509 0.6982 0.3491
88 0.8972 0.2056 0.1028
89 0.8512 0.2977 0.1488
90 0.7911 0.4178 0.2089
91 0.8199 0.3602 0.1801
92 0.9569 0.08617 0.04308
93 0.9071 0.1859 0.09294
94 0.8895 0.221 0.1105


Meta Analysis of Goldfeld-Quandt test for Heteroskedasticity
Description# significant tests% significant testsOK/NOK
1% type I error level9 0.1169NOK
5% type I error level240.311688NOK
10% type I error level310.402597NOK

\begin{tabular}{lllllllll}
\hline
Meta Analysis of Goldfeld-Quandt test for Heteroskedasticity \tabularnewline
Description & # significant tests & % significant tests & OK/NOK \tabularnewline
1% type I error level & 9 &  0.1169 & NOK \tabularnewline
5% type I error level & 24 & 0.311688 & NOK \tabularnewline
10% type I error level & 31 & 0.402597 & NOK \tabularnewline
\hline
\end{tabular}
%Source: https://freestatistics.org/blog/index.php?pk=308075&T=7

[TABLE]
[ROW][C]Meta Analysis of Goldfeld-Quandt test for Heteroskedasticity[/C][/ROW]
[ROW][C]Description[/C][C]# significant tests[/C][C]% significant tests[/C][C]OK/NOK[/C][/ROW]
[ROW][C]1% type I error level[/C][C]9[/C][C] 0.1169[/C][C]NOK[/C][/ROW]
[ROW][C]5% type I error level[/C][C]24[/C][C]0.311688[/C][C]NOK[/C][/ROW]
[ROW][C]10% type I error level[/C][C]31[/C][C]0.402597[/C][C]NOK[/C][/ROW]
[/TABLE]
Source: https://freestatistics.org/blog/index.php?pk=308075&T=7

Globally Unique Identifier (entire table): ba.freestatistics.org/blog/index.php?pk=308075&T=7

As an alternative you can also use a QR Code:  

The GUIDs for individual cells are displayed in the table below:

Meta Analysis of Goldfeld-Quandt test for Heteroskedasticity
Description# significant tests% significant testsOK/NOK
1% type I error level9 0.1169NOK
5% type I error level240.311688NOK
10% type I error level310.402597NOK


Ramsey RESET F-Test for powers (2 and 3) of fitted values
> reset_test_fitted
	RESET test
data:  mylm
RESET = 1.5107, df1 = 2, df2 = 95, p-value = 0.226
Ramsey RESET F-Test for powers (2 and 3) of regressors
> reset_test_regressors
	RESET test
data:  mylm
RESET = 0.28519, df1 = 28, df2 = 69, p-value = 0.9998
Ramsey RESET F-Test for powers (2 and 3) of principal components
> reset_test_principal_components
	RESET test
data:  mylm
RESET = 0.26644, df1 = 2, df2 = 95, p-value = 0.7667

\begin{tabular}{lllllllll}
\hline
Ramsey RESET F-Test for powers (2 and 3) of fitted values \tabularnewline
> reset_test_fitted
	RESET test
data:  mylm
RESET = 1.5107, df1 = 2, df2 = 95, p-value = 0.226
\tabularnewline Ramsey RESET F-Test for powers (2 and 3) of regressors \tabularnewline
> reset_test_regressors
	RESET test
data:  mylm
RESET = 0.28519, df1 = 28, df2 = 69, p-value = 0.9998
\tabularnewline Ramsey RESET F-Test for powers (2 and 3) of principal components \tabularnewline
> reset_test_principal_components
	RESET test
data:  mylm
RESET = 0.26644, df1 = 2, df2 = 95, p-value = 0.7667
\tabularnewline \hline \end{tabular} %Source: https://freestatistics.org/blog/index.php?pk=308075&T=8

[TABLE]
[ROW][C]Ramsey RESET F-Test for powers (2 and 3) of fitted values[/C][/ROW]
[ROW][C]
> reset_test_fitted
	RESET test
data:  mylm
RESET = 1.5107, df1 = 2, df2 = 95, p-value = 0.226
[/C][/ROW] [ROW][C]Ramsey RESET F-Test for powers (2 and 3) of regressors[/C][/ROW] [ROW][C]
> reset_test_regressors
	RESET test
data:  mylm
RESET = 0.28519, df1 = 28, df2 = 69, p-value = 0.9998
[/C][/ROW] [ROW][C]Ramsey RESET F-Test for powers (2 and 3) of principal components[/C][/ROW] [ROW][C]
> reset_test_principal_components
	RESET test
data:  mylm
RESET = 0.26644, df1 = 2, df2 = 95, p-value = 0.7667
[/C][/ROW] [/TABLE] Source: https://freestatistics.org/blog/index.php?pk=308075&T=8

Globally Unique Identifier (entire table): ba.freestatistics.org/blog/index.php?pk=308075&T=8

As an alternative you can also use a QR Code:  

The GUIDs for individual cells are displayed in the table below:

Ramsey RESET F-Test for powers (2 and 3) of fitted values
> reset_test_fitted
	RESET test
data:  mylm
RESET = 1.5107, df1 = 2, df2 = 95, p-value = 0.226
Ramsey RESET F-Test for powers (2 and 3) of regressors
> reset_test_regressors
	RESET test
data:  mylm
RESET = 0.28519, df1 = 28, df2 = 69, p-value = 0.9998
Ramsey RESET F-Test for powers (2 and 3) of principal components
> reset_test_principal_components
	RESET test
data:  mylm
RESET = 0.26644, df1 = 2, df2 = 95, p-value = 0.7667


Variance Inflation Factors (Multicollinearity)
> vif
           huwelijken              Inflatie Consumentenvertrouwen 
            16.389352              1.038281              1.037439 
                   M1                    M2                    M3 
             2.039880              5.627027              9.829672 
                   M4                    M5                    M6 
             8.437153             11.333771              9.054346 
                   M7                    M8                    M9 
             7.638893              5.197182              2.416497 
                  M10                   M11 
             1.966193              2.069346 

\begin{tabular}{lllllllll}
\hline
Variance Inflation Factors (Multicollinearity) \tabularnewline
> vif
           huwelijken              Inflatie Consumentenvertrouwen 
            16.389352              1.038281              1.037439 
                   M1                    M2                    M3 
             2.039880              5.627027              9.829672 
                   M4                    M5                    M6 
             8.437153             11.333771              9.054346 
                   M7                    M8                    M9 
             7.638893              5.197182              2.416497 
                  M10                   M11 
             1.966193              2.069346 
\tabularnewline \hline \end{tabular} %Source: https://freestatistics.org/blog/index.php?pk=308075&T=9

[TABLE]
[ROW][C]Variance Inflation Factors (Multicollinearity)[/C][/ROW]
[ROW][C]
> vif
           huwelijken              Inflatie Consumentenvertrouwen 
            16.389352              1.038281              1.037439 
                   M1                    M2                    M3 
             2.039880              5.627027              9.829672 
                   M4                    M5                    M6 
             8.437153             11.333771              9.054346 
                   M7                    M8                    M9 
             7.638893              5.197182              2.416497 
                  M10                   M11 
             1.966193              2.069346 
[/C][/ROW] [/TABLE] Source: https://freestatistics.org/blog/index.php?pk=308075&T=9

Globally Unique Identifier (entire table): ba.freestatistics.org/blog/index.php?pk=308075&T=9

As an alternative you can also use a QR Code:  

The GUIDs for individual cells are displayed in the table below:

Variance Inflation Factors (Multicollinearity)
> vif
           huwelijken              Inflatie Consumentenvertrouwen 
            16.389352              1.038281              1.037439 
                   M1                    M2                    M3 
             2.039880              5.627027              9.829672 
                   M4                    M5                    M6 
             8.437153             11.333771              9.054346 
                   M7                    M8                    M9 
             7.638893              5.197182              2.416497 
                  M10                   M11 
             1.966193              2.069346 


Parameters (Session):
par1 = 1 ; par2 = Include Seasonal Dummies ; par3 = No Linear Trend ; par6 = 12 ;
Parameters (R input):
par1 = 1 ; par2 = Include Seasonal Dummies ; par3 = No Linear Trend ; par4 = ; par5 = ; par6 = 12 ;
R code (references can be found in the software module):
library(lattice)
library(lmtest)
library(car)
library(MASS)
n25 <- 25 #minimum number of obs. for Goldfeld-Quandt test
mywarning <- ''
par6 <- as.numeric(par6)
if(is.na(par6)) {
par6 <- 12
mywarning = 'Warning: you did not specify the seasonality. The seasonal period was set to s = 12.'
}
par1 <- as.numeric(par1)
if(is.na(par1)) {
par1 <- 1
mywarning = 'Warning: you did not specify the column number of the endogenous series! The first column was selected by default.'
}
if (par4=='') par4 <- 0
par4 <- as.numeric(par4)
if (!is.numeric(par4)) par4 <- 0
if (par5=='') par5 <- 0
par5 <- as.numeric(par5)
if (!is.numeric(par5)) par5 <- 0
x <- na.omit(t(y))
k <- length(x[1,])
n <- length(x[,1])
x1 <- cbind(x[,par1], x[,1:k!=par1])
mycolnames <- c(colnames(x)[par1], colnames(x)[1:k!=par1])
colnames(x1) <- mycolnames #colnames(x)[par1]
x <- x1
if (par3 == 'First Differences'){
(n <- n -1)
x2 <- array(0, dim=c(n,k), dimnames=list(1:n, paste('(1-B)',colnames(x),sep='')))
for (i in 1:n) {
for (j in 1:k) {
x2[i,j] <- x[i+1,j] - x[i,j]
}
}
x <- x2
}
if (par3 == 'Seasonal Differences (s)'){
(n <- n - par6)
x2 <- array(0, dim=c(n,k), dimnames=list(1:n, paste('(1-Bs)',colnames(x),sep='')))
for (i in 1:n) {
for (j in 1:k) {
x2[i,j] <- x[i+par6,j] - x[i,j]
}
}
x <- x2
}
if (par3 == 'First and Seasonal Differences (s)'){
(n <- n -1)
x2 <- array(0, dim=c(n,k), dimnames=list(1:n, paste('(1-B)',colnames(x),sep='')))
for (i in 1:n) {
for (j in 1:k) {
x2[i,j] <- x[i+1,j] - x[i,j]
}
}
x <- x2
(n <- n - par6)
x2 <- array(0, dim=c(n,k), dimnames=list(1:n, paste('(1-Bs)',colnames(x),sep='')))
for (i in 1:n) {
for (j in 1:k) {
x2[i,j] <- x[i+par6,j] - x[i,j]
}
}
x <- x2
}
if(par4 > 0) {
x2 <- array(0, dim=c(n-par4,par4), dimnames=list(1:(n-par4), paste(colnames(x)[par1],'(t-',1:par4,')',sep='')))
for (i in 1:(n-par4)) {
for (j in 1:par4) {
x2[i,j] <- x[i+par4-j,par1]
}
}
x <- cbind(x[(par4+1):n,], x2)
n <- n - par4
}
if(par5 > 0) {
x2 <- array(0, dim=c(n-par5*par6,par5), dimnames=list(1:(n-par5*par6), paste(colnames(x)[par1],'(t-',1:par5,'s)',sep='')))
for (i in 1:(n-par5*par6)) {
for (j in 1:par5) {
x2[i,j] <- x[i+par5*par6-j*par6,par1]
}
}
x <- cbind(x[(par5*par6+1):n,], x2)
n <- n - par5*par6
}
if (par2 == 'Include Seasonal Dummies'){
x2 <- array(0, dim=c(n,par6-1), dimnames=list(1:n, paste('M', seq(1:(par6-1)), sep ='')))
for (i in 1:(par6-1)){
x2[seq(i,n,par6),i] <- 1
}
x <- cbind(x, x2)
}
if (par2 == 'Include Monthly Dummies'){
x2 <- array(0, dim=c(n,11), dimnames=list(1:n, paste('M', seq(1:11), sep ='')))
for (i in 1:11){
x2[seq(i,n,12),i] <- 1
}
x <- cbind(x, x2)
}
if (par2 == 'Include Quarterly Dummies'){
x2 <- array(0, dim=c(n,3), dimnames=list(1:n, paste('Q', seq(1:3), sep ='')))
for (i in 1:3){
x2[seq(i,n,4),i] <- 1
}
x <- cbind(x, x2)
}
(k <- length(x[n,]))
if (par3 == 'Linear Trend'){
x <- cbind(x, c(1:n))
colnames(x)[k+1] <- 't'
}
print(x)
(k <- length(x[n,]))
head(x)
df <- as.data.frame(x)
(mylm <- lm(df))
(mysum <- summary(mylm))
if (n > n25) {
kp3 <- k + 3
nmkm3 <- n - k - 3
gqarr <- array(NA, dim=c(nmkm3-kp3+1,3))
numgqtests <- 0
numsignificant1 <- 0
numsignificant5 <- 0
numsignificant10 <- 0
for (mypoint in kp3:nmkm3) {
j <- 0
numgqtests <- numgqtests + 1
for (myalt in c('greater', 'two.sided', 'less')) {
j <- j + 1
gqarr[mypoint-kp3+1,j] <- gqtest(mylm, point=mypoint, alternative=myalt)$p.value
}
if (gqarr[mypoint-kp3+1,2] < 0.01) numsignificant1 <- numsignificant1 + 1
if (gqarr[mypoint-kp3+1,2] < 0.05) numsignificant5 <- numsignificant5 + 1
if (gqarr[mypoint-kp3+1,2] < 0.10) numsignificant10 <- numsignificant10 + 1
}
gqarr
}
bitmap(file='test0.png')
plot(x[,1], type='l', main='Actuals and Interpolation', ylab='value of Actuals and Interpolation (dots)', xlab='time or index')
points(x[,1]-mysum$resid)
grid()
dev.off()
bitmap(file='test1.png')
plot(mysum$resid, type='b', pch=19, main='Residuals', ylab='value of Residuals', xlab='time or index')
grid()
dev.off()
bitmap(file='test2.png')
sresid <- studres(mylm)
hist(sresid, freq=FALSE, main='Distribution of Studentized Residuals')
xfit<-seq(min(sresid),max(sresid),length=40)
yfit<-dnorm(xfit)
lines(xfit, yfit)
grid()
dev.off()
bitmap(file='test3.png')
densityplot(~mysum$resid,col='black',main='Residual Density Plot', xlab='values of Residuals')
dev.off()
bitmap(file='test4.png')
qqPlot(mylm, main='QQ Plot')
grid()
dev.off()
(myerror <- as.ts(mysum$resid))
bitmap(file='test5.png')
dum <- cbind(lag(myerror,k=1),myerror)
dum
dum1 <- dum[2:length(myerror),]
dum1
z <- as.data.frame(dum1)
print(z)
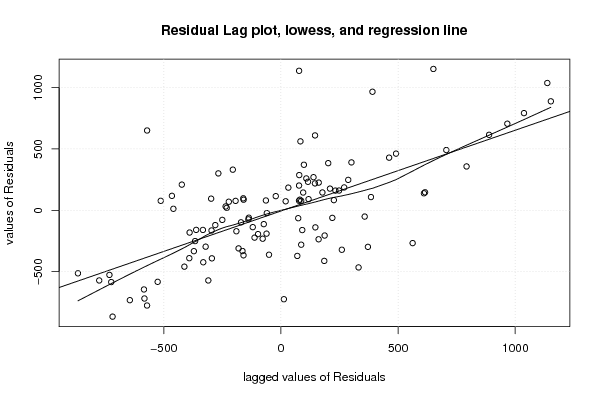
plot(z,main=paste('Residual Lag plot, lowess, and regression line'), ylab='values of Residuals', xlab='lagged values of Residuals')
lines(lowess(z))
abline(lm(z))
grid()
dev.off()
bitmap(file='test6.png')
acf(mysum$resid, lag.max=length(mysum$resid)/2, main='Residual Autocorrelation Function')
grid()
dev.off()
bitmap(file='test7.png')
pacf(mysum$resid, lag.max=length(mysum$resid)/2, main='Residual Partial Autocorrelation Function')
grid()
dev.off()
bitmap(file='test8.png')
opar <- par(mfrow = c(2,2), oma = c(0, 0, 1.1, 0))
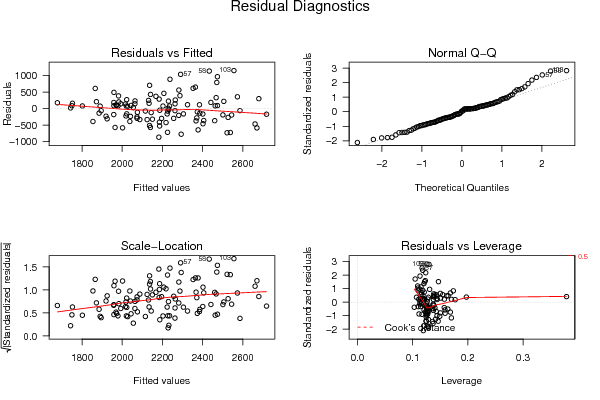
plot(mylm, las = 1, sub='Residual Diagnostics')
par(opar)
dev.off()
if (n > n25) {
bitmap(file='test9.png')
plot(kp3:nmkm3,gqarr[,2], main='Goldfeld-Quandt test',ylab='2-sided p-value',xlab='breakpoint')
grid()
dev.off()
}
load(file='createtable')
a<-table.start()
a<-table.row.start(a)
a<-table.element(a, 'Multiple Linear Regression - Estimated Regression Equation', 1, TRUE)
a<-table.row.end(a)
myeq <- colnames(x)[1]
myeq <- paste(myeq, '[t] = ', sep='')
for (i in 1:k){
if (mysum$coefficients[i,1] > 0) myeq <- paste(myeq, '+', '')
myeq <- paste(myeq, signif(mysum$coefficients[i,1],6), sep=' ')
if (rownames(mysum$coefficients)[i] != '(Intercept)') {
myeq <- paste(myeq, rownames(mysum$coefficients)[i], sep='')
if (rownames(mysum$coefficients)[i] != 't') myeq <- paste(myeq, '[t]', sep='')
}
}
myeq <- paste(myeq, ' + e[t]')
a<-table.row.start(a)
a<-table.element(a, myeq)
a<-table.row.end(a)
a<-table.row.start(a)
a<-table.element(a, mywarning)
a<-table.row.end(a)
a<-table.end(a)
table.save(a,file='mytable1.tab')
a<-table.start()
a<-table.row.start(a)
a<-table.element(a,'Multiple Linear Regression - Ordinary Least Squares', 6, TRUE)
a<-table.row.end(a)
a<-table.row.start(a)
a<-table.element(a,'Variable',header=TRUE)
a<-table.element(a,'Parameter',header=TRUE)
a<-table.element(a,'S.D.',header=TRUE)
a<-table.element(a,'T-STAT
H0: parameter = 0',header=TRUE)
a<-table.element(a,'2-tail p-value',header=TRUE)
a<-table.element(a,'1-tail p-value',header=TRUE)
a<-table.row.end(a)
for (i in 1:k){
a<-table.row.start(a)
a<-table.element(a,rownames(mysum$coefficients)[i],header=TRUE)
a<-table.element(a,formatC(signif(mysum$coefficients[i,1],5),format='g',flag='+'))
a<-table.element(a,formatC(signif(mysum$coefficients[i,2],5),format='g',flag=' '))
a<-table.element(a,formatC(signif(mysum$coefficients[i,3],4),format='e',flag='+'))
a<-table.element(a,formatC(signif(mysum$coefficients[i,4],4),format='g',flag=' '))
a<-table.element(a,formatC(signif(mysum$coefficients[i,4]/2,4),format='g',flag=' '))
a<-table.row.end(a)
}
a<-table.end(a)
table.save(a,file='mytable2.tab')
a<-table.start()
a<-table.row.start(a)
a<-table.element(a, 'Multiple Linear Regression - Regression Statistics', 2, TRUE)
a<-table.row.end(a)
a<-table.row.start(a)
a<-table.element(a, 'Multiple R',1,TRUE)
a<-table.element(a,formatC(signif(sqrt(mysum$r.squared),6),format='g',flag=' '))
a<-table.row.end(a)
a<-table.row.start(a)
a<-table.element(a, 'R-squared',1,TRUE)
a<-table.element(a,formatC(signif(mysum$r.squared,6),format='g',flag=' '))
a<-table.row.end(a)
a<-table.row.start(a)
a<-table.element(a, 'Adjusted R-squared',1,TRUE)
a<-table.element(a,formatC(signif(mysum$adj.r.squared,6),format='g',flag=' '))
a<-table.row.end(a)
a<-table.row.start(a)
a<-table.element(a, 'F-TEST (value)',1,TRUE)
a<-table.element(a,formatC(signif(mysum$fstatistic[1],6),format='g',flag=' '))
a<-table.row.end(a)
a<-table.row.start(a)
a<-table.element(a, 'F-TEST (DF numerator)',1,TRUE)
a<-table.element(a, signif(mysum$fstatistic[2],6))
a<-table.row.end(a)
a<-table.row.start(a)
a<-table.element(a, 'F-TEST (DF denominator)',1,TRUE)
a<-table.element(a, signif(mysum$fstatistic[3],6))
a<-table.row.end(a)
a<-table.row.start(a)
a<-table.element(a, 'p-value',1,TRUE)
a<-table.element(a,formatC(signif(1-pf(mysum$fstatistic[1],mysum$fstatistic[2],mysum$fstatistic[3]),6),format='g',flag=' '))
a<-table.row.end(a)
a<-table.row.start(a)
a<-table.element(a, 'Multiple Linear Regression - Residual Statistics', 2, TRUE)
a<-table.row.end(a)
a<-table.row.start(a)
a<-table.element(a, 'Residual Standard Deviation',1,TRUE)
a<-table.element(a,formatC(signif(mysum$sigma,6),format='g',flag=' '))
a<-table.row.end(a)
a<-table.row.start(a)
a<-table.element(a, 'Sum Squared Residuals',1,TRUE)
a<-table.element(a,formatC(signif(sum(myerror*myerror),6),format='g',flag=' '))
a<-table.row.end(a)
a<-table.end(a)
table.save(a,file='mytable3.tab')
myr <- as.numeric(mysum$resid)
myr
a <-table.start()
a <- table.row.start(a)
a <- table.element(a,'Menu of Residual Diagnostics',2,TRUE)
a <- table.row.end(a)
a <- table.row.start(a)
a <- table.element(a,'Description',1,TRUE)
a <- table.element(a,'Link',1,TRUE)
a <- table.row.end(a)
a <- table.row.start(a)
a <-table.element(a,'Histogram',1,header=TRUE)
a <- table.element(a,hyperlink( paste('https://supernova.wessa.net/rwasp_histogram.wasp?convertgetintopost=1&data=',paste(as.character(mysum$resid),sep='',collapse=' '),sep='') ,'Compute','Click here to examine the Residuals.'),1)
a <- table.row.end(a)
a <- table.row.start(a)
a <-table.element(a,'Central Tendency',1,header=TRUE)
a <- table.element(a,hyperlink( paste('https://supernova.wessa.net/rwasp_centraltendency.wasp?convertgetintopost=1&data=',paste(as.character(mysum$resid),sep='',collapse=' '),sep='') ,'Compute','Click here to examine the Residuals.'),1)
a <- table.row.end(a)
a <- table.row.start(a)
a <-table.element(a,'QQ Plot',1,header=TRUE)
a <- table.element(a,hyperlink( paste('https://supernova.wessa.net/rwasp_fitdistrnorm.wasp?convertgetintopost=1&data=',paste(as.character(mysum$resid),sep='',collapse=' '),sep='') ,'Compute','Click here to examine the Residuals.'),1)
a <- table.row.end(a)
a <- table.row.start(a)
a <-table.element(a,'Kernel Density Plot',1,header=TRUE)
a <- table.element(a,hyperlink( paste('https://supernova.wessa.net/rwasp_density.wasp?convertgetintopost=1&data=',paste(as.character(mysum$resid),sep='',collapse=' '),sep='') ,'Compute','Click here to examine the Residuals.'),1)
a <- table.row.end(a)
a <- table.row.start(a)
a <-table.element(a,'Skewness/Kurtosis Test',1,header=TRUE)
a <- table.element(a,hyperlink( paste('https://supernova.wessa.net/rwasp_skewness_kurtosis.wasp?convertgetintopost=1&data=',paste(as.character(mysum$resid),sep='',collapse=' '),sep='') ,'Compute','Click here to examine the Residuals.'),1)
a <- table.row.end(a)
a <- table.row.start(a)
a <-table.element(a,'Skewness-Kurtosis Plot',1,header=TRUE)
a <- table.element(a,hyperlink( paste('https://supernova.wessa.net/rwasp_skewness_kurtosis_plot.wasp?convertgetintopost=1&data=',paste(as.character(mysum$resid),sep='',collapse=' '),sep='') ,'Compute','Click here to examine the Residuals.'),1)
a <- table.row.end(a)
a <- table.row.start(a)
a <-table.element(a,'Harrell-Davis Plot',1,header=TRUE)
a <- table.element(a,hyperlink( paste('https://supernova.wessa.net/rwasp_harrell_davis.wasp?convertgetintopost=1&data=',paste(as.character(mysum$resid),sep='',collapse=' '),sep='') ,'Compute','Click here to examine the Residuals.'),1)
a <- table.row.end(a)
a <- table.row.start(a)
a <-table.element(a,'Bootstrap Plot -- Central Tendency',1,header=TRUE)
a <- table.element(a,hyperlink( paste('https://supernova.wessa.net/rwasp_bootstrapplot1.wasp?convertgetintopost=1&data=',paste(as.character(mysum$resid),sep='',collapse=' '),sep='') ,'Compute','Click here to examine the Residuals.'),1)
a <- table.row.end(a)
a <- table.row.start(a)
a <-table.element(a,'Blocked Bootstrap Plot -- Central Tendency',1,header=TRUE)
a <- table.element(a,hyperlink( paste('https://supernova.wessa.net/rwasp_bootstrapplot.wasp?convertgetintopost=1&data=',paste(as.character(mysum$resid),sep='',collapse=' '),sep='') ,'Compute','Click here to examine the Residuals.'),1)
a <- table.row.end(a)
a <- table.row.start(a)
a <-table.element(a,'(Partial) Autocorrelation Plot',1,header=TRUE)
a <- table.element(a,hyperlink( paste('https://supernova.wessa.net/rwasp_autocorrelation.wasp?convertgetintopost=1&data=',paste(as.character(mysum$resid),sep='',collapse=' '),sep='') ,'Compute','Click here to examine the Residuals.'),1)
a <- table.row.end(a)
a <- table.row.start(a)
a <-table.element(a,'Spectral Analysis',1,header=TRUE)
a <- table.element(a,hyperlink( paste('https://supernova.wessa.net/rwasp_spectrum.wasp?convertgetintopost=1&data=',paste(as.character(mysum$resid),sep='',collapse=' '),sep='') ,'Compute','Click here to examine the Residuals.'),1)
a <- table.row.end(a)
a <- table.row.start(a)
a <-table.element(a,'Tukey lambda PPCC Plot',1,header=TRUE)
a <- table.element(a,hyperlink( paste('https://supernova.wessa.net/rwasp_tukeylambda.wasp?convertgetintopost=1&data=',paste(as.character(mysum$resid),sep='',collapse=' '),sep='') ,'Compute','Click here to examine the Residuals.'),1)
a <- table.row.end(a)
a <- table.row.start(a)
a <-table.element(a,'Box-Cox Normality Plot',1,header=TRUE)
a <- table.element(a,hyperlink( paste('https://supernova.wessa.net/rwasp_boxcoxnorm.wasp?convertgetintopost=1&data=',paste(as.character(mysum$resid),sep='',collapse=' '),sep='') ,'Compute','Click here to examine the Residuals.'),1)
a <- table.row.end(a)
a <- table.row.start(a)
a <- table.element(a,'Summary Statistics',1,header=TRUE)
a <- table.element(a,hyperlink( paste('https://supernova.wessa.net/rwasp_summary1.wasp?convertgetintopost=1&data=',paste(as.character(mysum$resid),sep='',collapse=' '),sep='') ,'Compute','Click here to examine the Residuals.'),1)
a <- table.row.end(a)
a<-table.end(a)
table.save(a,file='mytable7.tab')
if(n < 200) {
a<-table.start()
a<-table.row.start(a)
a<-table.element(a, 'Multiple Linear Regression - Actuals, Interpolation, and Residuals', 4, TRUE)
a<-table.row.end(a)
a<-table.row.start(a)
a<-table.element(a, 'Time or Index', 1, TRUE)
a<-table.element(a, 'Actuals', 1, TRUE)
a<-table.element(a, 'Interpolation
Forecast', 1, TRUE)
a<-table.element(a, 'Residuals
Prediction Error', 1, TRUE)
a<-table.row.end(a)
for (i in 1:n) {
a<-table.row.start(a)
a<-table.element(a,i, 1, TRUE)
a<-table.element(a,formatC(signif(x[i],6),format='g',flag=' '))
a<-table.element(a,formatC(signif(x[i]-mysum$resid[i],6),format='g',flag=' '))
a<-table.element(a,formatC(signif(mysum$resid[i],6),format='g',flag=' '))
a<-table.row.end(a)
}
a<-table.end(a)
table.save(a,file='mytable4.tab')
if (n > n25) {
a<-table.start()
a<-table.row.start(a)
a<-table.element(a,'Goldfeld-Quandt test for Heteroskedasticity',4,TRUE)
a<-table.row.end(a)
a<-table.row.start(a)
a<-table.element(a,'p-values',header=TRUE)
a<-table.element(a,'Alternative Hypothesis',3,header=TRUE)
a<-table.row.end(a)
a<-table.row.start(a)
a<-table.element(a,'breakpoint index',header=TRUE)
a<-table.element(a,'greater',header=TRUE)
a<-table.element(a,'2-sided',header=TRUE)
a<-table.element(a,'less',header=TRUE)
a<-table.row.end(a)
for (mypoint in kp3:nmkm3) {
a<-table.row.start(a)
a<-table.element(a,mypoint,header=TRUE)
a<-table.element(a,formatC(signif(gqarr[mypoint-kp3+1,1],6),format='g',flag=' '))
a<-table.element(a,formatC(signif(gqarr[mypoint-kp3+1,2],6),format='g',flag=' '))
a<-table.element(a,formatC(signif(gqarr[mypoint-kp3+1,3],6),format='g',flag=' '))
a<-table.row.end(a)
}
a<-table.end(a)
table.save(a,file='mytable5.tab')
a<-table.start()
a<-table.row.start(a)
a<-table.element(a,'Meta Analysis of Goldfeld-Quandt test for Heteroskedasticity',4,TRUE)
a<-table.row.end(a)
a<-table.row.start(a)
a<-table.element(a,'Description',header=TRUE)
a<-table.element(a,'# significant tests',header=TRUE)
a<-table.element(a,'% significant tests',header=TRUE)
a<-table.element(a,'OK/NOK',header=TRUE)
a<-table.row.end(a)
a<-table.row.start(a)
a<-table.element(a,'1% type I error level',header=TRUE)
a<-table.element(a,signif(numsignificant1,6))
a<-table.element(a,formatC(signif(numsignificant1/numgqtests,6),format='g',flag=' '))
if (numsignificant1/numgqtests < 0.01) dum <- 'OK' else dum <- 'NOK'
a<-table.element(a,dum)
a<-table.row.end(a)
a<-table.row.start(a)
a<-table.element(a,'5% type I error level',header=TRUE)
a<-table.element(a,signif(numsignificant5,6))
a<-table.element(a,signif(numsignificant5/numgqtests,6))
if (numsignificant5/numgqtests < 0.05) dum <- 'OK' else dum <- 'NOK'
a<-table.element(a,dum)
a<-table.row.end(a)
a<-table.row.start(a)
a<-table.element(a,'10% type I error level',header=TRUE)
a<-table.element(a,signif(numsignificant10,6))
a<-table.element(a,signif(numsignificant10/numgqtests,6))
if (numsignificant10/numgqtests < 0.1) dum <- 'OK' else dum <- 'NOK'
a<-table.element(a,dum)
a<-table.row.end(a)
a<-table.end(a)
table.save(a,file='mytable6.tab')
}
}
a<-table.start()
a<-table.row.start(a)
a<-table.element(a,'Ramsey RESET F-Test for powers (2 and 3) of fitted values',1,TRUE)
a<-table.row.end(a)
a<-table.row.start(a)
reset_test_fitted <- resettest(mylm,power=2:3,type='fitted')
a<-table.element(a,paste('
',RC.texteval('reset_test_fitted'),'
',sep=''))
a<-table.row.end(a)
a<-table.row.start(a)
a<-table.element(a,'Ramsey RESET F-Test for powers (2 and 3) of regressors',1,TRUE)
a<-table.row.end(a)
a<-table.row.start(a)
reset_test_regressors <- resettest(mylm,power=2:3,type='regressor')
a<-table.element(a,paste('
',RC.texteval('reset_test_regressors'),'
',sep=''))
a<-table.row.end(a)
a<-table.row.start(a)
a<-table.element(a,'Ramsey RESET F-Test for powers (2 and 3) of principal components',1,TRUE)
a<-table.row.end(a)
a<-table.row.start(a)
reset_test_principal_components <- resettest(mylm,power=2:3,type='princomp')
a<-table.element(a,paste('
',RC.texteval('reset_test_principal_components'),'
',sep=''))
a<-table.row.end(a)
a<-table.end(a)
table.save(a,file='mytable8.tab')
a<-table.start()
a<-table.row.start(a)
a<-table.element(a,'Variance Inflation Factors (Multicollinearity)',1,TRUE)
a<-table.row.end(a)
a<-table.row.start(a)
vif <- vif(mylm)
a<-table.element(a,paste('
',RC.texteval('vif'),'
',sep=''))
a<-table.row.end(a)
a<-table.end(a)
table.save(a,file='mytable9.tab')