Free Statistics

of Irreproducible Research!

Author's title

Author*The author of this computation has been verified*
R Software Modulerwasp_structuraltimeseries.wasp
Title produced by softwareStructural Time Series Models
Date of computationSat, 23 Sep 2017 22:57:10 +0200
Cite this page as followsStatistical Computations at FreeStatistics.org, Office for Research Development and Education, URL https://freestatistics.org/blog/index.php?v=date/2017/Sep/23/t15062004425vwppwq4disxogk.htm/, Retrieved Wed, 15 May 2024 13:08:41 +0200
Statistical Computations at FreeStatistics.org, Office for Research Development and Education, URL https://freestatistics.org/blog/index.php?pk=, Retrieved Wed, 15 May 2024 13:08:41 +0200
QR Codes:

Original text written by user:x
IsPrivate?This computation is private
User-defined keywordsx
Estimated Impact0
Dataseries X:
59598 
54817 
57268 
56905 
57172 
52534 
50479 
49260 
49379 
51475 
50649 
53006 
56105 
50407 
44455 
46145 
43944 
40855 
44169 
41552 
43347 
44335 
43800 
44842 
43113 
42160 
39758 
39177 
34989 
34155 
34258 
34422 
35660 
31923 
34384 
38167 
38198 
38948 
40790 
39359 
35341 
31737


Summary of computational transaction
Raw Input view raw input (R code)
Raw Outputview raw output of R engine
Computing time5 seconds
R ServerBig Analytics Cloud Computing Center

\begin{tabular}{lllllllll}
\hline
Summary of computational transaction \tabularnewline
Raw Input view raw input (R code)  \tabularnewline
Raw Outputview raw output of R engine  \tabularnewline
Computing time5 seconds \tabularnewline
R ServerBig Analytics Cloud Computing Center \tabularnewline
\hline
\end{tabular}
%Source: https://freestatistics.org/blog/index.php?pk=&T=0

[TABLE]
[ROW]
Summary of computational transaction[/C][/ROW] [ROW]Raw Input[/C] view raw input (R code) [/C][/ROW] [ROW]Raw Output[/C]view raw output of R engine [/C][/ROW] [ROW]Computing time[/C]5 seconds[/C][/ROW] [ROW]R Server[/C]Big Analytics Cloud Computing Center[/C][/ROW] [/TABLE] Source: https://freestatistics.org/blog/index.php?pk=&T=0

Globally Unique Identifier (entire table): ba.freestatistics.org/blog/index.php?pk=&T=0

As an alternative you can also use a QR Code:  

The GUIDs for individual cells are displayed in the table below:

Summary of computational transaction
Raw Input view raw input (R code)
Raw Outputview raw output of R engine
Computing time5 seconds
R ServerBig Analytics Cloud Computing Center


Structural Time Series Model -- Interpolation
tObservedLevelSlopeSeasonalStand. Residuals
15959859598000
25481755107.0932871073-244.836262299568-290.093287107284-1.18417809952611
35726857329.039267328-223.887057588715-61.03926732795781.07909102205718
45690557169.3108027933-223.643816119781-264.3108027933090.0280883567180451
55717257372.4563260016-221.839667313528-200.4563260016220.186830835089966
65253453000.6021517311-239.759259068552-466.602151731104-1.81668955599276
75047950758.4953035615-248.367402048066-279.495303561454-0.876531851223474
84926049528.4105079704-252.567935733659-268.410507970446-0.42974525270512
94937949595.6622940838-251.205371806093-216.6622940838450.139999397265293
105147551603.0906384493-241.623430015291-128.0906384493020.988696719807033
115064950954.4514313221-243.342845354035-305.451431322103-0.178166038971505
125300653105.4998647047-233.270424357009-99.49986470469681.04810604837196
135610553304.9006623603-251.1700652144482800.099337639710.225791346829397
145040750979.8864756335-297.654846620332-572.886475633508-0.784751998841506
154445545116.9708588424-337.29513789036-661.970858842425-2.42473811427123
164614546300.56691932-334.161859627089-155.566919319950.665260386457142
174394444273.0110008755-337.611695876583-329.011000875499-0.740560149881795
184085541512.4006347535-343.028190655897-657.400634753464-1.0596041213139
194416944132.9273856464-336.32790296644836.07261435360391.29599677194695
204155242130.561911587-340.079230517286-578.561911587025-0.728576729540817
214334743556.9599383442-336.114168743734-209.9599383441860.7724977259846
224433544439.5008849552-333.332435218274-104.5008849552380.532949756892014
234380044340.7460899495-332.754659449787-540.7460899495120.102610478128994
244484244969.5220491371-332.110227509831-127.5220491370720.420145637938981
254311340608.6368464866-262.0404997966072504.36315351342-1.90240553086834
264216041980.620035599-240.940494981939179.379964401040.663359127426134
273975840638.6508153354-248.316749844735-880.650815335425-0.47815719615851
283917739230.3414821345-250.653116611249-53.3414821344533-0.507336173587115
293498935360.2679207566-255.910928345706-371.267920756632-1.58251453640207
303415534894.7082179123-256.255156010888-739.708217912295-0.0916582049001803
313425834012.7868182463-257.331058181823245.213181753651-0.273538154055881
323442234889.3817873256-255.378996192622-467.3817873255850.495746872402352
333566035784.2398803613-253.388945971656-124.2398803613030.502883641021335
343192332377.3103211151-259.182378394523-454.310321115105-1.37889165563966
353438434601.432331014-254.5449373773-217.4323310140361.08601080875039
363816737608.9719783763-256.854247826003558.0280216237321.42544202963475
373819836252.3092854565-246.0709300148441945.69071454351-0.501276691683527
383894838427.1568180423-225.749105271607520.8431819576831.01263461265891
394079041252.989111366-206.877661439911-462.9891113659661.32259472193273
403935939326.5755690844-210.72878873674332.4244309156524-0.751949815047766
413534136008.908203233-214.688438728518-667.908203232987-1.35838453519421
423173732643.0057022245-218.95992311654-906.005702224524-1.37758022740904

\begin{tabular}{lllllllll}
\hline
Structural Time Series Model -- Interpolation \tabularnewline
t & Observed & Level & Slope & Seasonal & Stand. Residuals \tabularnewline
1 & 59598 & 59598 & 0 & 0 & 0 \tabularnewline
2 & 54817 & 55107.0932871073 & -244.836262299568 & -290.093287107284 & -1.18417809952611 \tabularnewline
3 & 57268 & 57329.039267328 & -223.887057588715 & -61.0392673279578 & 1.07909102205718 \tabularnewline
4 & 56905 & 57169.3108027933 & -223.643816119781 & -264.310802793309 & 0.0280883567180451 \tabularnewline
5 & 57172 & 57372.4563260016 & -221.839667313528 & -200.456326001622 & 0.186830835089966 \tabularnewline
6 & 52534 & 53000.6021517311 & -239.759259068552 & -466.602151731104 & -1.81668955599276 \tabularnewline
7 & 50479 & 50758.4953035615 & -248.367402048066 & -279.495303561454 & -0.876531851223474 \tabularnewline
8 & 49260 & 49528.4105079704 & -252.567935733659 & -268.410507970446 & -0.42974525270512 \tabularnewline
9 & 49379 & 49595.6622940838 & -251.205371806093 & -216.662294083845 & 0.139999397265293 \tabularnewline
10 & 51475 & 51603.0906384493 & -241.623430015291 & -128.090638449302 & 0.988696719807033 \tabularnewline
11 & 50649 & 50954.4514313221 & -243.342845354035 & -305.451431322103 & -0.178166038971505 \tabularnewline
12 & 53006 & 53105.4998647047 & -233.270424357009 & -99.4998647046968 & 1.04810604837196 \tabularnewline
13 & 56105 & 53304.9006623603 & -251.170065214448 & 2800.09933763971 & 0.225791346829397 \tabularnewline
14 & 50407 & 50979.8864756335 & -297.654846620332 & -572.886475633508 & -0.784751998841506 \tabularnewline
15 & 44455 & 45116.9708588424 & -337.29513789036 & -661.970858842425 & -2.42473811427123 \tabularnewline
16 & 46145 & 46300.56691932 & -334.161859627089 & -155.56691931995 & 0.665260386457142 \tabularnewline
17 & 43944 & 44273.0110008755 & -337.611695876583 & -329.011000875499 & -0.740560149881795 \tabularnewline
18 & 40855 & 41512.4006347535 & -343.028190655897 & -657.400634753464 & -1.0596041213139 \tabularnewline
19 & 44169 & 44132.9273856464 & -336.327902966448 & 36.0726143536039 & 1.29599677194695 \tabularnewline
20 & 41552 & 42130.561911587 & -340.079230517286 & -578.561911587025 & -0.728576729540817 \tabularnewline
21 & 43347 & 43556.9599383442 & -336.114168743734 & -209.959938344186 & 0.7724977259846 \tabularnewline
22 & 44335 & 44439.5008849552 & -333.332435218274 & -104.500884955238 & 0.532949756892014 \tabularnewline
23 & 43800 & 44340.7460899495 & -332.754659449787 & -540.746089949512 & 0.102610478128994 \tabularnewline
24 & 44842 & 44969.5220491371 & -332.110227509831 & -127.522049137072 & 0.420145637938981 \tabularnewline
25 & 43113 & 40608.6368464866 & -262.040499796607 & 2504.36315351342 & -1.90240553086834 \tabularnewline
26 & 42160 & 41980.620035599 & -240.940494981939 & 179.37996440104 & 0.663359127426134 \tabularnewline
27 & 39758 & 40638.6508153354 & -248.316749844735 & -880.650815335425 & -0.47815719615851 \tabularnewline
28 & 39177 & 39230.3414821345 & -250.653116611249 & -53.3414821344533 & -0.507336173587115 \tabularnewline
29 & 34989 & 35360.2679207566 & -255.910928345706 & -371.267920756632 & -1.58251453640207 \tabularnewline
30 & 34155 & 34894.7082179123 & -256.255156010888 & -739.708217912295 & -0.0916582049001803 \tabularnewline
31 & 34258 & 34012.7868182463 & -257.331058181823 & 245.213181753651 & -0.273538154055881 \tabularnewline
32 & 34422 & 34889.3817873256 & -255.378996192622 & -467.381787325585 & 0.495746872402352 \tabularnewline
33 & 35660 & 35784.2398803613 & -253.388945971656 & -124.239880361303 & 0.502883641021335 \tabularnewline
34 & 31923 & 32377.3103211151 & -259.182378394523 & -454.310321115105 & -1.37889165563966 \tabularnewline
35 & 34384 & 34601.432331014 & -254.5449373773 & -217.432331014036 & 1.08601080875039 \tabularnewline
36 & 38167 & 37608.9719783763 & -256.854247826003 & 558.028021623732 & 1.42544202963475 \tabularnewline
37 & 38198 & 36252.3092854565 & -246.070930014844 & 1945.69071454351 & -0.501276691683527 \tabularnewline
38 & 38948 & 38427.1568180423 & -225.749105271607 & 520.843181957683 & 1.01263461265891 \tabularnewline
39 & 40790 & 41252.989111366 & -206.877661439911 & -462.989111365966 & 1.32259472193273 \tabularnewline
40 & 39359 & 39326.5755690844 & -210.728788736743 & 32.4244309156524 & -0.751949815047766 \tabularnewline
41 & 35341 & 36008.908203233 & -214.688438728518 & -667.908203232987 & -1.35838453519421 \tabularnewline
42 & 31737 & 32643.0057022245 & -218.95992311654 & -906.005702224524 & -1.37758022740904 \tabularnewline
\hline
\end{tabular}
%Source: https://freestatistics.org/blog/index.php?pk=&T=1

[TABLE]
[ROW][C]Structural Time Series Model -- Interpolation[/C][/ROW]
[ROW][C]t[/C][C]Observed[/C][C]Level[/C][C]Slope[/C][C]Seasonal[/C][C]Stand. Residuals[/C][/ROW]
[ROW][C]1[/C][C]59598[/C][C]59598[/C][C]0[/C][C]0[/C][C]0[/C][/ROW]
[ROW][C]2[/C][C]54817[/C][C]55107.0932871073[/C][C]-244.836262299568[/C][C]-290.093287107284[/C][C]-1.18417809952611[/C][/ROW]
[ROW][C]3[/C][C]57268[/C][C]57329.039267328[/C][C]-223.887057588715[/C][C]-61.0392673279578[/C][C]1.07909102205718[/C][/ROW]
[ROW][C]4[/C][C]56905[/C][C]57169.3108027933[/C][C]-223.643816119781[/C][C]-264.310802793309[/C][C]0.0280883567180451[/C][/ROW]
[ROW][C]5[/C][C]57172[/C][C]57372.4563260016[/C][C]-221.839667313528[/C][C]-200.456326001622[/C][C]0.186830835089966[/C][/ROW]
[ROW][C]6[/C][C]52534[/C][C]53000.6021517311[/C][C]-239.759259068552[/C][C]-466.602151731104[/C][C]-1.81668955599276[/C][/ROW]
[ROW][C]7[/C][C]50479[/C][C]50758.4953035615[/C][C]-248.367402048066[/C][C]-279.495303561454[/C][C]-0.876531851223474[/C][/ROW]
[ROW][C]8[/C][C]49260[/C][C]49528.4105079704[/C][C]-252.567935733659[/C][C]-268.410507970446[/C][C]-0.42974525270512[/C][/ROW]
[ROW][C]9[/C][C]49379[/C][C]49595.6622940838[/C][C]-251.205371806093[/C][C]-216.662294083845[/C][C]0.139999397265293[/C][/ROW]
[ROW][C]10[/C][C]51475[/C][C]51603.0906384493[/C][C]-241.623430015291[/C][C]-128.090638449302[/C][C]0.988696719807033[/C][/ROW]
[ROW][C]11[/C][C]50649[/C][C]50954.4514313221[/C][C]-243.342845354035[/C][C]-305.451431322103[/C][C]-0.178166038971505[/C][/ROW]
[ROW][C]12[/C][C]53006[/C][C]53105.4998647047[/C][C]-233.270424357009[/C][C]-99.4998647046968[/C][C]1.04810604837196[/C][/ROW]
[ROW][C]13[/C][C]56105[/C][C]53304.9006623603[/C][C]-251.170065214448[/C][C]2800.09933763971[/C][C]0.225791346829397[/C][/ROW]
[ROW][C]14[/C][C]50407[/C][C]50979.8864756335[/C][C]-297.654846620332[/C][C]-572.886475633508[/C][C]-0.784751998841506[/C][/ROW]
[ROW][C]15[/C][C]44455[/C][C]45116.9708588424[/C][C]-337.29513789036[/C][C]-661.970858842425[/C][C]-2.42473811427123[/C][/ROW]
[ROW][C]16[/C][C]46145[/C][C]46300.56691932[/C][C]-334.161859627089[/C][C]-155.56691931995[/C][C]0.665260386457142[/C][/ROW]
[ROW][C]17[/C][C]43944[/C][C]44273.0110008755[/C][C]-337.611695876583[/C][C]-329.011000875499[/C][C]-0.740560149881795[/C][/ROW]
[ROW][C]18[/C][C]40855[/C][C]41512.4006347535[/C][C]-343.028190655897[/C][C]-657.400634753464[/C][C]-1.0596041213139[/C][/ROW]
[ROW][C]19[/C][C]44169[/C][C]44132.9273856464[/C][C]-336.327902966448[/C][C]36.0726143536039[/C][C]1.29599677194695[/C][/ROW]
[ROW][C]20[/C][C]41552[/C][C]42130.561911587[/C][C]-340.079230517286[/C][C]-578.561911587025[/C][C]-0.728576729540817[/C][/ROW]
[ROW][C]21[/C][C]43347[/C][C]43556.9599383442[/C][C]-336.114168743734[/C][C]-209.959938344186[/C][C]0.7724977259846[/C][/ROW]
[ROW][C]22[/C][C]44335[/C][C]44439.5008849552[/C][C]-333.332435218274[/C][C]-104.500884955238[/C][C]0.532949756892014[/C][/ROW]
[ROW][C]23[/C][C]43800[/C][C]44340.7460899495[/C][C]-332.754659449787[/C][C]-540.746089949512[/C][C]0.102610478128994[/C][/ROW]
[ROW][C]24[/C][C]44842[/C][C]44969.5220491371[/C][C]-332.110227509831[/C][C]-127.522049137072[/C][C]0.420145637938981[/C][/ROW]
[ROW][C]25[/C][C]43113[/C][C]40608.6368464866[/C][C]-262.040499796607[/C][C]2504.36315351342[/C][C]-1.90240553086834[/C][/ROW]
[ROW][C]26[/C][C]42160[/C][C]41980.620035599[/C][C]-240.940494981939[/C][C]179.37996440104[/C][C]0.663359127426134[/C][/ROW]
[ROW][C]27[/C][C]39758[/C][C]40638.6508153354[/C][C]-248.316749844735[/C][C]-880.650815335425[/C][C]-0.47815719615851[/C][/ROW]
[ROW][C]28[/C][C]39177[/C][C]39230.3414821345[/C][C]-250.653116611249[/C][C]-53.3414821344533[/C][C]-0.507336173587115[/C][/ROW]
[ROW][C]29[/C][C]34989[/C][C]35360.2679207566[/C][C]-255.910928345706[/C][C]-371.267920756632[/C][C]-1.58251453640207[/C][/ROW]
[ROW][C]30[/C][C]34155[/C][C]34894.7082179123[/C][C]-256.255156010888[/C][C]-739.708217912295[/C][C]-0.0916582049001803[/C][/ROW]
[ROW][C]31[/C][C]34258[/C][C]34012.7868182463[/C][C]-257.331058181823[/C][C]245.213181753651[/C][C]-0.273538154055881[/C][/ROW]
[ROW][C]32[/C][C]34422[/C][C]34889.3817873256[/C][C]-255.378996192622[/C][C]-467.381787325585[/C][C]0.495746872402352[/C][/ROW]
[ROW][C]33[/C][C]35660[/C][C]35784.2398803613[/C][C]-253.388945971656[/C][C]-124.239880361303[/C][C]0.502883641021335[/C][/ROW]
[ROW][C]34[/C][C]31923[/C][C]32377.3103211151[/C][C]-259.182378394523[/C][C]-454.310321115105[/C][C]-1.37889165563966[/C][/ROW]
[ROW][C]35[/C][C]34384[/C][C]34601.432331014[/C][C]-254.5449373773[/C][C]-217.432331014036[/C][C]1.08601080875039[/C][/ROW]
[ROW][C]36[/C][C]38167[/C][C]37608.9719783763[/C][C]-256.854247826003[/C][C]558.028021623732[/C][C]1.42544202963475[/C][/ROW]
[ROW][C]37[/C][C]38198[/C][C]36252.3092854565[/C][C]-246.070930014844[/C][C]1945.69071454351[/C][C]-0.501276691683527[/C][/ROW]
[ROW][C]38[/C][C]38948[/C][C]38427.1568180423[/C][C]-225.749105271607[/C][C]520.843181957683[/C][C]1.01263461265891[/C][/ROW]
[ROW][C]39[/C][C]40790[/C][C]41252.989111366[/C][C]-206.877661439911[/C][C]-462.989111365966[/C][C]1.32259472193273[/C][/ROW]
[ROW][C]40[/C][C]39359[/C][C]39326.5755690844[/C][C]-210.728788736743[/C][C]32.4244309156524[/C][C]-0.751949815047766[/C][/ROW]
[ROW][C]41[/C][C]35341[/C][C]36008.908203233[/C][C]-214.688438728518[/C][C]-667.908203232987[/C][C]-1.35838453519421[/C][/ROW]
[ROW][C]42[/C][C]31737[/C][C]32643.0057022245[/C][C]-218.95992311654[/C][C]-906.005702224524[/C][C]-1.37758022740904[/C][/ROW]
[/TABLE]
Source: https://freestatistics.org/blog/index.php?pk=&T=1

Globally Unique Identifier (entire table): ba.freestatistics.org/blog/index.php?pk=&T=1

As an alternative you can also use a QR Code:  

The GUIDs for individual cells are displayed in the table below:

Structural Time Series Model -- Interpolation
tObservedLevelSlopeSeasonalStand. Residuals
15959859598000
25481755107.0932871073-244.836262299568-290.093287107284-1.18417809952611
35726857329.039267328-223.887057588715-61.03926732795781.07909102205718
45690557169.3108027933-223.643816119781-264.3108027933090.0280883567180451
55717257372.4563260016-221.839667313528-200.4563260016220.186830835089966
65253453000.6021517311-239.759259068552-466.602151731104-1.81668955599276
75047950758.4953035615-248.367402048066-279.495303561454-0.876531851223474
84926049528.4105079704-252.567935733659-268.410507970446-0.42974525270512
94937949595.6622940838-251.205371806093-216.6622940838450.139999397265293
105147551603.0906384493-241.623430015291-128.0906384493020.988696719807033
115064950954.4514313221-243.342845354035-305.451431322103-0.178166038971505
125300653105.4998647047-233.270424357009-99.49986470469681.04810604837196
135610553304.9006623603-251.1700652144482800.099337639710.225791346829397
145040750979.8864756335-297.654846620332-572.886475633508-0.784751998841506
154445545116.9708588424-337.29513789036-661.970858842425-2.42473811427123
164614546300.56691932-334.161859627089-155.566919319950.665260386457142
174394444273.0110008755-337.611695876583-329.011000875499-0.740560149881795
184085541512.4006347535-343.028190655897-657.400634753464-1.0596041213139
194416944132.9273856464-336.32790296644836.07261435360391.29599677194695
204155242130.561911587-340.079230517286-578.561911587025-0.728576729540817
214334743556.9599383442-336.114168743734-209.9599383441860.7724977259846
224433544439.5008849552-333.332435218274-104.5008849552380.532949756892014
234380044340.7460899495-332.754659449787-540.7460899495120.102610478128994
244484244969.5220491371-332.110227509831-127.5220491370720.420145637938981
254311340608.6368464866-262.0404997966072504.36315351342-1.90240553086834
264216041980.620035599-240.940494981939179.379964401040.663359127426134
273975840638.6508153354-248.316749844735-880.650815335425-0.47815719615851
283917739230.3414821345-250.653116611249-53.3414821344533-0.507336173587115
293498935360.2679207566-255.910928345706-371.267920756632-1.58251453640207
303415534894.7082179123-256.255156010888-739.708217912295-0.0916582049001803
313425834012.7868182463-257.331058181823245.213181753651-0.273538154055881
323442234889.3817873256-255.378996192622-467.3817873255850.495746872402352
333566035784.2398803613-253.388945971656-124.2398803613030.502883641021335
343192332377.3103211151-259.182378394523-454.310321115105-1.37889165563966
353438434601.432331014-254.5449373773-217.4323310140361.08601080875039
363816737608.9719783763-256.854247826003558.0280216237321.42544202963475
373819836252.3092854565-246.0709300148441945.69071454351-0.501276691683527
383894838427.1568180423-225.749105271607520.8431819576831.01263461265891
394079041252.989111366-206.877661439911-462.9891113659661.32259472193273
403935939326.5755690844-210.72878873674332.4244309156524-0.751949815047766
413534136008.908203233-214.688438728518-667.908203232987-1.35838453519421
423173732643.0057022245-218.95992311654-906.005702224524-1.37758022740904


Structural Time Series Model -- Extrapolation
tObservedLevelSeasonal
132082.185515104234225.0596920788-2142.8741769746
230856.037698982433721.0905069849-2865.05280800248
332128.53363545633217.121321891-1088.58768643494
431457.621814079632713.152136797-1255.53032271739
532160.919390196632209.1829517031-48.2635615065196
634619.770563099231705.21376660922914.55679649001
734707.495982640431201.24458151533506.25140112517
832529.084065713530697.27539642141831.80866929218
931472.563916339830193.30621132741279.25770501234
1031229.365047563329689.33702623351540.02802132977
1128505.802680698829185.3678411396-679.565160440827
1225689.36977887328681.3986560457-2992.02887717271

\begin{tabular}{lllllllll}
\hline
Structural Time Series Model -- Extrapolation \tabularnewline
t & Observed & Level & Seasonal \tabularnewline
1 & 32082.1855151042 & 34225.0596920788 & -2142.8741769746 \tabularnewline
2 & 30856.0376989824 & 33721.0905069849 & -2865.05280800248 \tabularnewline
3 & 32128.533635456 & 33217.121321891 & -1088.58768643494 \tabularnewline
4 & 31457.6218140796 & 32713.152136797 & -1255.53032271739 \tabularnewline
5 & 32160.9193901966 & 32209.1829517031 & -48.2635615065196 \tabularnewline
6 & 34619.7705630992 & 31705.2137666092 & 2914.55679649001 \tabularnewline
7 & 34707.4959826404 & 31201.2445815153 & 3506.25140112517 \tabularnewline
8 & 32529.0840657135 & 30697.2753964214 & 1831.80866929218 \tabularnewline
9 & 31472.5639163398 & 30193.3062113274 & 1279.25770501234 \tabularnewline
10 & 31229.3650475633 & 29689.3370262335 & 1540.02802132977 \tabularnewline
11 & 28505.8026806988 & 29185.3678411396 & -679.565160440827 \tabularnewline
12 & 25689.369778873 & 28681.3986560457 & -2992.02887717271 \tabularnewline
\hline
\end{tabular}
%Source: https://freestatistics.org/blog/index.php?pk=&T=2

[TABLE]
[ROW][C]Structural Time Series Model -- Extrapolation[/C][/ROW]
[ROW][C]t[/C][C]Observed[/C][C]Level[/C][C]Seasonal[/C][/ROW]
[ROW][C]1[/C][C]32082.1855151042[/C][C]34225.0596920788[/C][C]-2142.8741769746[/C][/ROW]
[ROW][C]2[/C][C]30856.0376989824[/C][C]33721.0905069849[/C][C]-2865.05280800248[/C][/ROW]
[ROW][C]3[/C][C]32128.533635456[/C][C]33217.121321891[/C][C]-1088.58768643494[/C][/ROW]
[ROW][C]4[/C][C]31457.6218140796[/C][C]32713.152136797[/C][C]-1255.53032271739[/C][/ROW]
[ROW][C]5[/C][C]32160.9193901966[/C][C]32209.1829517031[/C][C]-48.2635615065196[/C][/ROW]
[ROW][C]6[/C][C]34619.7705630992[/C][C]31705.2137666092[/C][C]2914.55679649001[/C][/ROW]
[ROW][C]7[/C][C]34707.4959826404[/C][C]31201.2445815153[/C][C]3506.25140112517[/C][/ROW]
[ROW][C]8[/C][C]32529.0840657135[/C][C]30697.2753964214[/C][C]1831.80866929218[/C][/ROW]
[ROW][C]9[/C][C]31472.5639163398[/C][C]30193.3062113274[/C][C]1279.25770501234[/C][/ROW]
[ROW][C]10[/C][C]31229.3650475633[/C][C]29689.3370262335[/C][C]1540.02802132977[/C][/ROW]
[ROW][C]11[/C][C]28505.8026806988[/C][C]29185.3678411396[/C][C]-679.565160440827[/C][/ROW]
[ROW][C]12[/C][C]25689.369778873[/C][C]28681.3986560457[/C][C]-2992.02887717271[/C][/ROW]
[/TABLE]
Source: https://freestatistics.org/blog/index.php?pk=&T=2

Globally Unique Identifier (entire table): ba.freestatistics.org/blog/index.php?pk=&T=2

As an alternative you can also use a QR Code:  

The GUIDs for individual cells are displayed in the table below:

Structural Time Series Model -- Extrapolation
tObservedLevelSeasonal
132082.185515104234225.0596920788-2142.8741769746
230856.037698982433721.0905069849-2865.05280800248
332128.53363545633217.121321891-1088.58768643494
431457.621814079632713.152136797-1255.53032271739
532160.919390196632209.1829517031-48.2635615065196
634619.770563099231705.21376660922914.55679649001
734707.495982640431201.24458151533506.25140112517
832529.084065713530697.27539642141831.80866929218
931472.563916339830193.30621132741279.25770501234
1031229.365047563329689.33702623351540.02802132977
1128505.802680698829185.3678411396-679.565160440827
1225689.36977887328681.3986560457-2992.02887717271


Parameters (Session):
par1 = 12 ; par2 = 12 ; par3 = BFGS ;
Parameters (R input):
par1 = 12 ; par2 = 12 ; par3 = BFGS ;
R code (references can be found in the software module):
require('stsm')
require('stsm.class')
require('KFKSDS')
par1 <- as.numeric(par1)
par2 <- as.numeric(par2)
nx <- length(x)
x <- ts(x,frequency=par1)
m <- StructTS(x,type='BSM')
print(m$coef)
print(m$fitted)
print(m$resid)
mylevel <- as.numeric(m$fitted[,'level'])
myslope <- as.numeric(m$fitted[,'slope'])
myseas <- as.numeric(m$fitted[,'sea'])
myresid <- as.numeric(m$resid)
myfit <- mylevel+myseas
mm <- stsm.model(model = 'BSM', y = x, transPars = 'StructTS')
fit2 <- stsmFit(mm, stsm.method = 'maxlik.td.optim', method = par3, KF.args = list(P0cov = TRUE))
(fit2.comps <- tsSmooth(fit2, P0cov = FALSE)$states)
m2 <- set.pars(mm, pmax(fit2$par, .Machine$double.eps))
(ss <- char2numeric(m2))
(pred <- predict(ss, x, n.ahead = par2))
mylagmax <- nx/2
bitmap(file='test2.png')
op <- par(mfrow = c(2,2))
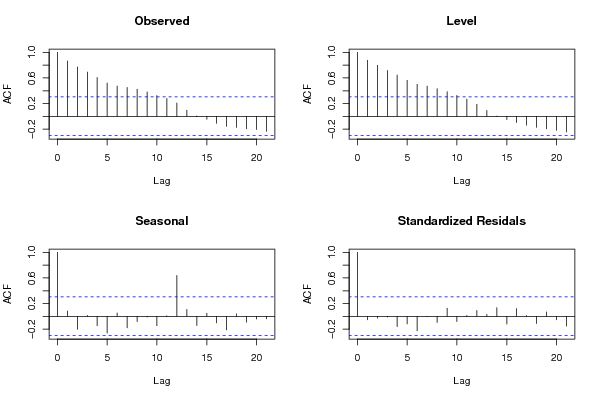
acf(as.numeric(x),lag.max = mylagmax,main='Observed')
acf(mylevel,na.action=na.pass,lag.max = mylagmax,main='Level')
acf(myseas,na.action=na.pass,lag.max = mylagmax,main='Seasonal')
acf(myresid,na.action=na.pass,lag.max = mylagmax,main='Standardized Residals')
par(op)
dev.off()
bitmap(file='test3.png')
op <- par(mfrow = c(2,2))
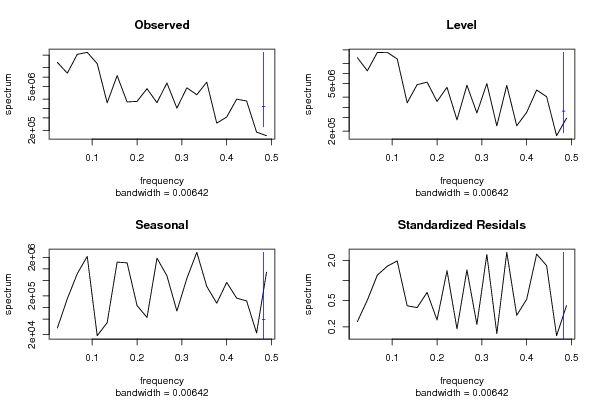
spectrum(as.numeric(x),main='Observed')
spectrum(mylevel,main='Level')
spectrum(myseas,main='Seasonal')
spectrum(myresid,main='Standardized Residals')
par(op)
dev.off()
bitmap(file='test4.png')
op <- par(mfrow = c(2,2))
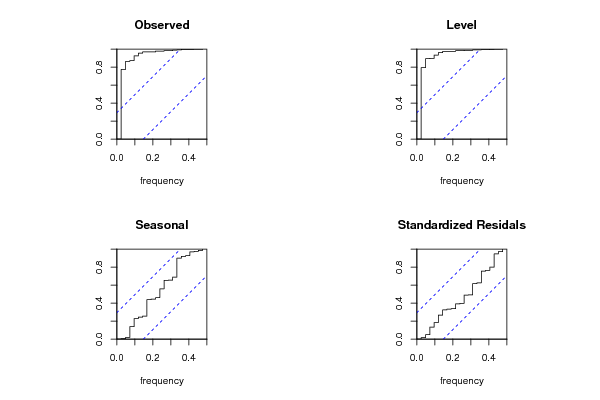
cpgram(as.numeric(x),main='Observed')
cpgram(mylevel,main='Level')
cpgram(myseas,main='Seasonal')
cpgram(myresid,main='Standardized Residals')
par(op)
dev.off()
bitmap(file='test1.png')
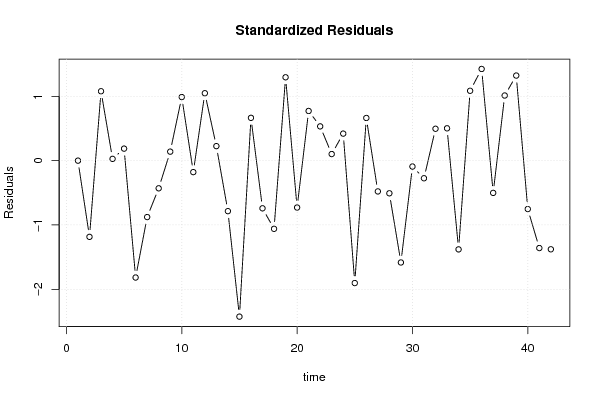
plot(as.numeric(m$resid),main='Standardized Residuals',ylab='Residuals',xlab='time',type='b')
grid()
dev.off()
bitmap(file='test5.png')
op <- par(mfrow = c(2,2))
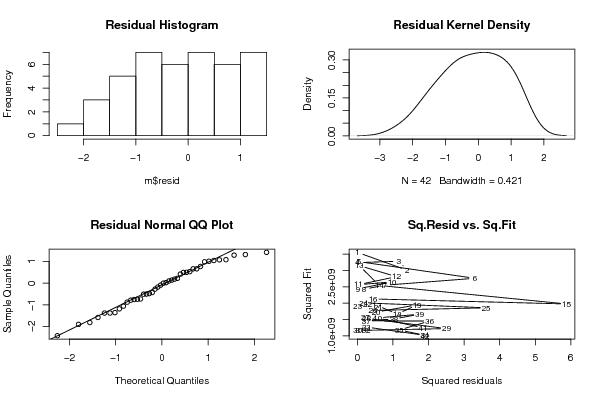
hist(m$resid,main='Residual Histogram')
plot(density(m$resid),main='Residual Kernel Density')
qqnorm(m$resid,main='Residual Normal QQ Plot')
qqline(m$resid)
plot(m$resid^2, myfit^2,main='Sq.Resid vs. Sq.Fit',xlab='Squared residuals',ylab='Squared Fit')
par(op)
dev.off()
bitmap(file='test6.png')
par(mfrow = c(3,1), mar = c(3,3,3,3))
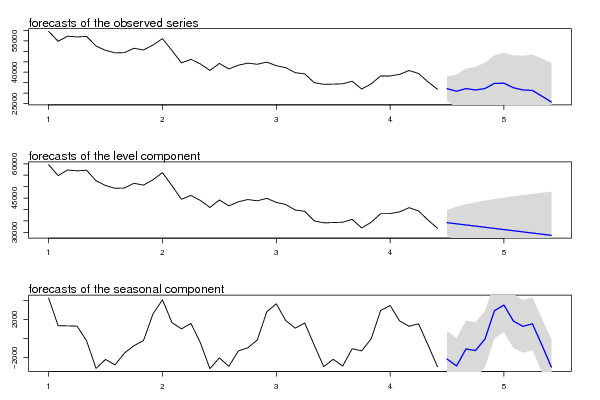
plot(cbind(x, pred$pred), type = 'n', plot.type = 'single', ylab = '')
lines(x)
polygon(c(time(pred$pred), rev(time(pred$pred))), c(pred$pred + 2 * pred$se, rev(pred$pred)), col = 'gray85', border = NA)
polygon(c(time(pred$pred), rev(time(pred$pred))), c(pred$pred - 2 * pred$se, rev(pred$pred)), col = ' gray85', border = NA)
lines(pred$pred, col = 'blue', lwd = 1.5)
mtext(text = 'forecasts of the observed series', side = 3, adj = 0)
plot(cbind(x, pred$a[,1]), type = 'n', plot.type = 'single', ylab = '')
lines(x)
polygon(c(time(pred$a[,1]), rev(time(pred$a[,1]))), c(pred$a[,1] + 2 * sqrt(pred$P[,1]), rev(pred$a[,1])), col = 'gray85', border = NA)
polygon(c(time(pred$a[,1]), rev(time(pred$a[,1]))), c(pred$a[,1] - 2 * sqrt(pred$P[,1]), rev(pred$a[,1])), col = ' gray85', border = NA)
lines(pred$a[,1], col = 'blue', lwd = 1.5)
mtext(text = 'forecasts of the level component', side = 3, adj = 0)
plot(cbind(fit2.comps[,3], pred$a[,3]), type = 'n', plot.type = 'single', ylab = '')
lines(fit2.comps[,3])
polygon(c(time(pred$a[,3]), rev(time(pred$a[,3]))), c(pred$a[,3] + 2 * sqrt(pred$P[,3]), rev(pred$a[,3])), col = 'gray85', border = NA)
polygon(c(time(pred$a[,3]), rev(time(pred$a[,3]))), c(pred$a[,3] - 2 * sqrt(pred$P[,3]), rev(pred$a[,3])), col = ' gray85', border = NA)
lines(pred$a[,3], col = 'blue', lwd = 1.5)
mtext(text = 'forecasts of the seasonal component', side = 3, adj = 0)
dev.off()
load(file='createtable')
a<-table.start()
a<-table.row.start(a)
a<-table.element(a,'Structural Time Series Model -- Interpolation',6,TRUE)
a<-table.row.end(a)
a<-table.row.start(a)
a<-table.element(a,'t',header=TRUE)
a<-table.element(a,'Observed',header=TRUE)
a<-table.element(a,'Level',header=TRUE)
a<-table.element(a,'Slope',header=TRUE)
a<-table.element(a,'Seasonal',header=TRUE)
a<-table.element(a,'Stand. Residuals',header=TRUE)
a<-table.row.end(a)
for (i in 1:nx) {
a<-table.row.start(a)
a<-table.element(a,i,header=TRUE)
a<-table.element(a,x[i])
a<-table.element(a,mylevel[i])
a<-table.element(a,myslope[i])
a<-table.element(a,myseas[i])
a<-table.element(a,myresid[i])
a<-table.row.end(a)
}
a<-table.end(a)
table.save(a,file='mytable.tab')
a<-table.start()
a<-table.row.start(a)
a<-table.element(a,'Structural Time Series Model -- Extrapolation',4,TRUE)
a<-table.row.end(a)
a<-table.row.start(a)
a<-table.element(a,'t',header=TRUE)
a<-table.element(a,'Observed',header=TRUE)
a<-table.element(a,'Level',header=TRUE)
a<-table.element(a,'Seasonal',header=TRUE)
a<-table.row.end(a)
for (i in 1:par2) {
a<-table.row.start(a)
a<-table.element(a,i,header=TRUE)
a<-table.element(a,pred$pred[i])
a<-table.element(a,pred$a[i,1])
a<-table.element(a,pred$a[i,3])
a<-table.row.end(a)
}
a<-table.end(a)
table.save(a,file='mytable1.tab')