Free Statistics

of Irreproducible Research!

Author's title

Author*Unverified author*
R Software Modulerwasp_correlation.wasp
Title produced by softwarePearson Correlation
Date of computationWed, 23 Jan 2019 23:24:43 +0100
Cite this page as followsStatistical Computations at FreeStatistics.org, Office for Research Development and Education, URL https://freestatistics.org/blog/index.php?v=date/2019/Jan/23/t1548282468qaf0bmctiyhdqkh.htm/, Retrieved Sun, 05 May 2024 02:39:38 +0000
Statistical Computations at FreeStatistics.org, Office for Research Development and Education, URL https://freestatistics.org/blog/index.php?pk=316965, Retrieved Sun, 05 May 2024 02:39:38 +0000
QR Codes:

Original text written by user:
IsPrivate?No (this computation is public)
User-defined keywords
Estimated Impact135
Family? (F = Feedback message, R = changed R code, M = changed R Module, P = changed Parameters, D = changed Data)
-       [Pearson Correlation] [likes words] [2019-01-23 22:24:43] [d41d8cd98f00b204e9800998ecf8427e] [Current]
Feedback Forum

Post a new message
Dataseries X:
664
2156
1252
1292
727
604
7134
1177
929
1158
189
1170
2268
918
1275
835
2017
506
514
814
424
1325
400
1775
413
613
1330
3581
2759
697
872
801
1779
1235
1829
3332
2194
2144
2426
1718
2210
1096
241
2759
1975
2712
1744
2486
1533
2270
868
1958
1380
2460
2490
1694
2162
802
1123
2376
1818
1318
2997
1014
3097
475
494
652
2024
1999
979
2612
2351
3048
4410
4118
1468
3094
2768
2852
277
406
261
258
183
400
160
1074
880
1453
441
270
121
167
124
597
250
191
134
344
206
212
902
595
260
144
1395
235
322
394
137
182
302
366
163
855
149
702
172
419
76
309
286
2133
638
1185
487
869
108
531
210
1134
1211
4010
313
471
1129
586
285
2614
478
258
1599
445
421
201
341
177
797
737
796
196
60
1087
604
293
755
733
331
330
223
309
153
794
1593
225
166
562
654
493
635
432
524
1301
1268
853
1433
4134
669
785
1231
719
1377
749
652
397
331
305
563
1934
1148
727
1141
344
366
772
650
621
780
1382
293
293
334
478
299
187
327
225
238
365
662
208
107
139
144
235
256
796
253
215
154
157
451
1170
93
351
177
188
253
538
184
42
436
221
222
465
739
762
1332
102
693
315
302
715
420
376
2598
113
716
105
54
145
903
129
434
1288
51
88
816
107
1205
117
2206
566
480
4340
224
72
92
219
203
256
130
108
145
875
77
106
346
1254
537
229
267
323
168
238
495
363
755
1230
1396
632
464
244
141
1854
667
621
2301
2242
535
244
260
2762
2456
841
709
1063
736
2768
1091
279
1068
445
365
496
492
1595
1894
566
234
245
132
465
87
155
411
119
471
344
706
463
156
460
218
72
352
487
89
730
166
369
279
1100
338
430
473
362
177
813
513
837
293
211
369
164
602
850
984
1111
Dataseries Y:
235
160
70
172
179
184
27
141
101
106
113
149
141
176
104
109
345
96
154
233
97
302
134
189
189
107
390
166
124
182
299
147
210
445
200
79
89
136
268
222
290
306
177
493
342
721
88
301
759
395
229
943
481
470
597
597
428
508
36
378
1398
311
364
360
510
157
229
652
1159
665
346
516
399
613
916
424
739
799
681
617
62
47
46
50
60
62
51
64
46
12
47
98
202
81
63
59
72
98
72
105
73
40
76
74
85
78
61
88
48
63
49
105
84
72
55
82
77
39
75
45
73
40
38
186
87
121
54
21
82
3
82
88
27
6
30
25
203
26
13
14
56
35
49
53
73
14
18
37
56
565
112
35
35
37
29
10
48
14
23
101
73
142
219
131
123
234
202
106
286
132
0
182
151
141
150
95
237
33
166
132
83
90
228
141
155
176
112
101
2
186
137
266
337
700
290
477
19
55
135
129
748
300
62
526
492
56
165
86
307
731
719
186
77
382
89
496
152
454
747
98
9
779
139
858
181
794
26
65
809
679
91
145
308
453
172
283
376
883
92
547
56
122
118
142
23
24
143
46
215
102
169
150
50
9
166
100
86
174
366
134
79
97
138
316
26
323
18
85
20
211
12
114
31
34
32
156
15
109
189
170
476
47
71
76
1627
2007
35
90
244
174
309
74
1241
67
1094
620
62
118
24
201
201
132
51
250
391
19
356
365
147
665
405
71
208
103
54
77
175
211
137
105
43
30
56
199
169
261
248
94
229
111
86
176
177
52
126
147
133
114
134
25
119
83
329
32
56
111
51
237
45
46
71
66
135
73
330
223
202
159
120
138


Summary of computational transaction
Raw Input view raw input (R code)
Raw Outputview raw output of R engine
Computing time5 seconds
R ServerBig Analytics Cloud Computing Center

\begin{tabular}{lllllllll}
\hline
Summary of computational transaction \tabularnewline
Raw Input view raw input (R code)  \tabularnewline
Raw Outputview raw output of R engine  \tabularnewline
Computing time5 seconds \tabularnewline
R ServerBig Analytics Cloud Computing Center \tabularnewline
\hline
\end{tabular}
%Source: https://freestatistics.org/blog/index.php?pk=316965&T=0

[TABLE]
[ROW]
Summary of computational transaction[/C][/ROW] [ROW]Raw Input[/C] view raw input (R code) [/C][/ROW] [ROW]Raw Output[/C]view raw output of R engine [/C][/ROW] [ROW]Computing time[/C]5 seconds[/C][/ROW] [ROW]R Server[/C]Big Analytics Cloud Computing Center[/C][/ROW] [/TABLE] Source: https://freestatistics.org/blog/index.php?pk=316965&T=0

Globally Unique Identifier (entire table): ba.freestatistics.org/blog/index.php?pk=316965&T=0

As an alternative you can also use a QR Code:  

The GUIDs for individual cells are displayed in the table below:

Summary of computational transaction
Raw Input view raw input (R code)
Raw Outputview raw output of R engine
Computing time5 seconds
R ServerBig Analytics Cloud Computing Center


Pearson Product Moment Correlation - Ungrouped Data
StatisticVariable XVariable Y
Mean855.677777777778212.919444444444
Biased Variance811993.00728395163690.6351774691
Biased Standard Deviation901.10654602214252.370036211649
Covariance52644.8541937481
Correlation0.2308521588992
Determination0.0532927192684215
T-Test4.48918595125559
p-value (2 sided)9.65369058892848e-06
p-value (1 sided)4.82684529446424e-06
95% CI of Correlation[0.130606784486267, 0.326425054862664]
Degrees of Freedom358
Number of Observations360

\begin{tabular}{lllllllll}
\hline
Pearson Product Moment Correlation - Ungrouped Data \tabularnewline
Statistic & Variable X & Variable Y \tabularnewline
Mean & 855.677777777778 & 212.919444444444 \tabularnewline
Biased Variance & 811993.007283951 & 63690.6351774691 \tabularnewline
Biased Standard Deviation & 901.10654602214 & 252.370036211649 \tabularnewline
Covariance & 52644.8541937481 \tabularnewline
Correlation & 0.2308521588992 \tabularnewline
Determination & 0.0532927192684215 \tabularnewline
T-Test & 4.48918595125559 \tabularnewline
p-value (2 sided) & 9.65369058892848e-06 \tabularnewline
p-value (1 sided) & 4.82684529446424e-06 \tabularnewline
95% CI of Correlation & [0.130606784486267, 0.326425054862664] \tabularnewline
Degrees of Freedom & 358 \tabularnewline
Number of Observations & 360 \tabularnewline
\hline
\end{tabular}
%Source: https://freestatistics.org/blog/index.php?pk=316965&T=1

[TABLE]
[ROW][C]Pearson Product Moment Correlation - Ungrouped Data[/C][/ROW]
[ROW][C]Statistic[/C][C]Variable X[/C][C]Variable Y[/C][/ROW]
[ROW][C]Mean[/C][C]855.677777777778[/C][C]212.919444444444[/C][/ROW]
[ROW][C]Biased Variance[/C][C]811993.007283951[/C][C]63690.6351774691[/C][/ROW]
[ROW][C]Biased Standard Deviation[/C][C]901.10654602214[/C][C]252.370036211649[/C][/ROW]
[ROW][C]Covariance[/C][C]52644.8541937481[/C][/ROW]
[ROW][C]Correlation[/C][C]0.2308521588992[/C][/ROW]
[ROW][C]Determination[/C][C]0.0532927192684215[/C][/ROW]
[ROW][C]T-Test[/C][C]4.48918595125559[/C][/ROW]
[ROW][C]p-value (2 sided)[/C][C]9.65369058892848e-06[/C][/ROW]
[ROW][C]p-value (1 sided)[/C][C]4.82684529446424e-06[/C][/ROW]
[ROW][C]95% CI of Correlation[/C][C][0.130606784486267, 0.326425054862664][/C][/ROW]
[ROW][C]Degrees of Freedom[/C][C]358[/C][/ROW]
[ROW][C]Number of Observations[/C][C]360[/C][/ROW]
[/TABLE]
Source: https://freestatistics.org/blog/index.php?pk=316965&T=1

Globally Unique Identifier (entire table): ba.freestatistics.org/blog/index.php?pk=316965&T=1

As an alternative you can also use a QR Code:  

The GUIDs for individual cells are displayed in the table below:

Pearson Product Moment Correlation - Ungrouped Data
StatisticVariable XVariable Y
Mean855.677777777778212.919444444444
Biased Variance811993.00728395163690.6351774691
Biased Standard Deviation901.10654602214252.370036211649
Covariance52644.8541937481
Correlation0.2308521588992
Determination0.0532927192684215
T-Test4.48918595125559
p-value (2 sided)9.65369058892848e-06
p-value (1 sided)4.82684529446424e-06
95% CI of Correlation[0.130606784486267, 0.326425054862664]
Degrees of Freedom358
Number of Observations360


Normality Tests
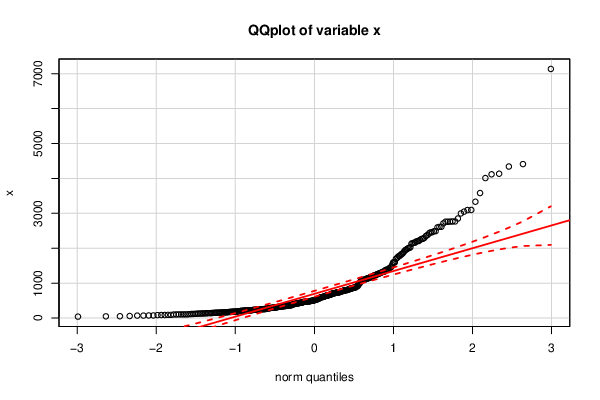
> jarque.x
	Jarque-Bera Normality Test
data:  x
JB = 1299.8, p-value < 2.2e-16
alternative hypothesis: greater
> jarque.y
	Jarque-Bera Normality Test
data:  y
JB = 2532.2, p-value < 2.2e-16
alternative hypothesis: greater
> ad.x
	Anderson-Darling normality test
data:  x
A = 25.149, p-value < 2.2e-16
> ad.y
	Anderson-Darling normality test
data:  y
A = 31.736, p-value < 2.2e-16

\begin{tabular}{lllllllll}
\hline
Normality Tests \tabularnewline
> jarque.x
	Jarque-Bera Normality Test
data:  x
JB = 1299.8, p-value < 2.2e-16
alternative hypothesis: greater
\tabularnewline
> jarque.y
	Jarque-Bera Normality Test
data:  y
JB = 2532.2, p-value < 2.2e-16
alternative hypothesis: greater
\tabularnewline
> ad.x
	Anderson-Darling normality test
data:  x
A = 25.149, p-value < 2.2e-16
\tabularnewline
> ad.y
	Anderson-Darling normality test
data:  y
A = 31.736, p-value < 2.2e-16
\tabularnewline \hline \end{tabular} %Source: https://freestatistics.org/blog/index.php?pk=316965&T=2

[TABLE]
[ROW][C]Normality Tests[/C][/ROW]
[ROW][C]
> jarque.x
	Jarque-Bera Normality Test
data:  x
JB = 1299.8, p-value < 2.2e-16
alternative hypothesis: greater
[/C][/ROW] [ROW][C]
> jarque.y
	Jarque-Bera Normality Test
data:  y
JB = 2532.2, p-value < 2.2e-16
alternative hypothesis: greater
[/C][/ROW] [ROW][C]
> ad.x
	Anderson-Darling normality test
data:  x
A = 25.149, p-value < 2.2e-16
[/C][/ROW] [ROW][C]
> ad.y
	Anderson-Darling normality test
data:  y
A = 31.736, p-value < 2.2e-16
[/C][/ROW] [/TABLE] Source: https://freestatistics.org/blog/index.php?pk=316965&T=2

Globally Unique Identifier (entire table): ba.freestatistics.org/blog/index.php?pk=316965&T=2

As an alternative you can also use a QR Code:  

The GUIDs for individual cells are displayed in the table below:

Normality Tests
> jarque.x
	Jarque-Bera Normality Test
data:  x
JB = 1299.8, p-value < 2.2e-16
alternative hypothesis: greater
> jarque.y
	Jarque-Bera Normality Test
data:  y
JB = 2532.2, p-value < 2.2e-16
alternative hypothesis: greater
> ad.x
	Anderson-Darling normality test
data:  x
A = 25.149, p-value < 2.2e-16
> ad.y
	Anderson-Darling normality test
data:  y
A = 31.736, p-value < 2.2e-16


Parameters (Session):
Parameters (R input):
R code (references can be found in the software module):
library(psychometric)
x <- x[!is.na(y)]
y <- y[!is.na(y)]
y <- y[!is.na(x)]
x <- x[!is.na(x)]
bitmap(file='test1.png')
histx <- hist(x, plot=FALSE)
histy <- hist(y, plot=FALSE)
maxcounts <- max(c(histx$counts, histx$counts))
xrange <- c(min(x),max(x))
yrange <- c(min(y),max(y))
nf <- layout(matrix(c(2,0,1,3),2,2,byrow=TRUE), c(3,1), c(1,3), TRUE)
par(mar=c(4,4,1,1))
plot(x, y, xlim=xrange, ylim=yrange, xlab=xlab, ylab=ylab, sub=main)
par(mar=c(0,4,1,1))
barplot(histx$counts, axes=FALSE, ylim=c(0, maxcounts), space=0)
par(mar=c(4,0,1,1))
barplot(histy$counts, axes=FALSE, xlim=c(0, maxcounts), space=0, horiz=TRUE)
dev.off()
lx = length(x)
makebiased = (lx-1)/lx
varx = var(x)*makebiased
vary = var(y)*makebiased
corxy <- cor.test(x,y,method='pearson', na.rm = T)
cxy <- as.matrix(corxy$estimate)[1,1]
load(file='createtable')
a<-table.start()
a<-table.row.start(a)
a<-table.element(a,'Pearson Product Moment Correlation - Ungrouped Data',3,TRUE)
a<-table.row.end(a)
a<-table.row.start(a)
a<-table.element(a,'Statistic',1,TRUE)
a<-table.element(a,'Variable X',1,TRUE)
a<-table.element(a,'Variable Y',1,TRUE)
a<-table.row.end(a)
a<-table.row.start(a)
a<-table.element(a,'Mean',header=TRUE)
a<-table.element(a,mean(x))
a<-table.element(a,mean(y))
a<-table.row.end(a)
a<-table.row.start(a)
a<-table.element(a,'Biased Variance',header=TRUE)
a<-table.element(a,varx)
a<-table.element(a,vary)
a<-table.row.end(a)
a<-table.row.start(a)
a<-table.element(a,'Biased Standard Deviation',header=TRUE)
a<-table.element(a,sqrt(varx))
a<-table.element(a,sqrt(vary))
a<-table.row.end(a)
a<-table.row.start(a)
a<-table.element(a,'Covariance',header=TRUE)
a<-table.element(a,cov(x,y),2)
a<-table.row.end(a)
a<-table.row.start(a)
a<-table.element(a,'Correlation',header=TRUE)
a<-table.element(a,cxy,2)
a<-table.row.end(a)
a<-table.row.start(a)
a<-table.element(a,'Determination',header=TRUE)
a<-table.element(a,cxy*cxy,2)
a<-table.row.end(a)
a<-table.row.start(a)
a<-table.element(a,'T-Test',header=TRUE)
a<-table.element(a,as.matrix(corxy$statistic)[1,1],2)
a<-table.row.end(a)
a<-table.row.start(a)
a<-table.element(a,'p-value (2 sided)',header=TRUE)
a<-table.element(a,(p2 <- as.matrix(corxy$p.value)[1,1]),2)
a<-table.row.end(a)
a<-table.row.start(a)
a<-table.element(a,'p-value (1 sided)',header=TRUE)
a<-table.element(a,p2/2,2)
a<-table.row.end(a)
a<-table.row.start(a)
a<-table.element(a,'95% CI of Correlation',header=TRUE)
a<-table.element(a,paste('[',CIr(r=cxy, n = lx, level = .95)[1],', ', CIr(r=cxy, n = lx, level = .95)[2],']',sep=''),2)
a<-table.row.end(a)
a<-table.row.start(a)
a<-table.element(a,'Degrees of Freedom',header=TRUE)
a<-table.element(a,lx-2,2)
a<-table.row.end(a)
a<-table.row.start(a)
a<-table.element(a,'Number of Observations',header=TRUE)
a<-table.element(a,lx,2)
a<-table.row.end(a)
a<-table.end(a)
table.save(a,file='mytable.tab')
library(moments)
library(nortest)
jarque.x <- jarque.test(x)
jarque.y <- jarque.test(y)
if(lx>7) {
ad.x <- ad.test(x)
ad.y <- ad.test(y)
}
a<-table.start()
a<-table.row.start(a)
a<-table.element(a,'Normality Tests',1,TRUE)
a<-table.row.end(a)
a<-table.row.start(a)
a<-table.element(a,paste('
',RC.texteval('jarque.x'),'
',sep=''))
a<-table.row.end(a)
a<-table.row.start(a)
a<-table.element(a,paste('
',RC.texteval('jarque.y'),'
',sep=''))
a<-table.row.end(a)
if(lx>7) {
a<-table.row.start(a)
a<-table.element(a,paste('
',RC.texteval('ad.x'),'
',sep=''))
a<-table.row.end(a)
a<-table.row.start(a)
a<-table.element(a,paste('
',RC.texteval('ad.y'),'
',sep=''))
a<-table.row.end(a)
}
a<-table.end(a)
table.save(a,file='mytable1.tab')
library(car)
bitmap(file='test2.png')
qqPlot(x,main='QQplot of variable x')
dev.off()
bitmap(file='test3.png')
qqPlot(y,main='QQplot of variable y')
dev.off()