Free Statistics

of Irreproducible Research!

Author's title

Author*The author of this computation has been verified*
R Software Modulerwasp_concentration.wasp
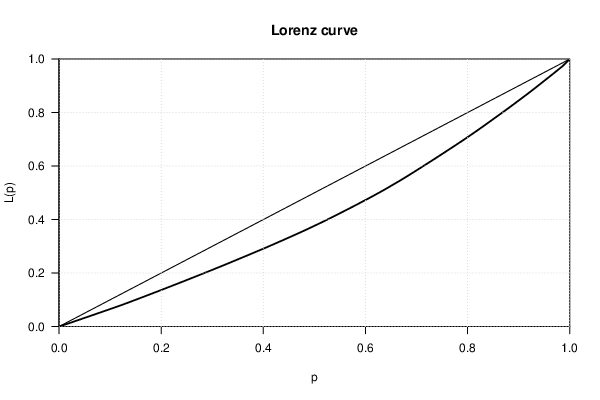
Title produced by softwareConcentration and Inequality
Date of computationThu, 31 Jan 2019 11:37:50 +0100
Cite this page as followsStatistical Computations at FreeStatistics.org, Office for Research Development and Education, URL https://freestatistics.org/blog/index.php?v=date/2019/Jan/31/t1548931075letpmcwpi30x7rm.htm/, Retrieved Sun, 05 May 2024 14:07:39 +0000
Statistical Computations at FreeStatistics.org, Office for Research Development and Education, URL https://freestatistics.org/blog/index.php?pk=317148, Retrieved Sun, 05 May 2024 14:07:39 +0000
QR Codes:

Original text written by user:
IsPrivate?No (this computation is public)
User-defined keywords
Estimated Impact35
Family? (F = Feedback message, R = changed R code, M = changed R Module, P = changed Parameters, D = changed Data)
-       [Concentration and Inequality] [] [2019-01-31 10:37:50] [a767e5021e83633c1612406774f7fa77] [Current]
Feedback Forum

Post a new message
Dataseries X:
3035
2552
2704
2554
2014
1655
1721
1524
1596
2074
2199
2512
2933
2889
2938
2497
1870
1726
1607
1545
1396
1787
2076
2837
2787
3891
3179
2011
1636
1580
1489
1300
1356
1653
2013
2823
3102
2294
2385
2444
1748
1554
1498
1361
1346
1564
1640
2293
2815
3137
2679
1969
1870
1633
1529
1366
1357
1570
1535
2491
3084
2605
2573
2143
1693
1504
1461
1354
1333
1492
1781
1915


Summary of computational transaction
Raw Input view raw input (R code)
Raw Outputview raw output of R engine
Computing time1 seconds
R ServerBig Analytics Cloud Computing Center

\begin{tabular}{lllllllll}
\hline
Summary of computational transaction \tabularnewline
Raw Input view raw input (R code)  \tabularnewline
Raw Outputview raw output of R engine  \tabularnewline
Computing time1 seconds \tabularnewline
R ServerBig Analytics Cloud Computing Center \tabularnewline
\hline
\end{tabular}
%Source: https://freestatistics.org/blog/index.php?pk=317148&T=0

[TABLE]
[ROW]
Summary of computational transaction[/C][/ROW] [ROW]Raw Input[/C] view raw input (R code) [/C][/ROW] [ROW]Raw Output[/C]view raw output of R engine [/C][/ROW] [ROW]Computing time[/C]1 seconds[/C][/ROW] [ROW]R Server[/C]Big Analytics Cloud Computing Center[/C][/ROW] [/TABLE] Source: https://freestatistics.org/blog/index.php?pk=317148&T=0

Globally Unique Identifier (entire table): ba.freestatistics.org/blog/index.php?pk=317148&T=0

As an alternative you can also use a QR Code:  

The GUIDs for individual cells are displayed in the table below:

Summary of computational transaction
Raw Input view raw input (R code)
Raw Outputview raw output of R engine
Computing time1 seconds
R ServerBig Analytics Cloud Computing Center


Concentration - Ungrouped Data
MeasureValue
Number of Categories72
Maximum Entropy4.27666611901606
Entropy4.23503371602809
Normalised Entropy0.990265220190362
Max. Entropy - Entropy0.0416324029879611
Theil Entropy Index0.0416324029879609
Exponential Index0.0144793220043023
Herfindahl0.0150931566055205
Normalised Herfindahl0.00122122923376729
Rosenbluth0.0166061101809921
Gini0.163627801001431
Concentration0.165932417916944
Ricci-Schutz (Pietra)0.12713824564247
Atkinson0.0204871818023319
KolmInf
Coefficient of Variation0.294460991639771
Squared Coefficient of Variation0.0867072755974774

\begin{tabular}{lllllllll}
\hline
Concentration - Ungrouped Data \tabularnewline
Measure & Value \tabularnewline
Number of Categories & 72 \tabularnewline
Maximum Entropy & 4.27666611901606 \tabularnewline
Entropy & 4.23503371602809 \tabularnewline
Normalised Entropy & 0.990265220190362 \tabularnewline
Max. Entropy - Entropy & 0.0416324029879611 \tabularnewline
Theil Entropy Index & 0.0416324029879609 \tabularnewline
Exponential Index & 0.0144793220043023 \tabularnewline
Herfindahl & 0.0150931566055205 \tabularnewline
Normalised Herfindahl & 0.00122122923376729 \tabularnewline
Rosenbluth & 0.0166061101809921 \tabularnewline
Gini & 0.163627801001431 \tabularnewline
Concentration & 0.165932417916944 \tabularnewline
Ricci-Schutz (Pietra) & 0.12713824564247 \tabularnewline
Atkinson & 0.0204871818023319 \tabularnewline
Kolm & Inf \tabularnewline
Coefficient of Variation & 0.294460991639771 \tabularnewline
Squared Coefficient of Variation & 0.0867072755974774 \tabularnewline
\hline
\end{tabular}
%Source: https://freestatistics.org/blog/index.php?pk=317148&T=1

[TABLE]
[ROW][C]Concentration - Ungrouped Data[/C][/ROW]
[ROW][C]Measure[/C][C]Value[/C][/ROW]
[ROW][C]Number of Categories[/C][C]72[/C][/ROW]
[ROW][C]Maximum Entropy[/C][C]4.27666611901606[/C][/ROW]
[ROW][C]Entropy[/C][C]4.23503371602809[/C][/ROW]
[ROW][C]Normalised Entropy[/C][C]0.990265220190362[/C][/ROW]
[ROW][C]Max. Entropy - Entropy[/C][C]0.0416324029879611[/C][/ROW]
[ROW][C]Theil Entropy Index[/C][C]0.0416324029879609[/C][/ROW]
[ROW][C]Exponential Index[/C][C]0.0144793220043023[/C][/ROW]
[ROW][C]Herfindahl[/C][C]0.0150931566055205[/C][/ROW]
[ROW][C]Normalised Herfindahl[/C][C]0.00122122923376729[/C][/ROW]
[ROW][C]Rosenbluth[/C][C]0.0166061101809921[/C][/ROW]
[ROW][C]Gini[/C][C]0.163627801001431[/C][/ROW]
[ROW][C]Concentration[/C][C]0.165932417916944[/C][/ROW]
[ROW][C]Ricci-Schutz (Pietra)[/C][C]0.12713824564247[/C][/ROW]
[ROW][C]Atkinson[/C][C]0.0204871818023319[/C][/ROW]
[ROW][C]Kolm[/C][C]Inf[/C][/ROW]
[ROW][C]Coefficient of Variation[/C][C]0.294460991639771[/C][/ROW]
[ROW][C]Squared Coefficient of Variation[/C][C]0.0867072755974774[/C][/ROW]
[/TABLE]
Source: https://freestatistics.org/blog/index.php?pk=317148&T=1

Globally Unique Identifier (entire table): ba.freestatistics.org/blog/index.php?pk=317148&T=1

As an alternative you can also use a QR Code:  

The GUIDs for individual cells are displayed in the table below:

Concentration - Ungrouped Data
MeasureValue
Number of Categories72
Maximum Entropy4.27666611901606
Entropy4.23503371602809
Normalised Entropy0.990265220190362
Max. Entropy - Entropy0.0416324029879611
Theil Entropy Index0.0416324029879609
Exponential Index0.0144793220043023
Herfindahl0.0150931566055205
Normalised Herfindahl0.00122122923376729
Rosenbluth0.0166061101809921
Gini0.163627801001431
Concentration0.165932417916944
Ricci-Schutz (Pietra)0.12713824564247
Atkinson0.0204871818023319
KolmInf
Coefficient of Variation0.294460991639771
Squared Coefficient of Variation0.0867072755974774


Parameters (Session):
Parameters (R input):
R code (references can be found in the software module):
library(ineq)
my_minimum <- min(x)
if(my_minimum < 0) {
stop('Negative values are not allowed.')
}
myLength <- length(x)
myMaximumEntropy <- log(myLength)
mySum <- sum(x)
myProportion <- x/mySum
myEntropy <- -sum(myProportion * log(myProportion))
myNormalizedEntropy <- myEntropy / myMaximumEntropy
myDifference <- myMaximumEntropy - myEntropy
myTheilEntropyIndex <- entropy(x,parameter=1,na.rm=T)
myExponentialIndex <- exp(-myEntropy)
myHerfindahlMeasure <- sum(myProportion^2)
myHerfindahl <- conc(x,type='Herfindahl',na.rm=T)
myRosenbluth <- conc(x,type='Rosenbluth',na.rm=T)
myNormalizedHerfindahlMeasure <- (myHerfindahlMeasure - 1/myLength) / (1 - 1/myLength)
myGini <- Gini(x,na.rm=T)
myConcentrationCoefficient <- myLength/(myLength -1)*myGini
myRS <- RS(x,na.rm=T)
myAtkinson <- Atkinson(x,na.rm=T)
myKolm <- Kolm(x,na.rm=T)
myCoefficientOfVariation <- var.coeff(x,square=F,na.rm=T)
mySquaredCoefficientOfVariation <- var.coeff(x,square=T,na.rm=T)
bitmap(file='plot1.png')
plot(Lc(x))
grid()
dev.off()
bitmap(file='plot2.png')
plot(Lc(x),general=T)
grid()
dev.off()
load(file='createtable')
a<-table.start()
a<-table.row.start(a)
a<-table.element(a,'Concentration - Ungrouped Data',2,TRUE)
a<-table.row.end(a)
a<-table.row.start(a)
a<-table.element(a,'Measure',header=TRUE)
a<-table.element(a,'Value',header=TRUE)
a<-table.row.end(a)
a<-table.row.start(a)
a<-table.element(a,'Number of Categories',header=F)
a<-table.element(a,myLength,header=F)
a<-table.row.end(a)
a<-table.row.start(a)
a<-table.element(a,'Maximum Entropy',header=F)
a<-table.element(a,myMaximumEntropy,header=F)
a<-table.row.end(a)
a<-table.row.start(a)
a<-table.element(a,'Entropy',header=F)
a<-table.element(a,myEntropy,header=F)
a<-table.row.end(a)
a<-table.row.start(a)
a<-table.element(a,'Normalised Entropy',header=F)
a<-table.element(a,myNormalizedEntropy,header=F)
a<-table.row.end(a)
a<-table.row.start(a)
a<-table.element(a,'Max. Entropy - Entropy',header=F)
a<-table.element(a,myDifference,header=F)
a<-table.row.end(a)
a<-table.row.start(a)
a<-table.element(a,'Theil Entropy Index',header=F)
a<-table.element(a,myTheilEntropyIndex,header=F)
a<-table.row.end(a)
a<-table.row.start(a)
a<-table.element(a,'Exponential Index',header=F)
a<-table.element(a,myExponentialIndex,header=F)
a<-table.row.end(a)
a<-table.row.start(a)
a<-table.element(a,'Herfindahl',header=F)
a<-table.element(a,myHerfindahl,header=F)
a<-table.row.end(a)
a<-table.row.start(a)
a<-table.element(a,'Normalised Herfindahl',header=F)
a<-table.element(a,myNormalizedHerfindahlMeasure,header=F)
a<-table.row.end(a)
a<-table.row.start(a)
a<-table.element(a,'Rosenbluth',header=F)
a<-table.element(a,myRosenbluth,header=F)
a<-table.row.end(a)
a<-table.row.start(a)
a<-table.element(a,'Gini',header=F)
a<-table.element(a,myGini,header=F)
a<-table.row.end(a)
a<-table.row.start(a)
a<-table.element(a,'Concentration',header=F)
a<-table.element(a,myConcentrationCoefficient,header=F)
a<-table.row.end(a)
a<-table.row.start(a)
a<-table.element(a,'Ricci-Schutz (Pietra)',header=F)
a<-table.element(a,myRS,header=F)
a<-table.row.end(a)
a<-table.row.start(a)
a<-table.element(a,'Atkinson',header=F)
a<-table.element(a,myAtkinson,header=F)
a<-table.row.end(a)
a<-table.row.start(a)
a<-table.element(a,'Kolm',header=F)
a<-table.element(a,myKolm,header=F)
a<-table.row.end(a)
a<-table.row.start(a)
a<-table.element(a,'Coefficient of Variation',header=F)
a<-table.element(a,myCoefficientOfVariation,header=F)
a<-table.row.end(a)
a<-table.row.start(a)
a<-table.element(a,'Squared Coefficient of Variation',header=F)
a<-table.element(a,mySquaredCoefficientOfVariation,header=F)
a<-table.row.end(a)
a<-table.end(a)
table.save(a,file='mytable.tab')