Free Statistics

of Irreproducible Research!

Author's title

Author*Unverified author*
R Software Modulerwasp_cross.wasp
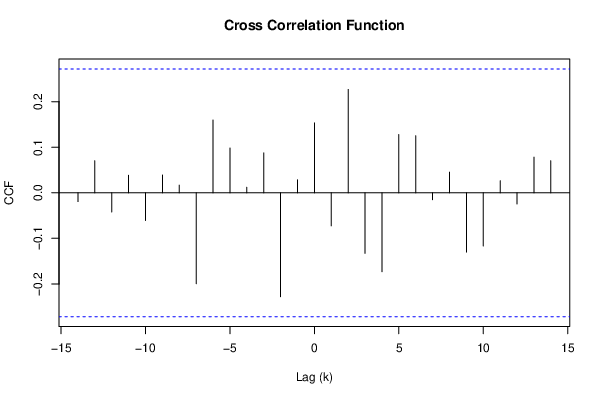
Title produced by softwareCross Correlation Function
Date of computationThu, 18 Jul 2019 21:38:26 +0200
Cite this page as followsStatistical Computations at FreeStatistics.org, Office for Research Development and Education, URL https://freestatistics.org/blog/index.php?v=date/2019/Jul/18/t15634787787hiy43jrn95hawk.htm/, Retrieved Fri, 29 Mar 2024 07:47:17 +0100
Statistical Computations at FreeStatistics.org, Office for Research Development and Education, URL https://freestatistics.org/blog/index.php?pk=, Retrieved Fri, 29 Mar 2024 07:47:17 +0100
QR Codes:

Original text written by user:
IsPrivate?This computation is private
User-defined keywords
Estimated Impact0
Dataseries X:
107
131
145
139
148
132
134
360
142
135
166
152
122
102
124
131
137
141
163
249
137
178
171
175
157
47
104
164
148
164
165
156
159
117
188
198
162
153
154
177
189
138
154
152
122
166
160
165
132
161
149
175
Dataseries Y:
9
18
18
17
12
31
11
12
18
14
21
17
13
22
16
14
22
14
17
13
12
14
28
21
17
2
4
25
19
22
9
6
24
20
18
27
15
15
13
14
24
6
23
21
25
28
18
19
12
16
13
13


Summary of computational transaction
Raw Input view raw input (R code)
Raw Outputview raw output of R engine
Computing time1 seconds
R ServerBig Analytics Cloud Computing Center

\begin{tabular}{lllllllll}
\hline
Summary of computational transaction \tabularnewline
Raw Input view raw input (R code)  \tabularnewline
Raw Outputview raw output of R engine  \tabularnewline
Computing time1 seconds \tabularnewline
R ServerBig Analytics Cloud Computing Center \tabularnewline
\hline
\end{tabular}
%Source: https://freestatistics.org/blog/index.php?pk=&T=0

[TABLE]
[ROW]
Summary of computational transaction[/C][/ROW] [ROW]Raw Input[/C] view raw input (R code) [/C][/ROW] [ROW]Raw Output[/C]view raw output of R engine [/C][/ROW] [ROW]Computing time[/C]1 seconds[/C][/ROW] [ROW]R Server[/C]Big Analytics Cloud Computing Center[/C][/ROW] [/TABLE] Source: https://freestatistics.org/blog/index.php?pk=&T=0

Globally Unique Identifier (entire table): ba.freestatistics.org/blog/index.php?pk=&T=0

As an alternative you can also use a QR Code:  

The GUIDs for individual cells are displayed in the table below:

Summary of computational transaction
Raw Input view raw input (R code)
Raw Outputview raw output of R engine
Computing time1 seconds
R ServerBig Analytics Cloud Computing Center


Cross Correlation Function
ParameterValue
Box-Cox transformation parameter (lambda) of X series1
Degree of non-seasonal differencing (d) of X series0
Degree of seasonal differencing (D) of X series0
Seasonal Period (s)1
Box-Cox transformation parameter (lambda) of Y series1
Degree of non-seasonal differencing (d) of Y series0
Degree of seasonal differencing (D) of Y series0
krho(Y[t],X[t+k])
-14-0.0192558055922425
-130.0702543443229074
-12-0.0421382925315627
-110.0384307695220844
-10-0.060762628634984
-90.0388600783222732
-80.0167558195819783
-7-0.199500715276333
-60.159695750558701
-50.0981216525376349
-40.0122524301925872
-30.0875359173736446
-2-0.228061791939298
-10.0285289661285291
00.153281671305104
1-0.0725260515689944
20.226943011170832
3-0.132881079934113
4-0.173277715168307
50.127781723548199
60.125092579354444
7-0.0149891748616861
80.0453708283749644
9-0.13012692321465
10-0.116516918420044
110.0263736030371417
12-0.0246118201231198
130.0781106840598353
140.0702991181666985

\begin{tabular}{lllllllll}
\hline
Cross Correlation Function \tabularnewline
Parameter & Value \tabularnewline
Box-Cox transformation parameter (lambda) of X series & 1 \tabularnewline
Degree of non-seasonal differencing (d) of X series & 0 \tabularnewline
Degree of seasonal differencing (D) of X series & 0 \tabularnewline
Seasonal Period (s) & 1 \tabularnewline
Box-Cox transformation parameter (lambda) of Y series & 1 \tabularnewline
Degree of non-seasonal differencing (d) of Y series & 0 \tabularnewline
Degree of seasonal differencing (D) of Y series & 0 \tabularnewline
k & rho(Y[t],X[t+k]) \tabularnewline
-14 & -0.0192558055922425 \tabularnewline
-13 & 0.0702543443229074 \tabularnewline
-12 & -0.0421382925315627 \tabularnewline
-11 & 0.0384307695220844 \tabularnewline
-10 & -0.060762628634984 \tabularnewline
-9 & 0.0388600783222732 \tabularnewline
-8 & 0.0167558195819783 \tabularnewline
-7 & -0.199500715276333 \tabularnewline
-6 & 0.159695750558701 \tabularnewline
-5 & 0.0981216525376349 \tabularnewline
-4 & 0.0122524301925872 \tabularnewline
-3 & 0.0875359173736446 \tabularnewline
-2 & -0.228061791939298 \tabularnewline
-1 & 0.0285289661285291 \tabularnewline
0 & 0.153281671305104 \tabularnewline
1 & -0.0725260515689944 \tabularnewline
2 & 0.226943011170832 \tabularnewline
3 & -0.132881079934113 \tabularnewline
4 & -0.173277715168307 \tabularnewline
5 & 0.127781723548199 \tabularnewline
6 & 0.125092579354444 \tabularnewline
7 & -0.0149891748616861 \tabularnewline
8 & 0.0453708283749644 \tabularnewline
9 & -0.13012692321465 \tabularnewline
10 & -0.116516918420044 \tabularnewline
11 & 0.0263736030371417 \tabularnewline
12 & -0.0246118201231198 \tabularnewline
13 & 0.0781106840598353 \tabularnewline
14 & 0.0702991181666985 \tabularnewline
\hline
\end{tabular}
%Source: https://freestatistics.org/blog/index.php?pk=&T=1

[TABLE]
[ROW][C]Cross Correlation Function[/C][/ROW]
[ROW][C]Parameter[/C][C]Value[/C][/ROW]
[ROW][C]Box-Cox transformation parameter (lambda) of X series[/C][C]1[/C][/ROW]
[ROW][C]Degree of non-seasonal differencing (d) of X series[/C][C]0[/C][/ROW]
[ROW][C]Degree of seasonal differencing (D) of X series[/C][C]0[/C][/ROW]
[ROW][C]Seasonal Period (s)[/C][C]1[/C][/ROW]
[ROW][C]Box-Cox transformation parameter (lambda) of Y series[/C][C]1[/C][/ROW]
[ROW][C]Degree of non-seasonal differencing (d) of Y series[/C][C]0[/C][/ROW]
[ROW][C]Degree of seasonal differencing (D) of Y series[/C][C]0[/C][/ROW]
[ROW][C]k[/C][C]rho(Y[t],X[t+k])[/C][/ROW]
[ROW][C]-14[/C][C]-0.0192558055922425[/C][/ROW]
[ROW][C]-13[/C][C]0.0702543443229074[/C][/ROW]
[ROW][C]-12[/C][C]-0.0421382925315627[/C][/ROW]
[ROW][C]-11[/C][C]0.0384307695220844[/C][/ROW]
[ROW][C]-10[/C][C]-0.060762628634984[/C][/ROW]
[ROW][C]-9[/C][C]0.0388600783222732[/C][/ROW]
[ROW][C]-8[/C][C]0.0167558195819783[/C][/ROW]
[ROW][C]-7[/C][C]-0.199500715276333[/C][/ROW]
[ROW][C]-6[/C][C]0.159695750558701[/C][/ROW]
[ROW][C]-5[/C][C]0.0981216525376349[/C][/ROW]
[ROW][C]-4[/C][C]0.0122524301925872[/C][/ROW]
[ROW][C]-3[/C][C]0.0875359173736446[/C][/ROW]
[ROW][C]-2[/C][C]-0.228061791939298[/C][/ROW]
[ROW][C]-1[/C][C]0.0285289661285291[/C][/ROW]
[ROW][C]0[/C][C]0.153281671305104[/C][/ROW]
[ROW][C]1[/C][C]-0.0725260515689944[/C][/ROW]
[ROW][C]2[/C][C]0.226943011170832[/C][/ROW]
[ROW][C]3[/C][C]-0.132881079934113[/C][/ROW]
[ROW][C]4[/C][C]-0.173277715168307[/C][/ROW]
[ROW][C]5[/C][C]0.127781723548199[/C][/ROW]
[ROW][C]6[/C][C]0.125092579354444[/C][/ROW]
[ROW][C]7[/C][C]-0.0149891748616861[/C][/ROW]
[ROW][C]8[/C][C]0.0453708283749644[/C][/ROW]
[ROW][C]9[/C][C]-0.13012692321465[/C][/ROW]
[ROW][C]10[/C][C]-0.116516918420044[/C][/ROW]
[ROW][C]11[/C][C]0.0263736030371417[/C][/ROW]
[ROW][C]12[/C][C]-0.0246118201231198[/C][/ROW]
[ROW][C]13[/C][C]0.0781106840598353[/C][/ROW]
[ROW][C]14[/C][C]0.0702991181666985[/C][/ROW]
[/TABLE]
Source: https://freestatistics.org/blog/index.php?pk=&T=1

Globally Unique Identifier (entire table): ba.freestatistics.org/blog/index.php?pk=&T=1

As an alternative you can also use a QR Code:  

The GUIDs for individual cells are displayed in the table below:

Cross Correlation Function
ParameterValue
Box-Cox transformation parameter (lambda) of X series1
Degree of non-seasonal differencing (d) of X series0
Degree of seasonal differencing (D) of X series0
Seasonal Period (s)1
Box-Cox transformation parameter (lambda) of Y series1
Degree of non-seasonal differencing (d) of Y series0
Degree of seasonal differencing (D) of Y series0
krho(Y[t],X[t+k])
-14-0.0192558055922425
-130.0702543443229074
-12-0.0421382925315627
-110.0384307695220844
-10-0.060762628634984
-90.0388600783222732
-80.0167558195819783
-7-0.199500715276333
-60.159695750558701
-50.0981216525376349
-40.0122524301925872
-30.0875359173736446
-2-0.228061791939298
-10.0285289661285291
00.153281671305104
1-0.0725260515689944
20.226943011170832
3-0.132881079934113
4-0.173277715168307
50.127781723548199
60.125092579354444
7-0.0149891748616861
80.0453708283749644
9-0.13012692321465
10-0.116516918420044
110.0263736030371417
12-0.0246118201231198
130.0781106840598353
140.0702991181666985


Parameters (Session):
par1 = 1 ; par2 = 0 ; par3 = 0 ; par4 = 1 ; par5 = 1 ; par6 = 0 ; par7 = 0 ; par8 = na.fail ;
Parameters (R input):
par1 = 1 ; par2 = 0 ; par3 = 0 ; par4 = 1 ; par5 = 1 ; par6 = 0 ; par7 = 0 ; par8 = na.fail ;
R code (references can be found in the software module):
par8 <- 'na.fail'
par7 <- '0'
par6 <- '0'
par5 <- '1'
par4 <- '1'
par3 <- '0'
par2 <- '0'
par1 <- '1'
par1 <- as.numeric(par1)
par2 <- as.numeric(par2)
par3 <- as.numeric(par3)
par4 <- as.numeric(par4)
par5 <- as.numeric(par5)
par6 <- as.numeric(par6)
par7 <- as.numeric(par7)
if (par8=='na.fail') par8 <- na.fail else par8 <- na.pass
ccf <- function (x, y, lag.max = NULL, type = c('correlation', 'covariance'), plot = TRUE, na.action = na.fail, ...) {
type <- match.arg(type)
if (is.matrix(x) || is.matrix(y))
stop('univariate time series only')
X <- na.action(ts.intersect(as.ts(x), as.ts(y)))
colnames(X) <- c(deparse(substitute(x))[1L], deparse(substitute(y))[1L])
acf.out <- acf(X, lag.max = lag.max, plot = FALSE, type = type, na.action=na.action)
lag <- c(rev(acf.out$lag[-1, 2, 1]), acf.out$lag[, 1, 2])
y <- c(rev(acf.out$acf[-1, 2, 1]), acf.out$acf[, 1, 2])
acf.out$acf <- array(y, dim = c(length(y), 1L, 1L))
acf.out$lag <- array(lag, dim = c(length(y), 1L, 1L))
acf.out$snames <- paste(acf.out$snames, collapse = ' & ')
if (plot) {
plot(acf.out, ...)
return(invisible(acf.out))
}
else return(acf.out)
}
if (par1 == 0) {
x <- log(x)
} else {
x <- (x ^ par1 - 1) / par1
}
if (par5 == 0) {
y <- log(y)
} else {
y <- (y ^ par5 - 1) / par5
}
if (par2 > 0) x <- diff(x,lag=1,difference=par2)
if (par6 > 0) y <- diff(y,lag=1,difference=par6)
if (par3 > 0) x <- diff(x,lag=par4,difference=par3)
if (par7 > 0) y <- diff(y,lag=par4,difference=par7)
print(x)
print(y)
bitmap(file='test1.png')
(r <- ccf(x,y,na.action=par8,main='Cross Correlation Function',ylab='CCF',xlab='Lag (k)'))
dev.off()
load(file='createtable')
a<-table.start()
a<-table.row.start(a)
a<-table.element(a,'Cross Correlation Function',2,TRUE)
a<-table.row.end(a)
a<-table.row.start(a)
a<-table.element(a,'Parameter',header=TRUE)
a<-table.element(a,'Value',header=TRUE)
a<-table.row.end(a)
a<-table.row.start(a)
a<-table.element(a,'Box-Cox transformation parameter (lambda) of X series',header=TRUE)
a<-table.element(a,par1)
a<-table.row.end(a)
a<-table.row.start(a)
a<-table.element(a,'Degree of non-seasonal differencing (d) of X series',header=TRUE)
a<-table.element(a,par2)
a<-table.row.end(a)
a<-table.row.start(a)
a<-table.element(a,'Degree of seasonal differencing (D) of X series',header=TRUE)
a<-table.element(a,par3)
a<-table.row.end(a)
a<-table.row.start(a)
a<-table.element(a,'Seasonal Period (s)',header=TRUE)
a<-table.element(a,par4)
a<-table.row.end(a)
a<-table.row.start(a)
a<-table.element(a,'Box-Cox transformation parameter (lambda) of Y series',header=TRUE)
a<-table.element(a,par5)
a<-table.row.end(a)
a<-table.row.start(a)
a<-table.element(a,'Degree of non-seasonal differencing (d) of Y series',header=TRUE)
a<-table.element(a,par6)
a<-table.row.end(a)
a<-table.row.start(a)
a<-table.element(a,'Degree of seasonal differencing (D) of Y series',header=TRUE)
a<-table.element(a,par7)
a<-table.row.end(a)
a<-table.row.start(a)
a<-table.element(a,'k',header=TRUE)
a<-table.element(a,'rho(Y[t],X[t+k])',header=TRUE)
a<-table.row.end(a)
mylength <- length(r$acf)
myhalf <- floor((mylength-1)/2)
for (i in 1:mylength) {
a<-table.row.start(a)
a<-table.element(a,i-myhalf-1,header=TRUE)
a<-table.element(a,r$acf[i])
a<-table.row.end(a)
}
a<-table.end(a)
table.save(a,file='mytable.tab')