Free Statistics
of Irreproducible Research!
Description of Statistical Computation | ||||||||||||||||||||||||||||||||||||||||||||||
|---|---|---|---|---|---|---|---|---|---|---|---|---|---|---|---|---|---|---|---|---|---|---|---|---|---|---|---|---|---|---|---|---|---|---|---|---|---|---|---|---|---|---|---|---|---|---|
| Author's title | ||||||||||||||||||||||||||||||||||||||||||||||
| Author | *Unverified author* | |||||||||||||||||||||||||||||||||||||||||||||
| R Software Module | rwasp_spearman.wasp | |||||||||||||||||||||||||||||||||||||||||||||
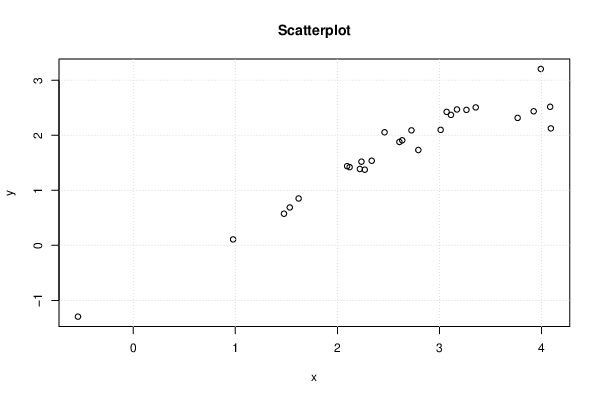
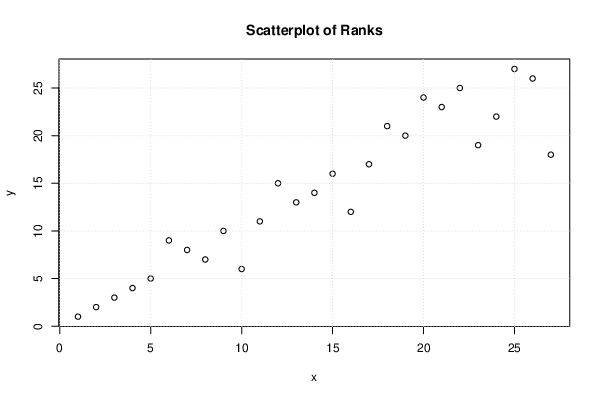
| Title produced by software | Spearman Rank Correlation | |||||||||||||||||||||||||||||||||||||||||||||
| Date of computation | Fri, 18 Oct 2019 23:25:13 +0200 | |||||||||||||||||||||||||||||||||||||||||||||
| Cite this page as follows | Statistical Computations at FreeStatistics.org, Office for Research Development and Education, URL https://freestatistics.org/blog/index.php?v=date/2019/Oct/18/t15714339472bd3t0uad6vgxt6.htm/, Retrieved Tue, 30 Apr 2024 22:14:45 +0000 | |||||||||||||||||||||||||||||||||||||||||||||
| Statistical Computations at FreeStatistics.org, Office for Research Development and Education, URL https://freestatistics.org/blog/index.php?pk=318926, Retrieved Tue, 30 Apr 2024 22:14:45 +0000 | ||||||||||||||||||||||||||||||||||||||||||||||
| QR Codes: | ||||||||||||||||||||||||||||||||||||||||||||||
|
| ||||||||||||||||||||||||||||||||||||||||||||||
| Original text written by user: | ||||||||||||||||||||||||||||||||||||||||||||||
| IsPrivate? | No (this computation is public) | |||||||||||||||||||||||||||||||||||||||||||||
| User-defined keywords | ||||||||||||||||||||||||||||||||||||||||||||||
| Estimated Impact | 94 | |||||||||||||||||||||||||||||||||||||||||||||
Tree of Dependent Computations | ||||||||||||||||||||||||||||||||||||||||||||||
| Family? (F = Feedback message, R = changed R code, M = changed R Module, P = changed Parameters, D = changed Data) | ||||||||||||||||||||||||||||||||||||||||||||||
| - [Spearman Rank Correlation] [] [2019-10-18 21:25:13] [d41d8cd98f00b204e9800998ecf8427e] [Current] | ||||||||||||||||||||||||||||||||||||||||||||||
| Feedback Forum | ||||||||||||||||||||||||||||||||||||||||||||||
Post a new message | ||||||||||||||||||||||||||||||||||||||||||||||
Dataset | ||||||||||||||||||||||||||||||||||||||||||||||
| Dataseries X: | ||||||||||||||||||||||||||||||||||||||||||||||
3.923198482 3.355352521 3.011684284 4.091213472 4.084557852 3.264489131 3.766129784 3.992770823 -0.54141524 3.112752558 3.171661653 2.462250663 3.070654392 2.235820402 2.725664507 2.336545755 2.220263192 1.620463769 1.533868628 0.978287599 1.476911825 2.268496345 2.792958826 2.095200542 2.120262192 2.607602101 2.635155718 | ||||||||||||||||||||||||||||||||||||||||||||||
| Dataseries Y: | ||||||||||||||||||||||||||||||||||||||||||||||
2.436036766 2.506268418 2.098265365 2.124832238 2.517217513 2.461391452 2.315347438 3.204714162 -1.294824902 2.369731394 2.468767432 2.054236524 2.424888321 1.52028568 2.089777283 1.536802397 1.387692825 0.852021492 0.688743986 0.108574911 0.574870836 1.37486412 1.732474185 1.439071701 1.420530401 1.87856963 1.908516226 | ||||||||||||||||||||||||||||||||||||||||||||||
Tables (Output of Computation) | ||||||||||||||||||||||||||||||||||||||||||||||
| ||||||||||||||||||||||||||||||||||||||||||||||
Figures (Output of Computation) | ||||||||||||||||||||||||||||||||||||||||||||||
Input Parameters & R Code | ||||||||||||||||||||||||||||||||||||||||||||||
| Parameters (Session): | ||||||||||||||||||||||||||||||||||||||||||||||
| Parameters (R input): | ||||||||||||||||||||||||||||||||||||||||||||||
| R code (references can be found in the software module): | ||||||||||||||||||||||||||||||||||||||||||||||
k <- cor.test(x,y,method='spearman') | ||||||||||||||||||||||||||||||||||||||||||||||