Free Statistics

of Irreproducible Research!

Author's title

Author*The author of this computation has been verified*
R Software Modulerwasp_correlation.wasp
Title produced by softwarePearson Correlation
Date of computationSat, 04 Jan 2020 04:22:25 +0100
Cite this page as followsStatistical Computations at FreeStatistics.org, Office for Research Development and Education, URL https://freestatistics.org/blog/index.php?v=date/2020/Jan/04/t1578108563w8nwg4b33nsho0f.htm/, Retrieved Fri, 26 Apr 2024 07:41:24 +0200
Statistical Computations at FreeStatistics.org, Office for Research Development and Education, URL https://freestatistics.org/blog/index.php?pk=, Retrieved Fri, 26 Apr 2024 07:41:24 +0200
QR Codes:

Original text written by user:
IsPrivate?This computation is private
User-defined keywords
Estimated Impact0
Dataseries X:
0.815402
0.591772
0.586795
0.806701
0.764876
0.442682
0.413728
0.629126
0.462717
0.897289
0.931093
0.656383
1.04604
0.680635
0.553083
0.755128
0.733062
0.777507
0.800234
0.626868
0.601043
0.676524
0.608236
0.821496
0.628641
0.689699
0.631185
0.75707
0.789816
0.709535
0.684615
0.707059
0.777683
0.607249
0.655898
0.772858
0.762992
0.87721
0.73791
0.773947
0.857709
0.716612
0.735852
0.822517
0.537905
0.698957
0.887378
0.813575
0.725381
0.713147
0.616444
0.356151
0.688407
0.655163
0.583601
0.61734
0.645463
0.573014
0.701581
0.590261
0.741326
0.685607
0.647584
0.722673
0.803082
0.703267
0.674896
0.707468
0.735212
0.694542
0.740589
0.733794
0.774312
0.845874
0.799514
0.85674
Dataseries Y:
309.528
206.39
177.346
258.007
236.255
164.124
145.562
208.19
135.982
325.414
362.083
220.626
438.995
243.908
170.871
253.939
265.279
274.123
267.944
252.335
227.8
239.333
209.089
304.367
189.765
246.378
201.524
292.973
278.276
263.268
213.64
259.621
255.813
213.479
244.207
263.449
324.646
264.598
194.609
220.232
273.889
258.964
255.457
258.949
195.902
291.995
291.867
273.314
222.094
259.031
208.947
164.406
236.442
210.816
238.243
142.692
228.91
172.09
233.642
193.08
246.657
235.303
224.761
240.969
254.253
219.735
242.859
232.824
238.785
287.846
297.121
269.624
280.478
276.454
231.495
294.735


Summary of computational transaction
Raw Input view raw input (R code)
Raw Outputview raw output of R engine
Computing time1 seconds
R ServerBig Analytics Cloud Computing Center

\begin{tabular}{lllllllll}
\hline
Summary of computational transaction \tabularnewline
Raw Input view raw input (R code)  \tabularnewline
Raw Outputview raw output of R engine  \tabularnewline
Computing time1 seconds \tabularnewline
R ServerBig Analytics Cloud Computing Center \tabularnewline
\hline
\end{tabular}
%Source: https://freestatistics.org/blog/index.php?pk=&T=0

[TABLE]
[ROW]
Summary of computational transaction[/C][/ROW] [ROW]Raw Input[/C] view raw input (R code) [/C][/ROW] [ROW]Raw Output[/C]view raw output of R engine [/C][/ROW] [ROW]Computing time[/C]1 seconds[/C][/ROW] [ROW]R Server[/C]Big Analytics Cloud Computing Center[/C][/ROW] [/TABLE] Source: https://freestatistics.org/blog/index.php?pk=&T=0

Globally Unique Identifier (entire table): ba.freestatistics.org/blog/index.php?pk=&T=0

As an alternative you can also use a QR Code:  

The GUIDs for individual cells are displayed in the table below:

Summary of computational transaction
Raw Input view raw input (R code)
Raw Outputview raw output of R engine
Computing time1 seconds
R ServerBig Analytics Cloud Computing Center


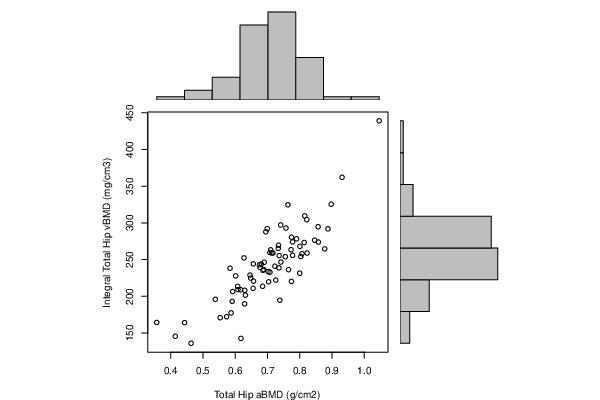
Pearson Product Moment Correlation - Ungrouped Data
StatisticVariable XVariable Y
Mean0.705851644736842243.534171052632
Biased Variance0.01339980665615012385.26479364179
Biased Standard Deviation0.11575753390665448.8391727370744
Covariance4.84455688954158
Correlation0.845637368805561
Determination0.715102559520392
T-Test13.6287414403672
p-value (2 sided)7.24270407406683e-22
p-value (1 sided)3.62135203703341e-22
95% CI of Correlation[0.766274923169582, 0.899583961996621]
Degrees of Freedom74
Number of Observations76

\begin{tabular}{lllllllll}
\hline
Pearson Product Moment Correlation - Ungrouped Data \tabularnewline
Statistic & Variable X & Variable Y \tabularnewline
Mean & 0.705851644736842 & 243.534171052632 \tabularnewline
Biased Variance & 0.0133998066561501 & 2385.26479364179 \tabularnewline
Biased Standard Deviation & 0.115757533906654 & 48.8391727370744 \tabularnewline
Covariance & 4.84455688954158 \tabularnewline
Correlation & 0.845637368805561 \tabularnewline
Determination & 0.715102559520392 \tabularnewline
T-Test & 13.6287414403672 \tabularnewline
p-value (2 sided) & 7.24270407406683e-22 \tabularnewline
p-value (1 sided) & 3.62135203703341e-22 \tabularnewline
95% CI of Correlation & [0.766274923169582, 0.899583961996621] \tabularnewline
Degrees of Freedom & 74 \tabularnewline
Number of Observations & 76 \tabularnewline
\hline
\end{tabular}
%Source: https://freestatistics.org/blog/index.php?pk=&T=1

[TABLE]
[ROW][C]Pearson Product Moment Correlation - Ungrouped Data[/C][/ROW]
[ROW][C]Statistic[/C][C]Variable X[/C][C]Variable Y[/C][/ROW]
[ROW][C]Mean[/C][C]0.705851644736842[/C][C]243.534171052632[/C][/ROW]
[ROW][C]Biased Variance[/C][C]0.0133998066561501[/C][C]2385.26479364179[/C][/ROW]
[ROW][C]Biased Standard Deviation[/C][C]0.115757533906654[/C][C]48.8391727370744[/C][/ROW]
[ROW][C]Covariance[/C][C]4.84455688954158[/C][/ROW]
[ROW][C]Correlation[/C][C]0.845637368805561[/C][/ROW]
[ROW][C]Determination[/C][C]0.715102559520392[/C][/ROW]
[ROW][C]T-Test[/C][C]13.6287414403672[/C][/ROW]
[ROW][C]p-value (2 sided)[/C][C]7.24270407406683e-22[/C][/ROW]
[ROW][C]p-value (1 sided)[/C][C]3.62135203703341e-22[/C][/ROW]
[ROW][C]95% CI of Correlation[/C][C][0.766274923169582, 0.899583961996621][/C][/ROW]
[ROW][C]Degrees of Freedom[/C][C]74[/C][/ROW]
[ROW][C]Number of Observations[/C][C]76[/C][/ROW]
[/TABLE]
Source: https://freestatistics.org/blog/index.php?pk=&T=1

Globally Unique Identifier (entire table): ba.freestatistics.org/blog/index.php?pk=&T=1

As an alternative you can also use a QR Code:  

The GUIDs for individual cells are displayed in the table below:

Pearson Product Moment Correlation - Ungrouped Data
StatisticVariable XVariable Y
Mean0.705851644736842243.534171052632
Biased Variance0.01339980665615012385.26479364179
Biased Standard Deviation0.11575753390665448.8391727370744
Covariance4.84455688954158
Correlation0.845637368805561
Determination0.715102559520392
T-Test13.6287414403672
p-value (2 sided)7.24270407406683e-22
p-value (1 sided)3.62135203703341e-22
95% CI of Correlation[0.766274923169582, 0.899583961996621]
Degrees of Freedom74
Number of Observations76


Normality Tests
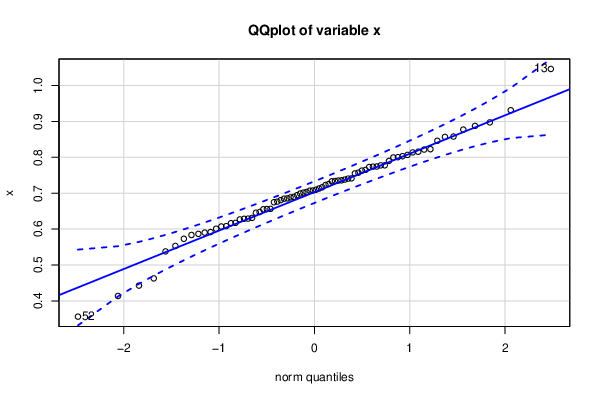
> jarque.x
	Jarque-Bera Normality Test
data:  x
JB = 4.6222, p-value = 0.09915
alternative hypothesis: greater
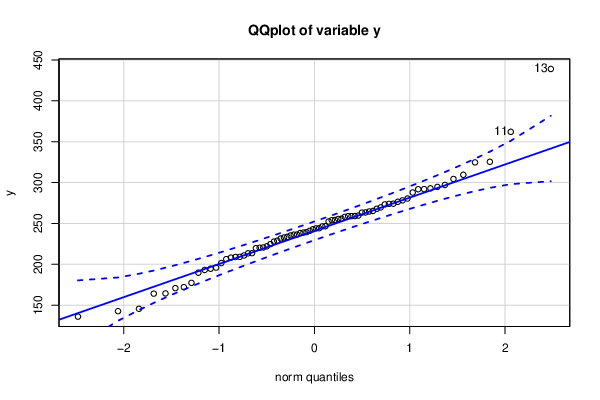
> jarque.y
	Jarque-Bera Normality Test
data:  y
JB = 23.6, p-value = 7.506e-06
alternative hypothesis: greater
> ad.x
	Anderson-Darling normality test
data:  x
A = 0.43249, p-value = 0.2966
> ad.y
	Anderson-Darling normality test
data:  y
A = 0.56092, p-value = 0.1422

\begin{tabular}{lllllllll}
\hline
Normality Tests \tabularnewline
> jarque.x
	Jarque-Bera Normality Test
data:  x
JB = 4.6222, p-value = 0.09915
alternative hypothesis: greater
\tabularnewline
> jarque.y
	Jarque-Bera Normality Test
data:  y
JB = 23.6, p-value = 7.506e-06
alternative hypothesis: greater
\tabularnewline
> ad.x
	Anderson-Darling normality test
data:  x
A = 0.43249, p-value = 0.2966
\tabularnewline
> ad.y
	Anderson-Darling normality test
data:  y
A = 0.56092, p-value = 0.1422
\tabularnewline \hline \end{tabular} %Source: https://freestatistics.org/blog/index.php?pk=&T=2

[TABLE]
[ROW][C]Normality Tests[/C][/ROW]
[ROW][C]
> jarque.x
	Jarque-Bera Normality Test
data:  x
JB = 4.6222, p-value = 0.09915
alternative hypothesis: greater
[/C][/ROW] [ROW][C]
> jarque.y
	Jarque-Bera Normality Test
data:  y
JB = 23.6, p-value = 7.506e-06
alternative hypothesis: greater
[/C][/ROW] [ROW][C]
> ad.x
	Anderson-Darling normality test
data:  x
A = 0.43249, p-value = 0.2966
[/C][/ROW] [ROW][C]
> ad.y
	Anderson-Darling normality test
data:  y
A = 0.56092, p-value = 0.1422
[/C][/ROW] [/TABLE] Source: https://freestatistics.org/blog/index.php?pk=&T=2

Globally Unique Identifier (entire table): ba.freestatistics.org/blog/index.php?pk=&T=2

As an alternative you can also use a QR Code:  

The GUIDs for individual cells are displayed in the table below:

Normality Tests
> jarque.x
	Jarque-Bera Normality Test
data:  x
JB = 4.6222, p-value = 0.09915
alternative hypothesis: greater
> jarque.y
	Jarque-Bera Normality Test
data:  y
JB = 23.6, p-value = 7.506e-06
alternative hypothesis: greater
> ad.x
	Anderson-Darling normality test
data:  x
A = 0.43249, p-value = 0.2966
> ad.y
	Anderson-Darling normality test
data:  y
A = 0.56092, p-value = 0.1422


Parameters (Session):
Parameters (R input):
R code (references can be found in the software module):
library(psychometric)
x <- x[!is.na(y)]
y <- y[!is.na(y)]
y <- y[!is.na(x)]
x <- x[!is.na(x)]
bitmap(file='test1.png')
histx <- hist(x, plot=FALSE)
histy <- hist(y, plot=FALSE)
maxcounts <- max(c(histx$counts, histx$counts))
xrange <- c(min(x),max(x))
yrange <- c(min(y),max(y))
nf <- layout(matrix(c(2,0,1,3),2,2,byrow=TRUE), c(3,1), c(1,3), TRUE)
par(mar=c(4,4,1,1))
plot(x, y, xlim=xrange, ylim=yrange, xlab=xlab, ylab=ylab, sub=main)
par(mar=c(0,4,1,1))
barplot(histx$counts, axes=FALSE, ylim=c(0, maxcounts), space=0)
par(mar=c(4,0,1,1))
barplot(histy$counts, axes=FALSE, xlim=c(0, maxcounts), space=0, horiz=TRUE)
dev.off()
lx = length(x)
makebiased = (lx-1)/lx
varx = var(x)*makebiased
vary = var(y)*makebiased
corxy <- cor.test(x,y,method='pearson', na.rm = T)
cxy <- as.matrix(corxy$estimate)[1,1]
load(file='createtable')
a<-table.start()
a<-table.row.start(a)
a<-table.element(a,'Pearson Product Moment Correlation - Ungrouped Data',3,TRUE)
a<-table.row.end(a)
a<-table.row.start(a)
a<-table.element(a,'Statistic',1,TRUE)
a<-table.element(a,'Variable X',1,TRUE)
a<-table.element(a,'Variable Y',1,TRUE)
a<-table.row.end(a)
a<-table.row.start(a)
a<-table.element(a,'Mean',header=TRUE)
a<-table.element(a,mean(x))
a<-table.element(a,mean(y))
a<-table.row.end(a)
a<-table.row.start(a)
a<-table.element(a,'Biased Variance',header=TRUE)
a<-table.element(a,varx)
a<-table.element(a,vary)
a<-table.row.end(a)
a<-table.row.start(a)
a<-table.element(a,'Biased Standard Deviation',header=TRUE)
a<-table.element(a,sqrt(varx))
a<-table.element(a,sqrt(vary))
a<-table.row.end(a)
a<-table.row.start(a)
a<-table.element(a,'Covariance',header=TRUE)
a<-table.element(a,cov(x,y),2)
a<-table.row.end(a)
a<-table.row.start(a)
a<-table.element(a,'Correlation',header=TRUE)
a<-table.element(a,cxy,2)
a<-table.row.end(a)
a<-table.row.start(a)
a<-table.element(a,'Determination',header=TRUE)
a<-table.element(a,cxy*cxy,2)
a<-table.row.end(a)
a<-table.row.start(a)
a<-table.element(a,'T-Test',header=TRUE)
a<-table.element(a,as.matrix(corxy$statistic)[1,1],2)
a<-table.row.end(a)
a<-table.row.start(a)
a<-table.element(a,'p-value (2 sided)',header=TRUE)
a<-table.element(a,(p2 <- as.matrix(corxy$p.value)[1,1]),2)
a<-table.row.end(a)
a<-table.row.start(a)
a<-table.element(a,'p-value (1 sided)',header=TRUE)
a<-table.element(a,p2/2,2)
a<-table.row.end(a)
a<-table.row.start(a)
a<-table.element(a,'95% CI of Correlation',header=TRUE)
a<-table.element(a,paste('[',CIr(r=cxy, n = lx, level = .95)[1],', ', CIr(r=cxy, n = lx, level = .95)[2],']',sep=''),2)
a<-table.row.end(a)
a<-table.row.start(a)
a<-table.element(a,'Degrees of Freedom',header=TRUE)
a<-table.element(a,lx-2,2)
a<-table.row.end(a)
a<-table.row.start(a)
a<-table.element(a,'Number of Observations',header=TRUE)
a<-table.element(a,lx,2)
a<-table.row.end(a)
a<-table.end(a)
table.save(a,file='mytable.tab')
library(moments)
library(nortest)
jarque.x <- jarque.test(x)
jarque.y <- jarque.test(y)
if(lx>7) {
ad.x <- ad.test(x)
ad.y <- ad.test(y)
}
a<-table.start()
a<-table.row.start(a)
a<-table.element(a,'Normality Tests',1,TRUE)
a<-table.row.end(a)
a<-table.row.start(a)
a<-table.element(a,paste('
',RC.texteval('jarque.x'),'
',sep=''))
a<-table.row.end(a)
a<-table.row.start(a)
a<-table.element(a,paste('
',RC.texteval('jarque.y'),'
',sep=''))
a<-table.row.end(a)
if(lx>7) {
a<-table.row.start(a)
a<-table.element(a,paste('
',RC.texteval('ad.x'),'
',sep=''))
a<-table.row.end(a)
a<-table.row.start(a)
a<-table.element(a,paste('
',RC.texteval('ad.y'),'
',sep=''))
a<-table.row.end(a)
}
a<-table.end(a)
table.save(a,file='mytable1.tab')
library(car)
bitmap(file='test2.png')
qqPlot(x,main='QQplot of variable x')
dev.off()
bitmap(file='test3.png')
qqPlot(y,main='QQplot of variable y')
dev.off()