Free Statistics

of Irreproducible Research!

Author's title

Author*Unverified author*
R Software Modulerwasp_boxcoxnorm.wasp
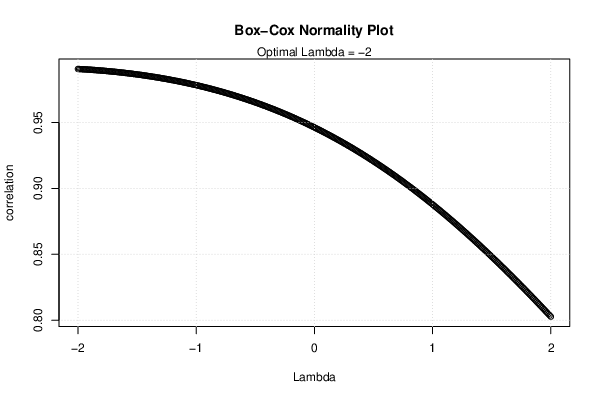
Title produced by softwareBox-Cox Normality Plot
Date of computationThu, 30 Jan 2020 01:02:08 +0100
Cite this page as followsStatistical Computations at FreeStatistics.org, Office for Research Development and Education, URL https://freestatistics.org/blog/index.php?v=date/2020/Jan/30/t1580342663cn0042oh9h0ty2n.htm/, Retrieved Fri, 26 Apr 2024 20:07:10 +0000
Statistical Computations at FreeStatistics.org, Office for Research Development and Education, URL https://freestatistics.org/blog/index.php?pk=319064, Retrieved Fri, 26 Apr 2024 20:07:10 +0000
QR Codes:

Original text written by user:
IsPrivate?No (this computation is public)
User-defined keywords
Estimated Impact106
Family? (F = Feedback message, R = changed R code, M = changed R Module, P = changed Parameters, D = changed Data)
-       [Box-Cox Normality Plot] [] [2020-01-30 00:02:08] [d41d8cd98f00b204e9800998ecf8427e] [Current]
Feedback Forum

Post a new message
Dataseries X:
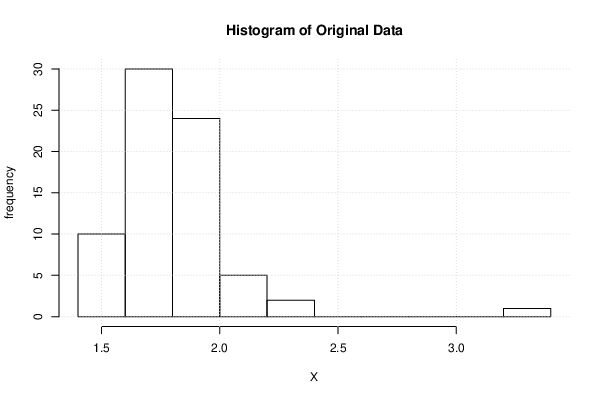
0.63
0.64
0.58
0.98
1.25
0.46
0.84
1.03
1.19
0.67
0.43
0.47
0.91
0.91
1.00
0.73
0.91
0.89
0.53
0.65
0.51
2.25
0.87
0.55
0.64
0.56
0.68
0.73
1.07
1.24
0.91
0.72
1.03
0.50
0.61
0.76
0.79
0.76
0.75
0.90
0.93
0.92
0.91
0.71
0.69
0.64
0.70
0.62
0.64
0.62
0.62
1.12
0.78
0.99
0.90
0.64
0.94
0.84
0.60
0.67
0.75
0.77
0.93
0.77
0.82
0.97
0.89
0.74
0.82
0.69
0.81
0.91


Summary of computational transaction
Raw Input view raw input (R code)
Raw Outputview raw output of R engine
Computing time2 seconds
R ServerBig Analytics Cloud Computing Center

\begin{tabular}{lllllllll}
\hline
Summary of computational transaction \tabularnewline
Raw Input view raw input (R code)  \tabularnewline
Raw Outputview raw output of R engine  \tabularnewline
Computing time2 seconds \tabularnewline
R ServerBig Analytics Cloud Computing Center \tabularnewline
\hline
\end{tabular}
%Source: https://freestatistics.org/blog/index.php?pk=319064&T=0

[TABLE]
[ROW]
Summary of computational transaction[/C][/ROW] [ROW]Raw Input[/C] view raw input (R code) [/C][/ROW] [ROW]Raw Output[/C]view raw output of R engine [/C][/ROW] [ROW]Computing time[/C]2 seconds[/C][/ROW] [ROW]R Server[/C]Big Analytics Cloud Computing Center[/C][/ROW] [/TABLE] Source: https://freestatistics.org/blog/index.php?pk=319064&T=0

Globally Unique Identifier (entire table): ba.freestatistics.org/blog/index.php?pk=319064&T=0

As an alternative you can also use a QR Code:  

The GUIDs for individual cells are displayed in the table below:

Summary of computational transaction
Raw Input view raw input (R code)
Raw Outputview raw output of R engine
Computing time2 seconds
R ServerBig Analytics Cloud Computing Center


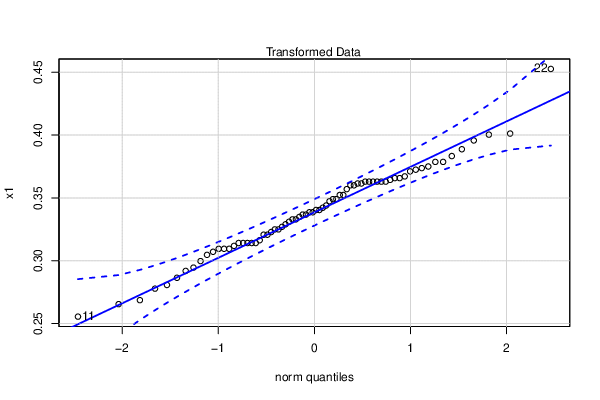
Box-Cox Normality Plot
# observations x72
maximum correlation0.990733926889019
optimal lambda-2
transformation formulafor all lambda <> 0 : T(Y) = (Y^lambda - 1) / lambda

\begin{tabular}{lllllllll}
\hline
Box-Cox Normality Plot \tabularnewline
# observations x & 72 \tabularnewline
maximum correlation & 0.990733926889019 \tabularnewline
optimal lambda & -2 \tabularnewline
transformation formula & for all lambda <> 0 : T(Y) = (Y^lambda - 1) / lambda \tabularnewline
\hline
\end{tabular}
%Source: https://freestatistics.org/blog/index.php?pk=319064&T=1

[TABLE]
[ROW][C]Box-Cox Normality Plot[/C][/ROW]
[ROW][C]# observations x[/C][C]72[/C][/ROW]
[ROW][C]maximum correlation[/C][C]0.990733926889019[/C][/ROW]
[ROW][C]optimal lambda[/C][C]-2[/C][/ROW]
[ROW][C]transformation formula[/C][C]for all lambda <> 0 : T(Y) = (Y^lambda - 1) / lambda[/C][/ROW]
[/TABLE]
Source: https://freestatistics.org/blog/index.php?pk=319064&T=1

Globally Unique Identifier (entire table): ba.freestatistics.org/blog/index.php?pk=319064&T=1

As an alternative you can also use a QR Code:  

The GUIDs for individual cells are displayed in the table below:

Box-Cox Normality Plot
# observations x72
maximum correlation0.990733926889019
optimal lambda-2
transformation formulafor all lambda <> 0 : T(Y) = (Y^lambda - 1) / lambda


Obs.OriginalTransformed
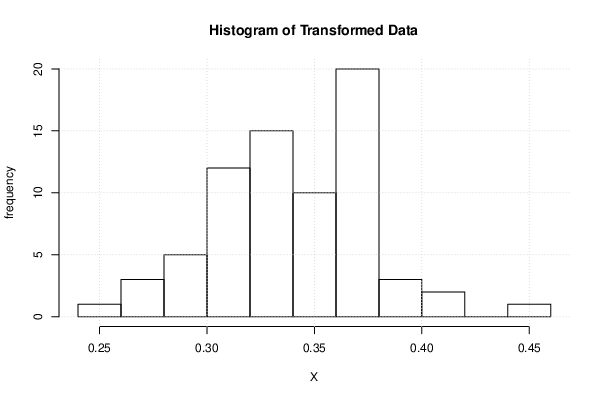
11.630.311810756897136
21.640.314098750743605
31.580.299711584681942
41.980.372461993674115
52.250.401234567901235
61.460.265434415462563
71.840.352315689981096
82.030.378667281419107
92.190.395748629094473
101.670.320717845745634
111.430.255489265978776
121.470.268614928964783
131.910.362942353553905
141.910.362942353553905
1520.375
161.730.332937953155802
171.910.362942353553905
181.890.36002631505277
191.530.28640693750267
201.650.316345270890725
211.510.280711372308232
223.250.452662721893491
231.870.357016214361291
241.550.291883454734651
251.640.314098750743605
261.560.294543063773833
271.680.322845804988662
281.730.332937953155802
292.070.3833111624542
302.240.400350765306122
311.910.362942353553905
321.720.33098972417523
332.030.378667281419107
341.50.277777777777778
351.610.307106207322248
361.760.338584710743802
371.790.343949939140476
381.760.338584710743802
391.750.336734693877551
401.90.361495844875346
411.930.365768208542511
421.920.364366319444444
431.910.362942353553905
441.710.329007215895489
451.690.324936101677112
461.640.314098750743605
471.70.326989619377163
481.620.309480262155159
491.640.314098750743605
501.620.309480262155159
511.620.309480262155159
522.120.38875044499822
531.780.342191642469385
541.990.373740562107018
551.90.361495844875346
561.640.314098750743605
571.940.367148474864491
581.840.352315689981096
591.60.3046875
601.670.320717845745634
611.750.336734693877551
621.770.340403460052986
631.930.365768208542511
641.770.340403460052986
651.820.349052046854245
661.970.371163905279703
671.890.36002631505277
681.740.33485268859823
691.820.349052046854245
701.690.324936101677112
711.810.347379506120082
721.910.362942353553905

\begin{tabular}{lllllllll}
\hline
Obs. & Original & Transformed \tabularnewline
1 & 1.63 & 0.311810756897136 \tabularnewline
2 & 1.64 & 0.314098750743605 \tabularnewline
3 & 1.58 & 0.299711584681942 \tabularnewline
4 & 1.98 & 0.372461993674115 \tabularnewline
5 & 2.25 & 0.401234567901235 \tabularnewline
6 & 1.46 & 0.265434415462563 \tabularnewline
7 & 1.84 & 0.352315689981096 \tabularnewline
8 & 2.03 & 0.378667281419107 \tabularnewline
9 & 2.19 & 0.395748629094473 \tabularnewline
10 & 1.67 & 0.320717845745634 \tabularnewline
11 & 1.43 & 0.255489265978776 \tabularnewline
12 & 1.47 & 0.268614928964783 \tabularnewline
13 & 1.91 & 0.362942353553905 \tabularnewline
14 & 1.91 & 0.362942353553905 \tabularnewline
15 & 2 & 0.375 \tabularnewline
16 & 1.73 & 0.332937953155802 \tabularnewline
17 & 1.91 & 0.362942353553905 \tabularnewline
18 & 1.89 & 0.36002631505277 \tabularnewline
19 & 1.53 & 0.28640693750267 \tabularnewline
20 & 1.65 & 0.316345270890725 \tabularnewline
21 & 1.51 & 0.280711372308232 \tabularnewline
22 & 3.25 & 0.452662721893491 \tabularnewline
23 & 1.87 & 0.357016214361291 \tabularnewline
24 & 1.55 & 0.291883454734651 \tabularnewline
25 & 1.64 & 0.314098750743605 \tabularnewline
26 & 1.56 & 0.294543063773833 \tabularnewline
27 & 1.68 & 0.322845804988662 \tabularnewline
28 & 1.73 & 0.332937953155802 \tabularnewline
29 & 2.07 & 0.3833111624542 \tabularnewline
30 & 2.24 & 0.400350765306122 \tabularnewline
31 & 1.91 & 0.362942353553905 \tabularnewline
32 & 1.72 & 0.33098972417523 \tabularnewline
33 & 2.03 & 0.378667281419107 \tabularnewline
34 & 1.5 & 0.277777777777778 \tabularnewline
35 & 1.61 & 0.307106207322248 \tabularnewline
36 & 1.76 & 0.338584710743802 \tabularnewline
37 & 1.79 & 0.343949939140476 \tabularnewline
38 & 1.76 & 0.338584710743802 \tabularnewline
39 & 1.75 & 0.336734693877551 \tabularnewline
40 & 1.9 & 0.361495844875346 \tabularnewline
41 & 1.93 & 0.365768208542511 \tabularnewline
42 & 1.92 & 0.364366319444444 \tabularnewline
43 & 1.91 & 0.362942353553905 \tabularnewline
44 & 1.71 & 0.329007215895489 \tabularnewline
45 & 1.69 & 0.324936101677112 \tabularnewline
46 & 1.64 & 0.314098750743605 \tabularnewline
47 & 1.7 & 0.326989619377163 \tabularnewline
48 & 1.62 & 0.309480262155159 \tabularnewline
49 & 1.64 & 0.314098750743605 \tabularnewline
50 & 1.62 & 0.309480262155159 \tabularnewline
51 & 1.62 & 0.309480262155159 \tabularnewline
52 & 2.12 & 0.38875044499822 \tabularnewline
53 & 1.78 & 0.342191642469385 \tabularnewline
54 & 1.99 & 0.373740562107018 \tabularnewline
55 & 1.9 & 0.361495844875346 \tabularnewline
56 & 1.64 & 0.314098750743605 \tabularnewline
57 & 1.94 & 0.367148474864491 \tabularnewline
58 & 1.84 & 0.352315689981096 \tabularnewline
59 & 1.6 & 0.3046875 \tabularnewline
60 & 1.67 & 0.320717845745634 \tabularnewline
61 & 1.75 & 0.336734693877551 \tabularnewline
62 & 1.77 & 0.340403460052986 \tabularnewline
63 & 1.93 & 0.365768208542511 \tabularnewline
64 & 1.77 & 0.340403460052986 \tabularnewline
65 & 1.82 & 0.349052046854245 \tabularnewline
66 & 1.97 & 0.371163905279703 \tabularnewline
67 & 1.89 & 0.36002631505277 \tabularnewline
68 & 1.74 & 0.33485268859823 \tabularnewline
69 & 1.82 & 0.349052046854245 \tabularnewline
70 & 1.69 & 0.324936101677112 \tabularnewline
71 & 1.81 & 0.347379506120082 \tabularnewline
72 & 1.91 & 0.362942353553905 \tabularnewline
\hline
\end{tabular}
%Source: https://freestatistics.org/blog/index.php?pk=319064&T=2

[TABLE]
[ROW][C]Obs.[/C][C]Original[/C][C]Transformed[/C][/ROW]
[ROW][C]1[/C][C]1.63[/C][C]0.311810756897136[/C][/ROW]
[ROW][C]2[/C][C]1.64[/C][C]0.314098750743605[/C][/ROW]
[ROW][C]3[/C][C]1.58[/C][C]0.299711584681942[/C][/ROW]
[ROW][C]4[/C][C]1.98[/C][C]0.372461993674115[/C][/ROW]
[ROW][C]5[/C][C]2.25[/C][C]0.401234567901235[/C][/ROW]
[ROW][C]6[/C][C]1.46[/C][C]0.265434415462563[/C][/ROW]
[ROW][C]7[/C][C]1.84[/C][C]0.352315689981096[/C][/ROW]
[ROW][C]8[/C][C]2.03[/C][C]0.378667281419107[/C][/ROW]
[ROW][C]9[/C][C]2.19[/C][C]0.395748629094473[/C][/ROW]
[ROW][C]10[/C][C]1.67[/C][C]0.320717845745634[/C][/ROW]
[ROW][C]11[/C][C]1.43[/C][C]0.255489265978776[/C][/ROW]
[ROW][C]12[/C][C]1.47[/C][C]0.268614928964783[/C][/ROW]
[ROW][C]13[/C][C]1.91[/C][C]0.362942353553905[/C][/ROW]
[ROW][C]14[/C][C]1.91[/C][C]0.362942353553905[/C][/ROW]
[ROW][C]15[/C][C]2[/C][C]0.375[/C][/ROW]
[ROW][C]16[/C][C]1.73[/C][C]0.332937953155802[/C][/ROW]
[ROW][C]17[/C][C]1.91[/C][C]0.362942353553905[/C][/ROW]
[ROW][C]18[/C][C]1.89[/C][C]0.36002631505277[/C][/ROW]
[ROW][C]19[/C][C]1.53[/C][C]0.28640693750267[/C][/ROW]
[ROW][C]20[/C][C]1.65[/C][C]0.316345270890725[/C][/ROW]
[ROW][C]21[/C][C]1.51[/C][C]0.280711372308232[/C][/ROW]
[ROW][C]22[/C][C]3.25[/C][C]0.452662721893491[/C][/ROW]
[ROW][C]23[/C][C]1.87[/C][C]0.357016214361291[/C][/ROW]
[ROW][C]24[/C][C]1.55[/C][C]0.291883454734651[/C][/ROW]
[ROW][C]25[/C][C]1.64[/C][C]0.314098750743605[/C][/ROW]
[ROW][C]26[/C][C]1.56[/C][C]0.294543063773833[/C][/ROW]
[ROW][C]27[/C][C]1.68[/C][C]0.322845804988662[/C][/ROW]
[ROW][C]28[/C][C]1.73[/C][C]0.332937953155802[/C][/ROW]
[ROW][C]29[/C][C]2.07[/C][C]0.3833111624542[/C][/ROW]
[ROW][C]30[/C][C]2.24[/C][C]0.400350765306122[/C][/ROW]
[ROW][C]31[/C][C]1.91[/C][C]0.362942353553905[/C][/ROW]
[ROW][C]32[/C][C]1.72[/C][C]0.33098972417523[/C][/ROW]
[ROW][C]33[/C][C]2.03[/C][C]0.378667281419107[/C][/ROW]
[ROW][C]34[/C][C]1.5[/C][C]0.277777777777778[/C][/ROW]
[ROW][C]35[/C][C]1.61[/C][C]0.307106207322248[/C][/ROW]
[ROW][C]36[/C][C]1.76[/C][C]0.338584710743802[/C][/ROW]
[ROW][C]37[/C][C]1.79[/C][C]0.343949939140476[/C][/ROW]
[ROW][C]38[/C][C]1.76[/C][C]0.338584710743802[/C][/ROW]
[ROW][C]39[/C][C]1.75[/C][C]0.336734693877551[/C][/ROW]
[ROW][C]40[/C][C]1.9[/C][C]0.361495844875346[/C][/ROW]
[ROW][C]41[/C][C]1.93[/C][C]0.365768208542511[/C][/ROW]
[ROW][C]42[/C][C]1.92[/C][C]0.364366319444444[/C][/ROW]
[ROW][C]43[/C][C]1.91[/C][C]0.362942353553905[/C][/ROW]
[ROW][C]44[/C][C]1.71[/C][C]0.329007215895489[/C][/ROW]
[ROW][C]45[/C][C]1.69[/C][C]0.324936101677112[/C][/ROW]
[ROW][C]46[/C][C]1.64[/C][C]0.314098750743605[/C][/ROW]
[ROW][C]47[/C][C]1.7[/C][C]0.326989619377163[/C][/ROW]
[ROW][C]48[/C][C]1.62[/C][C]0.309480262155159[/C][/ROW]
[ROW][C]49[/C][C]1.64[/C][C]0.314098750743605[/C][/ROW]
[ROW][C]50[/C][C]1.62[/C][C]0.309480262155159[/C][/ROW]
[ROW][C]51[/C][C]1.62[/C][C]0.309480262155159[/C][/ROW]
[ROW][C]52[/C][C]2.12[/C][C]0.38875044499822[/C][/ROW]
[ROW][C]53[/C][C]1.78[/C][C]0.342191642469385[/C][/ROW]
[ROW][C]54[/C][C]1.99[/C][C]0.373740562107018[/C][/ROW]
[ROW][C]55[/C][C]1.9[/C][C]0.361495844875346[/C][/ROW]
[ROW][C]56[/C][C]1.64[/C][C]0.314098750743605[/C][/ROW]
[ROW][C]57[/C][C]1.94[/C][C]0.367148474864491[/C][/ROW]
[ROW][C]58[/C][C]1.84[/C][C]0.352315689981096[/C][/ROW]
[ROW][C]59[/C][C]1.6[/C][C]0.3046875[/C][/ROW]
[ROW][C]60[/C][C]1.67[/C][C]0.320717845745634[/C][/ROW]
[ROW][C]61[/C][C]1.75[/C][C]0.336734693877551[/C][/ROW]
[ROW][C]62[/C][C]1.77[/C][C]0.340403460052986[/C][/ROW]
[ROW][C]63[/C][C]1.93[/C][C]0.365768208542511[/C][/ROW]
[ROW][C]64[/C][C]1.77[/C][C]0.340403460052986[/C][/ROW]
[ROW][C]65[/C][C]1.82[/C][C]0.349052046854245[/C][/ROW]
[ROW][C]66[/C][C]1.97[/C][C]0.371163905279703[/C][/ROW]
[ROW][C]67[/C][C]1.89[/C][C]0.36002631505277[/C][/ROW]
[ROW][C]68[/C][C]1.74[/C][C]0.33485268859823[/C][/ROW]
[ROW][C]69[/C][C]1.82[/C][C]0.349052046854245[/C][/ROW]
[ROW][C]70[/C][C]1.69[/C][C]0.324936101677112[/C][/ROW]
[ROW][C]71[/C][C]1.81[/C][C]0.347379506120082[/C][/ROW]
[ROW][C]72[/C][C]1.91[/C][C]0.362942353553905[/C][/ROW]
[/TABLE]
Source: https://freestatistics.org/blog/index.php?pk=319064&T=2

Globally Unique Identifier (entire table): ba.freestatistics.org/blog/index.php?pk=319064&T=2

As an alternative you can also use a QR Code:  

The GUIDs for individual cells are displayed in the table below:

Obs.OriginalTransformed
11.630.311810756897136
21.640.314098750743605
31.580.299711584681942
41.980.372461993674115
52.250.401234567901235
61.460.265434415462563
71.840.352315689981096
82.030.378667281419107
92.190.395748629094473
101.670.320717845745634
111.430.255489265978776
121.470.268614928964783
131.910.362942353553905
141.910.362942353553905
1520.375
161.730.332937953155802
171.910.362942353553905
181.890.36002631505277
191.530.28640693750267
201.650.316345270890725
211.510.280711372308232
223.250.452662721893491
231.870.357016214361291
241.550.291883454734651
251.640.314098750743605
261.560.294543063773833
271.680.322845804988662
281.730.332937953155802
292.070.3833111624542
302.240.400350765306122
311.910.362942353553905
321.720.33098972417523
332.030.378667281419107
341.50.277777777777778
351.610.307106207322248
361.760.338584710743802
371.790.343949939140476
381.760.338584710743802
391.750.336734693877551
401.90.361495844875346
411.930.365768208542511
421.920.364366319444444
431.910.362942353553905
441.710.329007215895489
451.690.324936101677112
461.640.314098750743605
471.70.326989619377163
481.620.309480262155159
491.640.314098750743605
501.620.309480262155159
511.620.309480262155159
522.120.38875044499822
531.780.342191642469385
541.990.373740562107018
551.90.361495844875346
561.640.314098750743605
571.940.367148474864491
581.840.352315689981096
591.60.3046875
601.670.320717845745634
611.750.336734693877551
621.770.340403460052986
631.930.365768208542511
641.770.340403460052986
651.820.349052046854245
661.970.371163905279703
671.890.36002631505277
681.740.33485268859823
691.820.349052046854245
701.690.324936101677112
711.810.347379506120082
721.910.362942353553905


Maximum Likelihood Estimation of Lambda
> summary(mypT)
bcPower Transformation to Normality 
  Est Power Rounded Pwr Wald Lwr Bnd Wald Upr Bnd
x   -2.2888          -1      -3.6827      -0.8949
Likelihood ratio test that transformation parameter is equal to 0
 (log transformation)
                           LRT df       pval
LR test, lambda = (0) 13.46643  1 0.00024287
Likelihood ratio test that no transformation is needed
                           LRT df       pval
LR test, lambda = (1) 31.30519  1 2.2049e-08

\begin{tabular}{lllllllll}
\hline
Maximum Likelihood Estimation of Lambda \tabularnewline
> summary(mypT)
bcPower Transformation to Normality 
  Est Power Rounded Pwr Wald Lwr Bnd Wald Upr Bnd
x   -2.2888          -1      -3.6827      -0.8949
Likelihood ratio test that transformation parameter is equal to 0
 (log transformation)
                           LRT df       pval
LR test, lambda = (0) 13.46643  1 0.00024287
Likelihood ratio test that no transformation is needed
                           LRT df       pval
LR test, lambda = (1) 31.30519  1 2.2049e-08
\tabularnewline \hline \end{tabular} %Source: https://freestatistics.org/blog/index.php?pk=319064&T=3

[TABLE]
[ROW][C]Maximum Likelihood Estimation of Lambda[/C][/ROW]
[ROW][C]
> summary(mypT)
bcPower Transformation to Normality 
  Est Power Rounded Pwr Wald Lwr Bnd Wald Upr Bnd
x   -2.2888          -1      -3.6827      -0.8949
Likelihood ratio test that transformation parameter is equal to 0
 (log transformation)
                           LRT df       pval
LR test, lambda = (0) 13.46643  1 0.00024287
Likelihood ratio test that no transformation is needed
                           LRT df       pval
LR test, lambda = (1) 31.30519  1 2.2049e-08
[/C][/ROW] [/TABLE] Source: https://freestatistics.org/blog/index.php?pk=319064&T=3

Globally Unique Identifier (entire table): ba.freestatistics.org/blog/index.php?pk=319064&T=3

As an alternative you can also use a QR Code:  

The GUIDs for individual cells are displayed in the table below:

Maximum Likelihood Estimation of Lambda
> summary(mypT)
bcPower Transformation to Normality 
  Est Power Rounded Pwr Wald Lwr Bnd Wald Upr Bnd
x   -2.2888          -1      -3.6827      -0.8949
Likelihood ratio test that transformation parameter is equal to 0
 (log transformation)
                           LRT df       pval
LR test, lambda = (0) 13.46643  1 0.00024287
Likelihood ratio test that no transformation is needed
                           LRT df       pval
LR test, lambda = (1) 31.30519  1 2.2049e-08


Parameters (Session):
par1 = Full Box-Cox transform ; par2 = -2 ; par3 = 2 ; par4 = 1 ; par5 = Yes ;
Parameters (R input):
par1 = Full Box-Cox transform ; par2 = -2 ; par3 = 2 ; par4 = 1 ; par5 = Yes ;
R code (references can be found in the software module):
par5 <- 'Yes'
par4 <- '1'
par3 <- '2'
par2 <- '-2'
par1 <- 'Full Box-Cox transform'
library(car)
par2 <- abs(as.numeric(par2)*100)
par3 <- as.numeric(par3)*100
if(par4=='') par4 <- 0
par4 <- as.numeric(par4)
numlam <- par2 + par3 + 1
x <- x + par4
n <- length(x)
c <- array(NA,dim=c(numlam))
l <- array(NA,dim=c(numlam))
mx <- -1
mxli <- -999
for (i in 1:numlam)
{
l[i] <- (i-par2-1)/100
if (l[i] != 0)
{
if (par1 == 'Full Box-Cox transform') x1 <- (x^l[i] - 1) / l[i]
if (par1 == 'Simple Box-Cox transform') x1 <- x^l[i]
} else {
x1 <- log(x)
}
c[i] <- cor(qnorm(ppoints(x), mean=0, sd=1),sort(x1))
if (mx < c[i])
{
mx <- c[i]
mxli <- l[i]
x1.best <- x1
}
}
print(c)
print(mx)
print(mxli)
print(x1.best)
if (mxli != 0)
{
if (par1 == 'Full Box-Cox transform') x1 <- (x^mxli - 1) / mxli
if (par1 == 'Simple Box-Cox transform') x1 <- x^mxli
} else {
x1 <- log(x)
}
mypT <- powerTransform(x)
summary(mypT)
bitmap(file='test1.png')
plot(l,c,main='Box-Cox Normality Plot', xlab='Lambda',ylab='correlation')
mtext(paste('Optimal Lambda =',mxli))
grid()
dev.off()
bitmap(file='test2.png')
hist(x,main='Histogram of Original Data',xlab='X',ylab='frequency')
grid()
dev.off()
bitmap(file='test3.png')
hist(x1,main='Histogram of Transformed Data', xlab='X',ylab='frequency')
grid()
dev.off()
bitmap(file='test4.png')
qqPlot(x)
grid()
mtext('Original Data')
dev.off()
bitmap(file='test5.png')
qqPlot(x1)
grid()
mtext('Transformed Data')
dev.off()
load(file='createtable')
a<-table.start()
a<-table.row.start(a)
a<-table.element(a,'Box-Cox Normality Plot',2,TRUE)
a<-table.row.end(a)
a<-table.row.start(a)
a<-table.element(a,'# observations x',header=TRUE)
a<-table.element(a,n)
a<-table.row.end(a)
a<-table.row.start(a)
a<-table.element(a,'maximum correlation',header=TRUE)
a<-table.element(a,mx)
a<-table.row.end(a)
a<-table.row.start(a)
a<-table.element(a,'optimal lambda',header=TRUE)
a<-table.element(a,mxli)
a<-table.row.end(a)
a<-table.row.start(a)
a<-table.element(a,'transformation formula',header=TRUE)
if (par1 == 'Full Box-Cox transform') {
a<-table.element(a,'for all lambda <> 0 : T(Y) = (Y^lambda - 1) / lambda')
} else {
a<-table.element(a,'for all lambda <> 0 : T(Y) = Y^lambda')
}
a<-table.row.end(a)
if(mx<0) {
a<-table.row.start(a)
a<-table.element(a,'Warning: maximum correlation is negative! The Box-Cox transformation must not be used.',2)
a<-table.row.end(a)
}
a<-table.end(a)
table.save(a,file='mytable.tab')
if(par5=='Yes') {
a<-table.start()
a<-table.row.start(a)
a<-table.element(a,'Obs.',header=T)
a<-table.element(a,'Original',header=T)
a<-table.element(a,'Transformed',header=T)
a<-table.row.end(a)
for (i in 1:n) {
a<-table.row.start(a)
a<-table.element(a,i)
a<-table.element(a,x[i])
a<-table.element(a,x1.best[i])
a<-table.row.end(a)
}
a<-table.end(a)
table.save(a,file='mytable1.tab')
}
a<-table.start()
a<-table.row.start(a)
a<-table.element(a,'Maximum Likelihood Estimation of Lambda',1,TRUE)
a<-table.row.end(a)
a<-table.row.start(a)
a<-table.element(a,paste('
',RC.texteval('summary(mypT)'),'
',sep=''))
a<-table.row.end(a)
a<-table.end(a)
table.save(a,file='mytable3.tab')