Free Statistics

of Irreproducible Research!

Author's title

Author*Unverified author*
R Software Modulerwasp_exponentialsmoothing.wasp
Title produced by softwareExponential Smoothing
Date of computationTue, 17 Nov 2020 04:32:12 +0100
Cite this page as followsStatistical Computations at FreeStatistics.org, Office for Research Development and Education, URL https://freestatistics.org/blog/index.php?v=date/2020/Nov/17/t1605584476ym8swgbhz0utuof.htm/, Retrieved Tue, 23 Apr 2024 15:08:59 +0200
Statistical Computations at FreeStatistics.org, Office for Research Development and Education, URL https://freestatistics.org/blog/index.php?pk=, Retrieved Tue, 23 Apr 2024 15:08:59 +0200
QR Codes:

Original text written by user:
IsPrivate?This computation is private
User-defined keywords
Estimated Impact0
Dataseries X:
0.98
50.93
46.86
9.03
26.03
12.77
48.55
33.86
44.24
37.25
66.42
58.36
38.56
30.61
92.07
36.82
63.12
54.14
43.82
43.48
61.24
39.03
72.94
54.44


Summary of computational transaction
Raw Input view raw input (R code)
Raw Outputview raw output of R engine
Computing time1 seconds
R ServerBig Analytics Cloud Computing Center

\begin{tabular}{lllllllll}
\hline
Summary of computational transaction \tabularnewline
Raw Input view raw input (R code)  \tabularnewline
Raw Outputview raw output of R engine  \tabularnewline
Computing time1 seconds \tabularnewline
R ServerBig Analytics Cloud Computing Center \tabularnewline
\hline
\end{tabular}
%Source: https://freestatistics.org/blog/index.php?pk=&T=0

[TABLE]
[ROW]
Summary of computational transaction[/C][/ROW] [ROW]Raw Input[/C] view raw input (R code) [/C][/ROW] [ROW]Raw Output[/C]view raw output of R engine [/C][/ROW] [ROW]Computing time[/C]1 seconds[/C][/ROW] [ROW]R Server[/C]Big Analytics Cloud Computing Center[/C][/ROW] [/TABLE] Source: https://freestatistics.org/blog/index.php?pk=&T=0

Globally Unique Identifier (entire table): ba.freestatistics.org/blog/index.php?pk=&T=0

As an alternative you can also use a QR Code:  

The GUIDs for individual cells are displayed in the table below:

Summary of computational transaction
Raw Input view raw input (R code)
Raw Outputview raw output of R engine
Computing time1 seconds
R ServerBig Analytics Cloud Computing Center


Estimated Parameters of Exponential Smoothing
ParameterValue
alpha0
beta0
gamma0

\begin{tabular}{lllllllll}
\hline
Estimated Parameters of Exponential Smoothing \tabularnewline
Parameter & Value \tabularnewline
alpha & 0 \tabularnewline
beta & 0 \tabularnewline
gamma & 0 \tabularnewline
\hline
\end{tabular}
%Source: https://freestatistics.org/blog/index.php?pk=&T=1

[TABLE]
[ROW][C]Estimated Parameters of Exponential Smoothing[/C][/ROW]
[ROW][C]Parameter[/C][C]Value[/C][/ROW]
[ROW][C]alpha[/C][C]0[/C][/ROW]
[ROW][C]beta[/C][C]0[/C][/ROW]
[ROW][C]gamma[/C][C]0[/C][/ROW]
[/TABLE]
Source: https://freestatistics.org/blog/index.php?pk=&T=1

Globally Unique Identifier (entire table): ba.freestatistics.org/blog/index.php?pk=&T=1

As an alternative you can also use a QR Code:  

The GUIDs for individual cells are displayed in the table below:

Estimated Parameters of Exponential Smoothing
ParameterValue
alpha0
beta0
gamma0


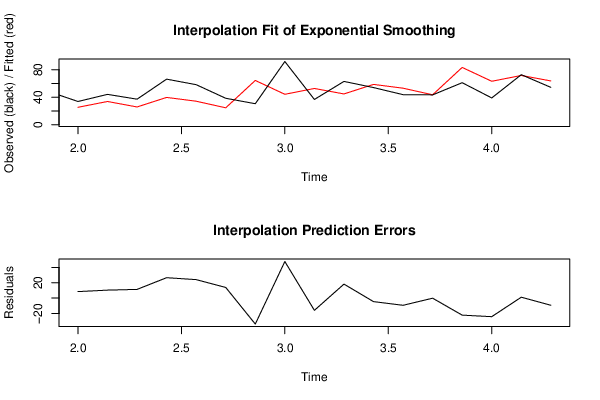
Interpolation Forecasts of Exponential Smoothing
tObservedFittedResiduals
833.8625.39443877551028.46556122448982
944.2433.864744897959210.3752551020408
1037.2525.899336734693911.3506632653061
1166.4239.799642857142826.6203571428572
1258.3634.269948979591824.0900510204082
1338.5624.674540816326513.8854591836735
1430.6164.5362755102041-33.9262755102041
1592.0744.35658163265347.713418367347
1636.8252.826887755102-16.006887755102
1763.1244.861479591836718.2585204081633
1854.1458.7617857142857-4.62178571428569
1943.8253.2320918367347-9.41209183673467
2043.4843.6366836734694-0.156683673469367
2161.2483.4984183673469-22.2584183673469
2239.0363.3187244897959-24.2887244897959
2372.9471.78903061224491.15096938775511
2454.4463.8236224489796-9.38362244897958

\begin{tabular}{lllllllll}
\hline
Interpolation Forecasts of Exponential Smoothing \tabularnewline
t & Observed & Fitted & Residuals \tabularnewline
8 & 33.86 & 25.3944387755102 & 8.46556122448982 \tabularnewline
9 & 44.24 & 33.8647448979592 & 10.3752551020408 \tabularnewline
10 & 37.25 & 25.8993367346939 & 11.3506632653061 \tabularnewline
11 & 66.42 & 39.7996428571428 & 26.6203571428572 \tabularnewline
12 & 58.36 & 34.2699489795918 & 24.0900510204082 \tabularnewline
13 & 38.56 & 24.6745408163265 & 13.8854591836735 \tabularnewline
14 & 30.61 & 64.5362755102041 & -33.9262755102041 \tabularnewline
15 & 92.07 & 44.356581632653 & 47.713418367347 \tabularnewline
16 & 36.82 & 52.826887755102 & -16.006887755102 \tabularnewline
17 & 63.12 & 44.8614795918367 & 18.2585204081633 \tabularnewline
18 & 54.14 & 58.7617857142857 & -4.62178571428569 \tabularnewline
19 & 43.82 & 53.2320918367347 & -9.41209183673467 \tabularnewline
20 & 43.48 & 43.6366836734694 & -0.156683673469367 \tabularnewline
21 & 61.24 & 83.4984183673469 & -22.2584183673469 \tabularnewline
22 & 39.03 & 63.3187244897959 & -24.2887244897959 \tabularnewline
23 & 72.94 & 71.7890306122449 & 1.15096938775511 \tabularnewline
24 & 54.44 & 63.8236224489796 & -9.38362244897958 \tabularnewline
\hline
\end{tabular}
%Source: https://freestatistics.org/blog/index.php?pk=&T=2

[TABLE]
[ROW][C]Interpolation Forecasts of Exponential Smoothing[/C][/ROW]
[ROW][C]t[/C][C]Observed[/C][C]Fitted[/C][C]Residuals[/C][/ROW]
[ROW][C]8[/C][C]33.86[/C][C]25.3944387755102[/C][C]8.46556122448982[/C][/ROW]
[ROW][C]9[/C][C]44.24[/C][C]33.8647448979592[/C][C]10.3752551020408[/C][/ROW]
[ROW][C]10[/C][C]37.25[/C][C]25.8993367346939[/C][C]11.3506632653061[/C][/ROW]
[ROW][C]11[/C][C]66.42[/C][C]39.7996428571428[/C][C]26.6203571428572[/C][/ROW]
[ROW][C]12[/C][C]58.36[/C][C]34.2699489795918[/C][C]24.0900510204082[/C][/ROW]
[ROW][C]13[/C][C]38.56[/C][C]24.6745408163265[/C][C]13.8854591836735[/C][/ROW]
[ROW][C]14[/C][C]30.61[/C][C]64.5362755102041[/C][C]-33.9262755102041[/C][/ROW]
[ROW][C]15[/C][C]92.07[/C][C]44.356581632653[/C][C]47.713418367347[/C][/ROW]
[ROW][C]16[/C][C]36.82[/C][C]52.826887755102[/C][C]-16.006887755102[/C][/ROW]
[ROW][C]17[/C][C]63.12[/C][C]44.8614795918367[/C][C]18.2585204081633[/C][/ROW]
[ROW][C]18[/C][C]54.14[/C][C]58.7617857142857[/C][C]-4.62178571428569[/C][/ROW]
[ROW][C]19[/C][C]43.82[/C][C]53.2320918367347[/C][C]-9.41209183673467[/C][/ROW]
[ROW][C]20[/C][C]43.48[/C][C]43.6366836734694[/C][C]-0.156683673469367[/C][/ROW]
[ROW][C]21[/C][C]61.24[/C][C]83.4984183673469[/C][C]-22.2584183673469[/C][/ROW]
[ROW][C]22[/C][C]39.03[/C][C]63.3187244897959[/C][C]-24.2887244897959[/C][/ROW]
[ROW][C]23[/C][C]72.94[/C][C]71.7890306122449[/C][C]1.15096938775511[/C][/ROW]
[ROW][C]24[/C][C]54.44[/C][C]63.8236224489796[/C][C]-9.38362244897958[/C][/ROW]
[/TABLE]
Source: https://freestatistics.org/blog/index.php?pk=&T=2

Globally Unique Identifier (entire table): ba.freestatistics.org/blog/index.php?pk=&T=2

As an alternative you can also use a QR Code:  

The GUIDs for individual cells are displayed in the table below:

Interpolation Forecasts of Exponential Smoothing
tObservedFittedResiduals
833.8625.39443877551028.46556122448982
944.2433.864744897959210.3752551020408
1037.2525.899336734693911.3506632653061
1166.4239.799642857142826.6203571428572
1258.3634.269948979591824.0900510204082
1338.5624.674540816326513.8854591836735
1430.6164.5362755102041-33.9262755102041
1592.0744.35658163265347.713418367347
1636.8252.826887755102-16.006887755102
1763.1244.861479591836718.2585204081633
1854.1458.7617857142857-4.62178571428569
1943.8253.2320918367347-9.41209183673467
2043.4843.6366836734694-0.156683673469367
2161.2483.4984183673469-22.2584183673469
2239.0363.3187244897959-24.2887244897959
2372.9471.78903061224491.15096938775511
2454.4463.8236224489796-9.38362244897958


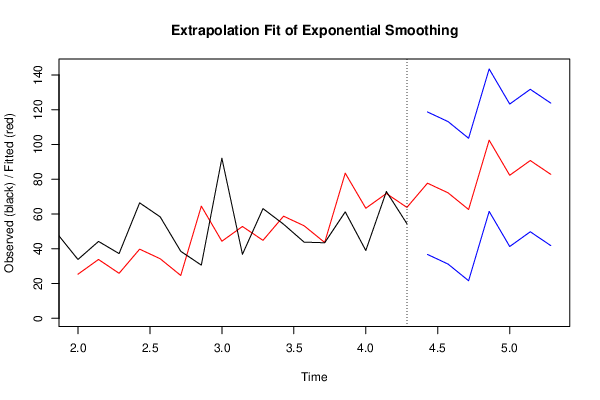
Extrapolation Forecasts of Exponential Smoothing
tForecast95% Lower Bound95% Upper Bound
2577.723928571428636.7612622894819118.686594853375
2672.194234693877531.2315684119309113.156900975824
2762.598826530612221.6361602486656103.561492812559
28102.4605612244961.4978949425432143.423227506436
2982.280867346938841.3182010649921123.243533628885
3090.751173469387849.7885071874411131.713839751334
3182.785765306122441.8230990241758123.748431588069

\begin{tabular}{lllllllll}
\hline
Extrapolation Forecasts of Exponential Smoothing \tabularnewline
t & Forecast & 95% Lower Bound & 95% Upper Bound \tabularnewline
25 & 77.7239285714286 & 36.7612622894819 & 118.686594853375 \tabularnewline
26 & 72.1942346938775 & 31.2315684119309 & 113.156900975824 \tabularnewline
27 & 62.5988265306122 & 21.6361602486656 & 103.561492812559 \tabularnewline
28 & 102.46056122449 & 61.4978949425432 & 143.423227506436 \tabularnewline
29 & 82.2808673469388 & 41.3182010649921 & 123.243533628885 \tabularnewline
30 & 90.7511734693878 & 49.7885071874411 & 131.713839751334 \tabularnewline
31 & 82.7857653061224 & 41.8230990241758 & 123.748431588069 \tabularnewline
\hline
\end{tabular}
%Source: https://freestatistics.org/blog/index.php?pk=&T=3

[TABLE]
[ROW][C]Extrapolation Forecasts of Exponential Smoothing[/C][/ROW]
[ROW][C]t[/C][C]Forecast[/C][C]95% Lower Bound[/C][C]95% Upper Bound[/C][/ROW]
[ROW][C]25[/C][C]77.7239285714286[/C][C]36.7612622894819[/C][C]118.686594853375[/C][/ROW]
[ROW][C]26[/C][C]72.1942346938775[/C][C]31.2315684119309[/C][C]113.156900975824[/C][/ROW]
[ROW][C]27[/C][C]62.5988265306122[/C][C]21.6361602486656[/C][C]103.561492812559[/C][/ROW]
[ROW][C]28[/C][C]102.46056122449[/C][C]61.4978949425432[/C][C]143.423227506436[/C][/ROW]
[ROW][C]29[/C][C]82.2808673469388[/C][C]41.3182010649921[/C][C]123.243533628885[/C][/ROW]
[ROW][C]30[/C][C]90.7511734693878[/C][C]49.7885071874411[/C][C]131.713839751334[/C][/ROW]
[ROW][C]31[/C][C]82.7857653061224[/C][C]41.8230990241758[/C][C]123.748431588069[/C][/ROW]
[/TABLE]
Source: https://freestatistics.org/blog/index.php?pk=&T=3

Globally Unique Identifier (entire table): ba.freestatistics.org/blog/index.php?pk=&T=3

As an alternative you can also use a QR Code:  

The GUIDs for individual cells are displayed in the table below:

Extrapolation Forecasts of Exponential Smoothing
tForecast95% Lower Bound95% Upper Bound
2577.723928571428636.7612622894819118.686594853375
2672.194234693877531.2315684119309113.156900975824
2762.598826530612221.6361602486656103.561492812559
28102.4605612244961.4978949425432143.423227506436
2982.280867346938841.3182010649921123.243533628885
3090.751173469387849.7885071874411131.713839751334
3182.785765306122441.8230990241758123.748431588069


Parameters (Session):
par1 = 7 ; par2 = Triple ; par3 = additive ; par4 = 7 ;
Parameters (R input):
par1 = 7 ; par2 = Triple ; par3 = additive ; par4 = 7 ;
R code (references can be found in the software module):
par4 <- '7'
par3 <- 'additive'
par2 <- 'Triple'
par1 <- '7'
par1 <- as.numeric(par1)
par4 <- as.numeric(par4)
if (par2 == 'Single') K <- 1
if (par2 == 'Double') K <- 2
if (par2 == 'Triple') K <- par1
nx <- length(x)
nxmK <- nx - K
x <- ts(x, frequency = par1)
if (par2 == 'Single') fit <- HoltWinters(x, gamma=F, beta=F)
if (par2 == 'Double') fit <- HoltWinters(x, gamma=F)
if (par2 == 'Triple') fit <- HoltWinters(x, seasonal=par3)
fit
myresid <- x - fit$fitted[,'xhat']
bitmap(file='test1.png')
op <- par(mfrow=c(2,1))
plot(fit,ylab='Observed (black) / Fitted (red)',main='Interpolation Fit of Exponential Smoothing')
plot(myresid,ylab='Residuals',main='Interpolation Prediction Errors')
par(op)
dev.off()
bitmap(file='test2.png')
p <- predict(fit, par4, prediction.interval=TRUE)
np <- length(p[,1])
plot(fit,p,ylab='Observed (black) / Fitted (red)',main='Extrapolation Fit of Exponential Smoothing')
dev.off()
bitmap(file='test3.png')
op <- par(mfrow = c(2,2))
acf(as.numeric(myresid),lag.max = nx/2,main='Residual ACF')
spectrum(myresid,main='Residals Periodogram')
cpgram(myresid,main='Residal Cumulative Periodogram')
qqnorm(myresid,main='Residual Normal QQ Plot')
qqline(myresid)
par(op)
dev.off()
load(file='createtable')
a<-table.start()
a<-table.row.start(a)
a<-table.element(a,'Estimated Parameters of Exponential Smoothing',2,TRUE)
a<-table.row.end(a)
a<-table.row.start(a)
a<-table.element(a,'Parameter',header=TRUE)
a<-table.element(a,'Value',header=TRUE)
a<-table.row.end(a)
a<-table.row.start(a)
a<-table.element(a,'alpha',header=TRUE)
a<-table.element(a,fit$alpha)
a<-table.row.end(a)
a<-table.row.start(a)
a<-table.element(a,'beta',header=TRUE)
a<-table.element(a,fit$beta)
a<-table.row.end(a)
a<-table.row.start(a)
a<-table.element(a,'gamma',header=TRUE)
a<-table.element(a,fit$gamma)
a<-table.row.end(a)
a<-table.end(a)
table.save(a,file='mytable.tab')
a<-table.start()
a<-table.row.start(a)
a<-table.element(a,'Interpolation Forecasts of Exponential Smoothing',4,TRUE)
a<-table.row.end(a)
a<-table.row.start(a)
a<-table.element(a,'t',header=TRUE)
a<-table.element(a,'Observed',header=TRUE)
a<-table.element(a,'Fitted',header=TRUE)
a<-table.element(a,'Residuals',header=TRUE)
a<-table.row.end(a)
for (i in 1:nxmK) {
a<-table.row.start(a)
a<-table.element(a,i+K,header=TRUE)
a<-table.element(a,x[i+K])
a<-table.element(a,fit$fitted[i,'xhat'])
a<-table.element(a,myresid[i])
a<-table.row.end(a)
}
a<-table.end(a)
table.save(a,file='mytable1.tab')
a<-table.start()
a<-table.row.start(a)
a<-table.element(a,'Extrapolation Forecasts of Exponential Smoothing',4,TRUE)
a<-table.row.end(a)
a<-table.row.start(a)
a<-table.element(a,'t',header=TRUE)
a<-table.element(a,'Forecast',header=TRUE)
a<-table.element(a,'95% Lower Bound',header=TRUE)
a<-table.element(a,'95% Upper Bound',header=TRUE)
a<-table.row.end(a)
for (i in 1:np) {
a<-table.row.start(a)
a<-table.element(a,nx+i,header=TRUE)
a<-table.element(a,p[i,'fit'])
a<-table.element(a,p[i,'lwr'])
a<-table.element(a,p[i,'upr'])
a<-table.row.end(a)
}
a<-table.end(a)
table.save(a,file='mytable2.tab')