Free Statistics

of Irreproducible Research!

Author's title

Author*Unverified author*
R Software Modulerwasp_fitdistrweibull.wasp
Title produced by softwareMaximum-likelihood Fitting - Weibull Distribution
Date of computationWed, 21 Jul 2021 03:16:14 +0200
Cite this page as followsStatistical Computations at FreeStatistics.org, Office for Research Development and Education, URL https://freestatistics.org/blog/index.php?v=date/2021/Jul/21/t1626830285n8wro19uqmg3yuy.htm/, Retrieved Mon, 29 Apr 2024 12:45:11 +0000
Statistical Computations at FreeStatistics.org, Office for Research Development and Education, URL https://freestatistics.org/blog/index.php?pk=319482, Retrieved Mon, 29 Apr 2024 12:45:11 +0000
QR Codes:

Original text written by user:
IsPrivate?No (this computation is public)
User-defined keywords
Estimated Impact96
Family? (F = Feedback message, R = changed R code, M = changed R Module, P = changed Parameters, D = changed Data)
-       [Maximum-likelihood Fitting - Weibull Distribution] [Strut] [2021-07-21 01:16:14] [d41d8cd98f00b204e9800998ecf8427e] [Current]
Feedback Forum

Post a new message
Dataseries X:
20416
15100
13500
19900
23760
20000
20000
12858
20000
18560
16590
16240
26919
27700
20124
24152
23921
25513
25761
14813
23701
23701
23100
19508
24270
21960
21500
21500
17000
20826
20844
21060
17010
17342
17342
15957
19600
19600
17493
17800
19400
19400
15400
18900
18900
16580
16580
17800
18000
18520


Summary of computational transaction
Raw Input view raw input (R code)
Raw Outputview raw output of R engine
Computing time1 seconds
R ServerBig Analytics Cloud Computing Center

\begin{tabular}{lllllllll}
\hline
Summary of computational transaction \tabularnewline
Raw Input view raw input (R code)  \tabularnewline
Raw Outputview raw output of R engine  \tabularnewline
Computing time1 seconds \tabularnewline
R ServerBig Analytics Cloud Computing Center \tabularnewline
\hline
\end{tabular}
%Source: https://freestatistics.org/blog/index.php?pk=319482&T=0

[TABLE]
[ROW]
Summary of computational transaction[/C][/ROW] [ROW]Raw Input[/C] view raw input (R code) [/C][/ROW] [ROW]Raw Output[/C]view raw output of R engine [/C][/ROW] [ROW]Computing time[/C]1 seconds[/C][/ROW] [ROW]R Server[/C]Big Analytics Cloud Computing Center[/C][/ROW] [/TABLE] Source: https://freestatistics.org/blog/index.php?pk=319482&T=0

Globally Unique Identifier (entire table): ba.freestatistics.org/blog/index.php?pk=319482&T=0

As an alternative you can also use a QR Code:  

The GUIDs for individual cells are displayed in the table below:

Summary of computational transaction
Raw Input view raw input (R code)
Raw Outputview raw output of R engine
Computing time1 seconds
R ServerBig Analytics Cloud Computing Center


ParameterEstimated ValueStandard Deviation
shape6.13955573614240.646509071010322
scale21116.7695607106515.498526614017

\begin{tabular}{lllllllll}
\hline
Parameter & Estimated Value & Standard Deviation \tabularnewline
shape & 6.1395557361424 & 0.646509071010322 \tabularnewline
scale & 21116.7695607106 & 515.498526614017 \tabularnewline
\hline
\end{tabular}
%Source: https://freestatistics.org/blog/index.php?pk=319482&T=1

[TABLE]
[ROW][C]Parameter[/C][C]Estimated Value[/C][C]Standard Deviation[/C][/ROW]
[ROW][C]shape[/C][C]6.1395557361424[/C][C]0.646509071010322[/C][/ROW]
[ROW][C]scale[/C][C]21116.7695607106[/C][C]515.498526614017[/C][/ROW]
[/TABLE]
Source: https://freestatistics.org/blog/index.php?pk=319482&T=1

Globally Unique Identifier (entire table): ba.freestatistics.org/blog/index.php?pk=319482&T=1

As an alternative you can also use a QR Code:  

The GUIDs for individual cells are displayed in the table below:

ParameterEstimated ValueStandard Deviation
shape6.13955573614240.646509071010322
scale21116.7695607106515.498526614017


Parameters (Session):
par1 = 1 ; par2 = 90 ;
Parameters (R input):
par1 = 1 ; par2 = 90 ;
R code (references can be found in the software module):
par2 <- '90'
par1 <- '1'
library(MASS)
PPCCWeibull <- function(shape, scale, x)
{
x <- sort(x)
pp <- ppoints(x)
cor(qweibull(pp, shape=shape, scale=scale), x)
}
par1 <- as.numeric(par1)
par2 <- as.numeric(par2)
if (par1 < 0.1) par1 <- 0.1
if (par1 > 50) par1 <- 50
if (par2 < 0.1) par2 <- 0.1
if (par2 > 50) par2 <- 50
par1h <- par1*10
par2h <- par2*10
sortx <- sort(x)
c <- array(NA,dim=c(par2h))
for (i in par1h:par2h)
{
c[i] <- cor(qweibull(ppoints(x), shape=i/10,scale=2),sortx)
}
bitmap(file='test1.png')
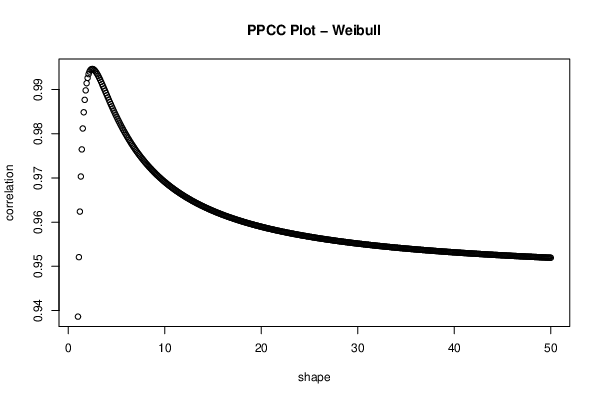
plot((par1h:par2h)/10,c[par1h:par2h],xlab='shape',ylab='correlation',main='PPCC Plot - Weibull')
dev.off()
f<-fitdistr(x, 'weibull')
f$estimate
f$sd
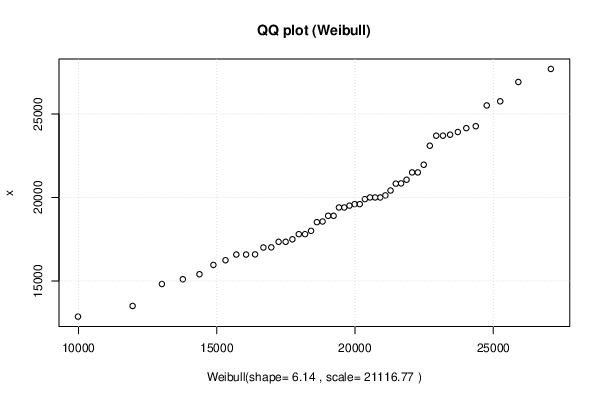
xlab <- paste('Weibull(shape=',round(f$estimate[[1]],2))
xlab <- paste(xlab,', scale=')
xlab <- paste(xlab,round(f$estimate[[2]],2))
xlab <- paste(xlab,')')
bitmap(file='test2.png')
qqplot(qweibull(ppoints(x), shape=f$estimate[[1]], scale=f$estimate[[2]]), x, main='QQ plot (Weibull)', xlab=xlab )
grid()
dev.off()
load(file='createtable')
a<-table.start()
a<-table.row.start(a)
a<-table.element(a,'Parameter',1,TRUE)
a<-table.element(a,'Estimated Value',1,TRUE)
a<-table.element(a,'Standard Deviation',1,TRUE)
a<-table.row.end(a)
a<-table.row.start(a)
a<-table.element(a,'shape',header=TRUE)
a<-table.element(a,f$estimate[1])
a<-table.element(a,f$sd[1])
a<-table.row.end(a)
a<-table.row.start(a)
a<-table.element(a,'scale',header=TRUE)
a<-table.element(a,f$estimate[2])
a<-table.element(a,f$sd[2])
a<-table.row.end(a)
a<-table.end(a)
table.save(a,file='mytable.tab')