Free Statistics

of Irreproducible Research!

Author's title

Author*The author of this computation has been verified*
R Software Modulerwasp_decompose.wasp
Title produced by softwareClassical Decomposition
Date of computationThu, 30 Sep 2021 12:22:41 +0200
Cite this page as followsStatistical Computations at FreeStatistics.org, Office for Research Development and Education, URL https://freestatistics.org/blog/index.php?v=date/2021/Sep/30/t16329976820r4yluvo02qlkgq.htm/, Retrieved Mon, 29 Apr 2024 16:01:25 +0200
Statistical Computations at FreeStatistics.org, Office for Research Development and Education, URL https://freestatistics.org/blog/index.php?pk=, Retrieved Mon, 29 Apr 2024 16:01:25 +0200
QR Codes:

Original text written by user:24 monthly hypothetical hospital admission rates are analysed to demonstrate seasonality and trends
IsPrivate?No (this computation is public)
User-defined keywordssample time series, hypothetical dataset
Estimated Impact0
Dataseries X:
1500
2500
3500
2500
1500
1400
1359
1409
1500
1600
1500
1540
1500
2500
3535
2550
1510
1400
1450
1400
1480
1630
1510
1510


Summary of computational transaction
Raw Input view raw input (R code)
Raw Outputview raw output of R engine
Computing time1 seconds
R ServerBig Analytics Cloud Computing Center

\begin{tabular}{lllllllll}
\hline
Summary of computational transaction \tabularnewline
Raw Input view raw input (R code)  \tabularnewline
Raw Outputview raw output of R engine  \tabularnewline
Computing time1 seconds \tabularnewline
R ServerBig Analytics Cloud Computing Center \tabularnewline
\hline
\end{tabular}
%Source: https://freestatistics.org/blog/index.php?pk=&T=0

[TABLE]
[ROW]
Summary of computational transaction[/C][/ROW] [ROW]Raw Input[/C] view raw input (R code) [/C][/ROW] [ROW]Raw Output[/C]view raw output of R engine [/C][/ROW] [ROW]Computing time[/C]1 seconds[/C][/ROW] [ROW]R Server[/C]Big Analytics Cloud Computing Center[/C][/ROW] [/TABLE] Source: https://freestatistics.org/blog/index.php?pk=&T=0

Globally Unique Identifier (entire table): ba.freestatistics.org/blog/index.php?pk=&T=0

As an alternative you can also use a QR Code:  

The GUIDs for individual cells are displayed in the table below:

Summary of computational transaction
Raw Input view raw input (R code)
Raw Outputview raw output of R engine
Computing time1 seconds
R ServerBig Analytics Cloud Computing Center


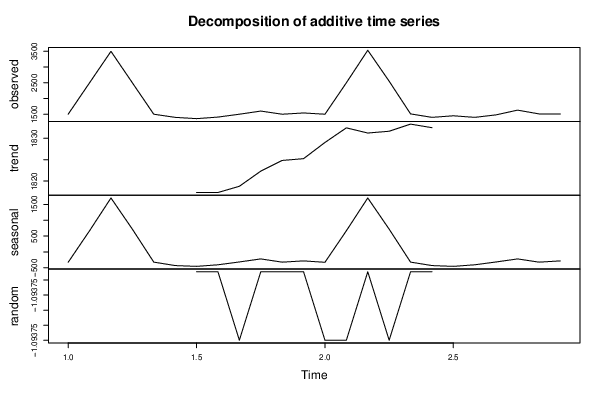
Classical Decomposition by Moving Averages
tObservationsFitTrendSeasonalRandom
11500NANA-327.948NA
22500NANA668.635NA
33500NANA1704.84NA
42500NANA719.427NA
51500NANA-322.24NA
61400NANA-431.406NA
713591360.091817.33-457.24-1.09375
814091410.091817.33-407.24-1.09375
915001501.091818.79-317.698-1.09375
1016001601.091822.33-221.24-1.09375
1115001501.091824.83-323.74-1.09375
1215401541.091825.25-284.156-1.09375
1315001501.091829.04-327.948-1.09375
1425002501.091832.46668.635-1.09375
1535353536.091831.251704.84-1.09375
1625502551.091831.67719.427-1.09375
1715101511.091833.33-322.24-1.09375
1814001401.091832.5-431.406-1.09375
191450NANA-457.24NA
201400NANA-407.24NA
211480NANA-317.698NA
221630NANA-221.24NA
231510NANA-323.74NA
241510NANA-284.156NA

\begin{tabular}{lllllllll}
\hline
Classical Decomposition by Moving Averages \tabularnewline
t & Observations & Fit & Trend & Seasonal & Random \tabularnewline
1 & 1500 & NA & NA & -327.948 & NA \tabularnewline
2 & 2500 & NA & NA & 668.635 & NA \tabularnewline
3 & 3500 & NA & NA & 1704.84 & NA \tabularnewline
4 & 2500 & NA & NA & 719.427 & NA \tabularnewline
5 & 1500 & NA & NA & -322.24 & NA \tabularnewline
6 & 1400 & NA & NA & -431.406 & NA \tabularnewline
7 & 1359 & 1360.09 & 1817.33 & -457.24 & -1.09375 \tabularnewline
8 & 1409 & 1410.09 & 1817.33 & -407.24 & -1.09375 \tabularnewline
9 & 1500 & 1501.09 & 1818.79 & -317.698 & -1.09375 \tabularnewline
10 & 1600 & 1601.09 & 1822.33 & -221.24 & -1.09375 \tabularnewline
11 & 1500 & 1501.09 & 1824.83 & -323.74 & -1.09375 \tabularnewline
12 & 1540 & 1541.09 & 1825.25 & -284.156 & -1.09375 \tabularnewline
13 & 1500 & 1501.09 & 1829.04 & -327.948 & -1.09375 \tabularnewline
14 & 2500 & 2501.09 & 1832.46 & 668.635 & -1.09375 \tabularnewline
15 & 3535 & 3536.09 & 1831.25 & 1704.84 & -1.09375 \tabularnewline
16 & 2550 & 2551.09 & 1831.67 & 719.427 & -1.09375 \tabularnewline
17 & 1510 & 1511.09 & 1833.33 & -322.24 & -1.09375 \tabularnewline
18 & 1400 & 1401.09 & 1832.5 & -431.406 & -1.09375 \tabularnewline
19 & 1450 & NA & NA & -457.24 & NA \tabularnewline
20 & 1400 & NA & NA & -407.24 & NA \tabularnewline
21 & 1480 & NA & NA & -317.698 & NA \tabularnewline
22 & 1630 & NA & NA & -221.24 & NA \tabularnewline
23 & 1510 & NA & NA & -323.74 & NA \tabularnewline
24 & 1510 & NA & NA & -284.156 & NA \tabularnewline
\hline
\end{tabular}
%Source: https://freestatistics.org/blog/index.php?pk=&T=1

[TABLE]
[ROW][C]Classical Decomposition by Moving Averages[/C][/ROW]
[ROW][C]t[/C][C]Observations[/C][C]Fit[/C][C]Trend[/C][C]Seasonal[/C][C]Random[/C][/ROW]
[ROW][C]1[/C][C]1500[/C][C]NA[/C][C]NA[/C][C]-327.948[/C][C]NA[/C][/ROW]
[ROW][C]2[/C][C]2500[/C][C]NA[/C][C]NA[/C][C]668.635[/C][C]NA[/C][/ROW]
[ROW][C]3[/C][C]3500[/C][C]NA[/C][C]NA[/C][C]1704.84[/C][C]NA[/C][/ROW]
[ROW][C]4[/C][C]2500[/C][C]NA[/C][C]NA[/C][C]719.427[/C][C]NA[/C][/ROW]
[ROW][C]5[/C][C]1500[/C][C]NA[/C][C]NA[/C][C]-322.24[/C][C]NA[/C][/ROW]
[ROW][C]6[/C][C]1400[/C][C]NA[/C][C]NA[/C][C]-431.406[/C][C]NA[/C][/ROW]
[ROW][C]7[/C][C]1359[/C][C]1360.09[/C][C]1817.33[/C][C]-457.24[/C][C]-1.09375[/C][/ROW]
[ROW][C]8[/C][C]1409[/C][C]1410.09[/C][C]1817.33[/C][C]-407.24[/C][C]-1.09375[/C][/ROW]
[ROW][C]9[/C][C]1500[/C][C]1501.09[/C][C]1818.79[/C][C]-317.698[/C][C]-1.09375[/C][/ROW]
[ROW][C]10[/C][C]1600[/C][C]1601.09[/C][C]1822.33[/C][C]-221.24[/C][C]-1.09375[/C][/ROW]
[ROW][C]11[/C][C]1500[/C][C]1501.09[/C][C]1824.83[/C][C]-323.74[/C][C]-1.09375[/C][/ROW]
[ROW][C]12[/C][C]1540[/C][C]1541.09[/C][C]1825.25[/C][C]-284.156[/C][C]-1.09375[/C][/ROW]
[ROW][C]13[/C][C]1500[/C][C]1501.09[/C][C]1829.04[/C][C]-327.948[/C][C]-1.09375[/C][/ROW]
[ROW][C]14[/C][C]2500[/C][C]2501.09[/C][C]1832.46[/C][C]668.635[/C][C]-1.09375[/C][/ROW]
[ROW][C]15[/C][C]3535[/C][C]3536.09[/C][C]1831.25[/C][C]1704.84[/C][C]-1.09375[/C][/ROW]
[ROW][C]16[/C][C]2550[/C][C]2551.09[/C][C]1831.67[/C][C]719.427[/C][C]-1.09375[/C][/ROW]
[ROW][C]17[/C][C]1510[/C][C]1511.09[/C][C]1833.33[/C][C]-322.24[/C][C]-1.09375[/C][/ROW]
[ROW][C]18[/C][C]1400[/C][C]1401.09[/C][C]1832.5[/C][C]-431.406[/C][C]-1.09375[/C][/ROW]
[ROW][C]19[/C][C]1450[/C][C]NA[/C][C]NA[/C][C]-457.24[/C][C]NA[/C][/ROW]
[ROW][C]20[/C][C]1400[/C][C]NA[/C][C]NA[/C][C]-407.24[/C][C]NA[/C][/ROW]
[ROW][C]21[/C][C]1480[/C][C]NA[/C][C]NA[/C][C]-317.698[/C][C]NA[/C][/ROW]
[ROW][C]22[/C][C]1630[/C][C]NA[/C][C]NA[/C][C]-221.24[/C][C]NA[/C][/ROW]
[ROW][C]23[/C][C]1510[/C][C]NA[/C][C]NA[/C][C]-323.74[/C][C]NA[/C][/ROW]
[ROW][C]24[/C][C]1510[/C][C]NA[/C][C]NA[/C][C]-284.156[/C][C]NA[/C][/ROW]
[/TABLE]
Source: https://freestatistics.org/blog/index.php?pk=&T=1

Globally Unique Identifier (entire table): ba.freestatistics.org/blog/index.php?pk=&T=1

As an alternative you can also use a QR Code:  

The GUIDs for individual cells are displayed in the table below:

Classical Decomposition by Moving Averages
tObservationsFitTrendSeasonalRandom
11500NANA-327.948NA
22500NANA668.635NA
33500NANA1704.84NA
42500NANA719.427NA
51500NANA-322.24NA
61400NANA-431.406NA
713591360.091817.33-457.24-1.09375
814091410.091817.33-407.24-1.09375
915001501.091818.79-317.698-1.09375
1016001601.091822.33-221.24-1.09375
1115001501.091824.83-323.74-1.09375
1215401541.091825.25-284.156-1.09375
1315001501.091829.04-327.948-1.09375
1425002501.091832.46668.635-1.09375
1535353536.091831.251704.84-1.09375
1625502551.091831.67719.427-1.09375
1715101511.091833.33-322.24-1.09375
1814001401.091832.5-431.406-1.09375
191450NANA-457.24NA
201400NANA-407.24NA
211480NANA-317.698NA
221630NANA-221.24NA
231510NANA-323.74NA
241510NANA-284.156NA


Parameters (Session):
par1 = additive ; par2 = 12 ;
Parameters (R input):
par1 = additive ; par2 = 12 ;
R code (references can be found in the software module):
par2 <- as.numeric(par2)
x <- ts(x,freq=par2)
m <- decompose(x,type=par1)
m$figure
bitmap(file='test1.png')
plot(m)
dev.off()
mylagmax <- length(x)/2
bitmap(file='test2.png')
op <- par(mfrow = c(2,2))
acf(as.numeric(x),lag.max = mylagmax,main='Observed')
acf(as.numeric(m$trend),na.action=na.pass,lag.max = mylagmax,main='Trend')
acf(as.numeric(m$seasonal),na.action=na.pass,lag.max = mylagmax,main='Seasonal')
acf(as.numeric(m$random),na.action=na.pass,lag.max = mylagmax,main='Random')
par(op)
dev.off()
bitmap(file='test3.png')
op <- par(mfrow = c(2,2))
spectrum(as.numeric(x),main='Observed')
spectrum(as.numeric(m$trend[!is.na(m$trend)]),main='Trend')
spectrum(as.numeric(m$seasonal[!is.na(m$seasonal)]),main='Seasonal')
spectrum(as.numeric(m$random[!is.na(m$random)]),main='Random')
par(op)
dev.off()
bitmap(file='test4.png')
op <- par(mfrow = c(2,2))
cpgram(as.numeric(x),main='Observed')
cpgram(as.numeric(m$trend[!is.na(m$trend)]),main='Trend')
cpgram(as.numeric(m$seasonal[!is.na(m$seasonal)]),main='Seasonal')
cpgram(as.numeric(m$random[!is.na(m$random)]),main='Random')
par(op)
dev.off()
load(file='createtable')
a<-table.start()
a<-table.row.start(a)
a<-table.element(a,'Classical Decomposition by Moving Averages',6,TRUE)
a<-table.row.end(a)
a<-table.row.start(a)
a<-table.element(a,'t',header=TRUE)
a<-table.element(a,'Observations',header=TRUE)
a<-table.element(a,'Fit',header=TRUE)
a<-table.element(a,'Trend',header=TRUE)
a<-table.element(a,'Seasonal',header=TRUE)
a<-table.element(a,'Random',header=TRUE)
a<-table.row.end(a)
for (i in 1:length(m$trend)) {
a<-table.row.start(a)
a<-table.element(a,i,header=TRUE)
a<-table.element(a,x[i])
if (par1 == 'additive') a<-table.element(a,signif(m$trend[i]+m$seasonal[i],6)) else a<-table.element(a,signif(m$trend[i]*m$seasonal[i],6))
a<-table.element(a,signif(m$trend[i],6))
a<-table.element(a,signif(m$seasonal[i],6))
a<-table.element(a,signif(m$random[i],6))
a<-table.row.end(a)
}
a<-table.end(a)
table.save(a,file='mytable.tab')