Free Statistics

of Irreproducible Research!

Author's title

Author*Unverified author*
R Software Modulerwasp_hierarchicalclustering.wasp
Title produced by softwareHierarchical Clustering
Date of computationTue, 02 Aug 2022 09:39:17 +0200
Cite this page as followsStatistical Computations at FreeStatistics.org, Office for Research Development and Education, URL https://freestatistics.org/blog/index.php?v=date/2022/Aug/02/t1659426052i3epq8pnaxlujhl.htm/, Retrieved Fri, 17 May 2024 03:45:20 +0000
Statistical Computations at FreeStatistics.org, Office for Research Development and Education, URL https://freestatistics.org/blog/index.php?pk=319723, Retrieved Fri, 17 May 2024 03:45:20 +0000
QR Codes:

Original text written by user:
IsPrivate?No (this computation is public)
User-defined keywords
Estimated Impact53
Family? (F = Feedback message, R = changed R code, M = changed R Module, P = changed Parameters, D = changed Data)
-       [Hierarchical Clustering] [rtmlpa] [2022-08-02 07:39:17] [d41d8cd98f00b204e9800998ecf8427e] [Current]
Feedback Forum

Post a new message
Dataseries X:
0	1	0	0,177935191	0,111083151	0,187430697	0,184724066
1	1	0	1,470869905	1,073435949	0,254146879	0
0	0	0	1,127250641	1,018988622	0,270194007	0
1	0	1	0,876562059	1,699277502	0,782598628	0,116684019
0	1	0	0,980085788	0,757987735	0,830772621	0
1	0	0	0,883717195	1,21208385	0,776318422	0,059079233
1	0	1	1,1646456	2,177603658	0,673192479	0,073938144
0	0	0	0,208279276	0,210309501	0,572240353	0,794281318
0	1	0	0,10664341	0,679670747	0,122616725	0,116248605
0	1	0	0,516271989	0,799967376	0,406464147	0
0	0	0	0,455898698	1,458223548	0,087838254	0,101409057
0	0	0	0,99401602	1,436972366	0,21241014	0,272550743
0	0	0	0,248654443	0,426218857	0,27539845	0,156486041
0	1	0	0,093582059	0,481946145	0,199616416	0,06651615
0	0	0	0,899875234	1,146409515	0,649688332	0,284449819
0	1	0	0,529838285	0,755606657	0,801206109	0,204901659
0	0	0	0,433421314	1,069104588	0,496537335	0,16820277
0	0	0	0,601847445	1,083757317	0,799233026	0
0	1	0	0,14149099	1,789741544	0,22158775	0
1	0	1	1,66658433	2,136285551	0,754471943	0
1	0	1	1,194079218	1,373702769	0,831993625	0,093263638
0	0	1	1,228237438	2,664833718	0,928726503	0,224899827
1	1	1	1,251778314	1,372420322	0,12506653	0
0	0	0	0,729723703	1,08099129	0,663867488	0,151853702
0	0	1	0,768670693	1,667537584	1,19659693	0,192553171
0		1	0,763505303	1,304844204	0,907355148	0
0	0	0	0,775347388	1,467249799	0,284000748	0,134404525
0	1	0	0,775599994	0,873845255	0,16375242	0,090199649
0	1	0	1,069805359	1,71482925	0,402981839	0
0	0	1	0,503118213	0,277287061	0,840647308	0,071729481
0	0	1	0,508085297	0,474702707	0,665269064	0,044499879
0	0	1	1,113606817	0,359887102	0,624827872	0,207353313
0	0	0	1,6993843	0,926558501	0,328699061	0
0	1	1	1,245813562	1,603163665	0,586226828	0,156549497
0	0	0	2,21195237	1,45451427	0,36438708	0


Summary of computational transaction
Raw Input view raw input (R code)
Raw Outputview raw output of R engine
Computing time1 seconds
R ServerBig Analytics Cloud Computing Center
R Framework error message
Warning: there are blank lines in the 'Data X' field.
Please, use NA for missing data - blank lines are simply
 deleted and are NOT treated as missing values.

\begin{tabular}{lllllllll}
\hline
Summary of computational transaction \tabularnewline
Raw Input view raw input (R code)  \tabularnewline
Raw Outputview raw output of R engine  \tabularnewline
Computing time1 seconds \tabularnewline
R ServerBig Analytics Cloud Computing Center \tabularnewline
R Framework error message & 
Warning: there are blank lines in the 'Data X' field.
Please, use NA for missing data - blank lines are simply
 deleted and are NOT treated as missing values.
\tabularnewline \hline \end{tabular} %Source: https://freestatistics.org/blog/index.php?pk=319723&T=0

[TABLE]
[ROW]
Summary of computational transaction[/C][/ROW] [ROW]Raw Input[/C] view raw input (R code) [/C][/ROW] [ROW]Raw Output[/C]view raw output of R engine [/C][/ROW] [ROW]Computing time[/C]1 seconds[/C][/ROW] [ROW]R Server[/C]Big Analytics Cloud Computing Center[/C][/ROW] [ROW]R Framework error message[/C][C]
Warning: there are blank lines in the 'Data X' field.
Please, use NA for missing data - blank lines are simply
 deleted and are NOT treated as missing values.
[/C][/ROW] [/TABLE] Source: https://freestatistics.org/blog/index.php?pk=319723&T=0

Globally Unique Identifier (entire table): ba.freestatistics.org/blog/index.php?pk=319723&T=0

As an alternative you can also use a QR Code:  

The GUIDs for individual cells are displayed in the table below:

Summary of computational transaction
Raw Input view raw input (R code)
Raw Outputview raw output of R engine
Computing time1 seconds
R ServerBig Analytics Cloud Computing Center
R Framework error message
Warning: there are blank lines in the 'Data X' field.
Please, use NA for missing data - blank lines are simply
 deleted and are NOT treated as missing values.


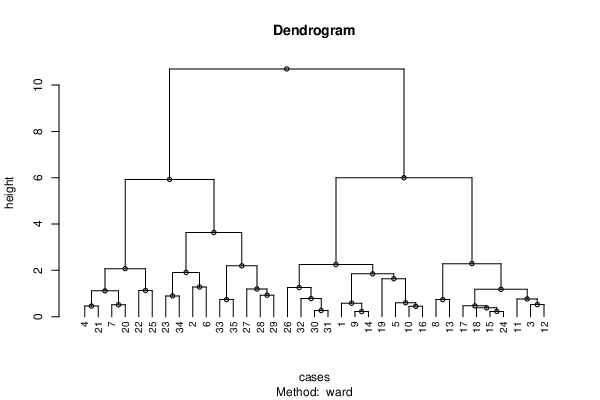
Summary of Dendrogram
LabelHeight
10.218329765768266
20.225862494390159
30.265511937401433
40.380073353122759
50.447166439037992
60.458044138705286
70.466844399610818
80.515483147199177
90.519696793598534
100.580031430752717
110.601335272536151
120.73670683117781
130.736983673400423
140.765172160319198
150.781793975913156
160.896095619551603
170.926918317995574
181.11665322536082
191.13075286593348
201.17989205179515
211.19517897327876
221.25528829169084
231.28067365921335
241.63840522067025
251.84766608043116
261.90805347548668
272.07371454970657
282.19737501726521
292.25283968195657
302.28990121867691
313.63366943631395
325.92871611192037
335.99848432584708
3410.6982422461017

\begin{tabular}{lllllllll}
\hline
Summary of Dendrogram \tabularnewline
Label & Height \tabularnewline
1 & 0.218329765768266 \tabularnewline
2 & 0.225862494390159 \tabularnewline
3 & 0.265511937401433 \tabularnewline
4 & 0.380073353122759 \tabularnewline
5 & 0.447166439037992 \tabularnewline
6 & 0.458044138705286 \tabularnewline
7 & 0.466844399610818 \tabularnewline
8 & 0.515483147199177 \tabularnewline
9 & 0.519696793598534 \tabularnewline
10 & 0.580031430752717 \tabularnewline
11 & 0.601335272536151 \tabularnewline
12 & 0.73670683117781 \tabularnewline
13 & 0.736983673400423 \tabularnewline
14 & 0.765172160319198 \tabularnewline
15 & 0.781793975913156 \tabularnewline
16 & 0.896095619551603 \tabularnewline
17 & 0.926918317995574 \tabularnewline
18 & 1.11665322536082 \tabularnewline
19 & 1.13075286593348 \tabularnewline
20 & 1.17989205179515 \tabularnewline
21 & 1.19517897327876 \tabularnewline
22 & 1.25528829169084 \tabularnewline
23 & 1.28067365921335 \tabularnewline
24 & 1.63840522067025 \tabularnewline
25 & 1.84766608043116 \tabularnewline
26 & 1.90805347548668 \tabularnewline
27 & 2.07371454970657 \tabularnewline
28 & 2.19737501726521 \tabularnewline
29 & 2.25283968195657 \tabularnewline
30 & 2.28990121867691 \tabularnewline
31 & 3.63366943631395 \tabularnewline
32 & 5.92871611192037 \tabularnewline
33 & 5.99848432584708 \tabularnewline
34 & 10.6982422461017 \tabularnewline
\hline
\end{tabular}
%Source: https://freestatistics.org/blog/index.php?pk=319723&T=1

[TABLE]
[ROW][C]Summary of Dendrogram[/C][/ROW]
[ROW][C]Label[/C][C]Height[/C][/ROW]
[ROW][C]1[/C][C]0.218329765768266[/C][/ROW]
[ROW][C]2[/C][C]0.225862494390159[/C][/ROW]
[ROW][C]3[/C][C]0.265511937401433[/C][/ROW]
[ROW][C]4[/C][C]0.380073353122759[/C][/ROW]
[ROW][C]5[/C][C]0.447166439037992[/C][/ROW]
[ROW][C]6[/C][C]0.458044138705286[/C][/ROW]
[ROW][C]7[/C][C]0.466844399610818[/C][/ROW]
[ROW][C]8[/C][C]0.515483147199177[/C][/ROW]
[ROW][C]9[/C][C]0.519696793598534[/C][/ROW]
[ROW][C]10[/C][C]0.580031430752717[/C][/ROW]
[ROW][C]11[/C][C]0.601335272536151[/C][/ROW]
[ROW][C]12[/C][C]0.73670683117781[/C][/ROW]
[ROW][C]13[/C][C]0.736983673400423[/C][/ROW]
[ROW][C]14[/C][C]0.765172160319198[/C][/ROW]
[ROW][C]15[/C][C]0.781793975913156[/C][/ROW]
[ROW][C]16[/C][C]0.896095619551603[/C][/ROW]
[ROW][C]17[/C][C]0.926918317995574[/C][/ROW]
[ROW][C]18[/C][C]1.11665322536082[/C][/ROW]
[ROW][C]19[/C][C]1.13075286593348[/C][/ROW]
[ROW][C]20[/C][C]1.17989205179515[/C][/ROW]
[ROW][C]21[/C][C]1.19517897327876[/C][/ROW]
[ROW][C]22[/C][C]1.25528829169084[/C][/ROW]
[ROW][C]23[/C][C]1.28067365921335[/C][/ROW]
[ROW][C]24[/C][C]1.63840522067025[/C][/ROW]
[ROW][C]25[/C][C]1.84766608043116[/C][/ROW]
[ROW][C]26[/C][C]1.90805347548668[/C][/ROW]
[ROW][C]27[/C][C]2.07371454970657[/C][/ROW]
[ROW][C]28[/C][C]2.19737501726521[/C][/ROW]
[ROW][C]29[/C][C]2.25283968195657[/C][/ROW]
[ROW][C]30[/C][C]2.28990121867691[/C][/ROW]
[ROW][C]31[/C][C]3.63366943631395[/C][/ROW]
[ROW][C]32[/C][C]5.92871611192037[/C][/ROW]
[ROW][C]33[/C][C]5.99848432584708[/C][/ROW]
[ROW][C]34[/C][C]10.6982422461017[/C][/ROW]
[/TABLE]
Source: https://freestatistics.org/blog/index.php?pk=319723&T=1

Globally Unique Identifier (entire table): ba.freestatistics.org/blog/index.php?pk=319723&T=1

As an alternative you can also use a QR Code:  

The GUIDs for individual cells are displayed in the table below:

Summary of Dendrogram
LabelHeight
10.218329765768266
20.225862494390159
30.265511937401433
40.380073353122759
50.447166439037992
60.458044138705286
70.466844399610818
80.515483147199177
90.519696793598534
100.580031430752717
110.601335272536151
120.73670683117781
130.736983673400423
140.765172160319198
150.781793975913156
160.896095619551603
170.926918317995574
181.11665322536082
191.13075286593348
201.17989205179515
211.19517897327876
221.25528829169084
231.28067365921335
241.63840522067025
251.84766608043116
261.90805347548668
272.07371454970657
282.19737501726521
292.25283968195657
302.28990121867691
313.63366943631395
325.92871611192037
335.99848432584708
3410.6982422461017


Parameters (Session):
Parameters (R input):
par1 = ward ; par2 = ALL ; par3 = FALSE ; par4 = FALSE ;
R code (references can be found in the software module):
par3 <- as.logical(par3)
par4 <- as.logical(par4)
if (par3 == 'TRUE'){
dum = xlab
xlab = ylab
ylab = dum
}
x <- t(y)
hc <- hclust(dist(x),method=par1)
d <- as.dendrogram(hc)
str(d)
mysub <- paste('Method: ',par1)
bitmap(file='test1.png')
if (par4 == 'TRUE'){
plot(d,main=main,ylab=ylab,xlab=xlab,horiz=par3, nodePar=list(pch = c(1,NA), cex=0.8, lab.cex = 0.8),type='t',center=T, sub=mysub)
} else {
plot(d,main=main,ylab=ylab,xlab=xlab,horiz=par3, nodePar=list(pch = c(1,NA), cex=0.8, lab.cex = 0.8), sub=mysub)
}
dev.off()
if (par2 != 'ALL'){
if (par3 == 'TRUE'){
ylab = 'cluster'
} else {
xlab = 'cluster'
}
par2 <- as.numeric(par2)
memb <- cutree(hc, k = par2)
cent <- NULL
for(k in 1:par2){
cent <- rbind(cent, colMeans(x[memb == k, , drop = FALSE]))
}
hc1 <- hclust(dist(cent),method=par1, members = table(memb))
de <- as.dendrogram(hc1)
bitmap(file='test2.png')
if (par4 == 'TRUE'){
plot(de,main=main,ylab=ylab,xlab=xlab,horiz=par3, nodePar=list(pch = c(1,NA), cex=0.8, lab.cex = 0.8),type='t',center=T, sub=mysub)
} else {
plot(de,main=main,ylab=ylab,xlab=xlab,horiz=par3, nodePar=list(pch = c(1,NA), cex=0.8, lab.cex = 0.8), sub=mysub)
}
dev.off()
str(de)
}
load(file='createtable')
a<-table.start()
a<-table.row.start(a)
a<-table.element(a,'Summary of Dendrogram',2,TRUE)
a<-table.row.end(a)
a<-table.row.start(a)
a<-table.element(a,'Label',header=TRUE)
a<-table.element(a,'Height',header=TRUE)
a<-table.row.end(a)
num <- length(x[,1])-1
for (i in 1:num)
{
a<-table.row.start(a)
a<-table.element(a,hc$labels[i])
a<-table.element(a,hc$height[i])
a<-table.row.end(a)
}
a<-table.end(a)
table.save(a,file='mytable1.tab')
if (par2 != 'ALL'){
a<-table.start()
a<-table.row.start(a)
a<-table.element(a,'Summary of Cut Dendrogram',2,TRUE)
a<-table.row.end(a)
a<-table.row.start(a)
a<-table.element(a,'Label',header=TRUE)
a<-table.element(a,'Height',header=TRUE)
a<-table.row.end(a)
num <- par2-1
for (i in 1:num)
{
a<-table.row.start(a)
a<-table.element(a,i)
a<-table.element(a,hc1$height[i])
a<-table.row.end(a)
}
a<-table.end(a)
table.save(a,file='mytable2.tab')
}