Free Statistics

of Irreproducible Research!

Author's title

Author*Unverified author*
R Software Modulerwasp_autocorrelation.wasp
Title produced by software(Partial) Autocorrelation Function
Date of computationThu, 01 Dec 2022 18:01:14 +0100
Cite this page as followsStatistical Computations at FreeStatistics.org, Office for Research Development and Education, URL https://freestatistics.org/blog/index.php?v=date/2022/Dec/01/t16699145030ihp0tnmea5a5oz.htm/, Retrieved Fri, 17 May 2024 19:17:02 +0000
Statistical Computations at FreeStatistics.org, Office for Research Development and Education, URL https://freestatistics.org/blog/index.php?pk=319792, Retrieved Fri, 17 May 2024 19:17:02 +0000
QR Codes:

Original text written by user:
IsPrivate?No (this computation is public)
User-defined keywords
Estimated Impact39
Family? (F = Feedback message, R = changed R code, M = changed R Module, P = changed Parameters, D = changed Data)
-       [(Partial) Autocorrelation Function] [] [2022-12-01 17:01:14] [d41d8cd98f00b204e9800998ecf8427e] [Current]
Feedback Forum

Post a new message
Dataseries X:
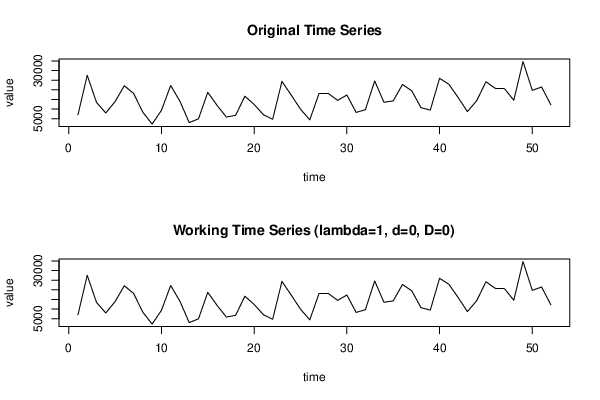
7042
27602
13508
7991
13893
22129
18172
8377
2235
9342
22251
14062
2979
4989
18702
11966
5909
6740
16711
12421
7118
4716
24411
17289
9984
4426
18137
18143
14527
17327
8294
9682
24633
13555
14249
22830
19476
10732
9488
26017
22915
16048
8698
14345
24229
20783
20634
14593
34715
19763
21481
12269


Summary of computational transaction
Raw Input view raw input (R code)
Raw Outputview raw output of R engine
Computing time1 seconds
R ServerBig Analytics Cloud Computing Center

\begin{tabular}{lllllllll}
\hline
Summary of computational transaction \tabularnewline
Raw Input view raw input (R code)  \tabularnewline
Raw Outputview raw output of R engine  \tabularnewline
Computing time1 seconds \tabularnewline
R ServerBig Analytics Cloud Computing Center \tabularnewline
\hline
\end{tabular}
%Source: https://freestatistics.org/blog/index.php?pk=319792&T=0

[TABLE]
[ROW]
Summary of computational transaction[/C][/ROW] [ROW]Raw Input[/C] view raw input (R code) [/C][/ROW] [ROW]Raw Output[/C]view raw output of R engine [/C][/ROW] [ROW]Computing time[/C]1 seconds[/C][/ROW] [ROW]R Server[/C]Big Analytics Cloud Computing Center[/C][/ROW] [/TABLE] Source: https://freestatistics.org/blog/index.php?pk=319792&T=0

Globally Unique Identifier (entire table): ba.freestatistics.org/blog/index.php?pk=319792&T=0

As an alternative you can also use a QR Code:  

The GUIDs for individual cells are displayed in the table below:

Summary of computational transaction
Raw Input view raw input (R code)
Raw Outputview raw output of R engine
Computing time1 seconds
R ServerBig Analytics Cloud Computing Center


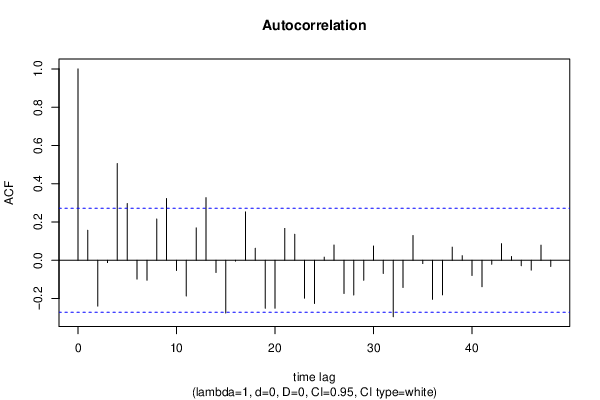
Autocorrelation Function
Time lag kACF(k)T-STATP-value
10.1568441.1310.131618
2-0.239562-1.72750.045006
3-0.012085-0.08710.465445
40.5053373.6440.00031
50.2964912.1380.018617
6-0.0985-0.71030.240348
7-0.104465-0.75330.227332
80.2152351.55210.063354
90.3224662.32530.011995
10-0.053707-0.38730.350063
11-0.186398-1.34410.09237
120.1691561.21980.114022
130.3270962.35870.011066
14-0.063611-0.45870.324179
15-0.275174-1.98430.026255
16-0.004118-0.02970.488213
170.252551.82120.037169
180.0626950.45210.326537
19-0.250227-1.80440.03848
20-0.250905-1.80930.038093
210.166611.20140.117511
220.1356730.97830.166216
23-0.198299-1.430.079356
24-0.225939-1.62930.05465
250.0162920.11750.453464
260.079620.57410.284172
27-0.17321-1.2490.108623
28-0.181687-1.31020.097949
29-0.104448-0.75320.227367
300.0741930.5350.29746
31-0.068762-0.49590.311044
32-0.294786-2.12570.019147
33-0.141883-1.02310.155491
340.128850.92910.178553
35-0.017309-0.12480.450575
36-0.204128-1.4720.073526
37-0.180901-1.30450.098904
380.0682320.4920.312385
390.0239510.17270.431772
40-0.079448-0.57290.284589
41-0.138585-0.99940.161126
42-0.020845-0.15030.440549
430.0866360.62470.267437
440.0197390.14230.443681
45-0.028223-0.20350.419762
46-0.051322-0.37010.35641
470.0786350.5670.286561
48-0.032061-0.23120.409036

\begin{tabular}{lllllllll}
\hline
Autocorrelation Function \tabularnewline
Time lag k & ACF(k) & T-STAT & P-value \tabularnewline
1 & 0.156844 & 1.131 & 0.131618 \tabularnewline
2 & -0.239562 & -1.7275 & 0.045006 \tabularnewline
3 & -0.012085 & -0.0871 & 0.465445 \tabularnewline
4 & 0.505337 & 3.644 & 0.00031 \tabularnewline
5 & 0.296491 & 2.138 & 0.018617 \tabularnewline
6 & -0.0985 & -0.7103 & 0.240348 \tabularnewline
7 & -0.104465 & -0.7533 & 0.227332 \tabularnewline
8 & 0.215235 & 1.5521 & 0.063354 \tabularnewline
9 & 0.322466 & 2.3253 & 0.011995 \tabularnewline
10 & -0.053707 & -0.3873 & 0.350063 \tabularnewline
11 & -0.186398 & -1.3441 & 0.09237 \tabularnewline
12 & 0.169156 & 1.2198 & 0.114022 \tabularnewline
13 & 0.327096 & 2.3587 & 0.011066 \tabularnewline
14 & -0.063611 & -0.4587 & 0.324179 \tabularnewline
15 & -0.275174 & -1.9843 & 0.026255 \tabularnewline
16 & -0.004118 & -0.0297 & 0.488213 \tabularnewline
17 & 0.25255 & 1.8212 & 0.037169 \tabularnewline
18 & 0.062695 & 0.4521 & 0.326537 \tabularnewline
19 & -0.250227 & -1.8044 & 0.03848 \tabularnewline
20 & -0.250905 & -1.8093 & 0.038093 \tabularnewline
21 & 0.16661 & 1.2014 & 0.117511 \tabularnewline
22 & 0.135673 & 0.9783 & 0.166216 \tabularnewline
23 & -0.198299 & -1.43 & 0.079356 \tabularnewline
24 & -0.225939 & -1.6293 & 0.05465 \tabularnewline
25 & 0.016292 & 0.1175 & 0.453464 \tabularnewline
26 & 0.07962 & 0.5741 & 0.284172 \tabularnewline
27 & -0.17321 & -1.249 & 0.108623 \tabularnewline
28 & -0.181687 & -1.3102 & 0.097949 \tabularnewline
29 & -0.104448 & -0.7532 & 0.227367 \tabularnewline
30 & 0.074193 & 0.535 & 0.29746 \tabularnewline
31 & -0.068762 & -0.4959 & 0.311044 \tabularnewline
32 & -0.294786 & -2.1257 & 0.019147 \tabularnewline
33 & -0.141883 & -1.0231 & 0.155491 \tabularnewline
34 & 0.12885 & 0.9291 & 0.178553 \tabularnewline
35 & -0.017309 & -0.1248 & 0.450575 \tabularnewline
36 & -0.204128 & -1.472 & 0.073526 \tabularnewline
37 & -0.180901 & -1.3045 & 0.098904 \tabularnewline
38 & 0.068232 & 0.492 & 0.312385 \tabularnewline
39 & 0.023951 & 0.1727 & 0.431772 \tabularnewline
40 & -0.079448 & -0.5729 & 0.284589 \tabularnewline
41 & -0.138585 & -0.9994 & 0.161126 \tabularnewline
42 & -0.020845 & -0.1503 & 0.440549 \tabularnewline
43 & 0.086636 & 0.6247 & 0.267437 \tabularnewline
44 & 0.019739 & 0.1423 & 0.443681 \tabularnewline
45 & -0.028223 & -0.2035 & 0.419762 \tabularnewline
46 & -0.051322 & -0.3701 & 0.35641 \tabularnewline
47 & 0.078635 & 0.567 & 0.286561 \tabularnewline
48 & -0.032061 & -0.2312 & 0.409036 \tabularnewline
\hline
\end{tabular}
%Source: https://freestatistics.org/blog/index.php?pk=319792&T=1

[TABLE]
[ROW][C]Autocorrelation Function[/C][/ROW]
[ROW][C]Time lag k[/C][C]ACF(k)[/C][C]T-STAT[/C][C]P-value[/C][/ROW]
[ROW][C]1[/C][C]0.156844[/C][C]1.131[/C][C]0.131618[/C][/ROW]
[ROW][C]2[/C][C]-0.239562[/C][C]-1.7275[/C][C]0.045006[/C][/ROW]
[ROW][C]3[/C][C]-0.012085[/C][C]-0.0871[/C][C]0.465445[/C][/ROW]
[ROW][C]4[/C][C]0.505337[/C][C]3.644[/C][C]0.00031[/C][/ROW]
[ROW][C]5[/C][C]0.296491[/C][C]2.138[/C][C]0.018617[/C][/ROW]
[ROW][C]6[/C][C]-0.0985[/C][C]-0.7103[/C][C]0.240348[/C][/ROW]
[ROW][C]7[/C][C]-0.104465[/C][C]-0.7533[/C][C]0.227332[/C][/ROW]
[ROW][C]8[/C][C]0.215235[/C][C]1.5521[/C][C]0.063354[/C][/ROW]
[ROW][C]9[/C][C]0.322466[/C][C]2.3253[/C][C]0.011995[/C][/ROW]
[ROW][C]10[/C][C]-0.053707[/C][C]-0.3873[/C][C]0.350063[/C][/ROW]
[ROW][C]11[/C][C]-0.186398[/C][C]-1.3441[/C][C]0.09237[/C][/ROW]
[ROW][C]12[/C][C]0.169156[/C][C]1.2198[/C][C]0.114022[/C][/ROW]
[ROW][C]13[/C][C]0.327096[/C][C]2.3587[/C][C]0.011066[/C][/ROW]
[ROW][C]14[/C][C]-0.063611[/C][C]-0.4587[/C][C]0.324179[/C][/ROW]
[ROW][C]15[/C][C]-0.275174[/C][C]-1.9843[/C][C]0.026255[/C][/ROW]
[ROW][C]16[/C][C]-0.004118[/C][C]-0.0297[/C][C]0.488213[/C][/ROW]
[ROW][C]17[/C][C]0.25255[/C][C]1.8212[/C][C]0.037169[/C][/ROW]
[ROW][C]18[/C][C]0.062695[/C][C]0.4521[/C][C]0.326537[/C][/ROW]
[ROW][C]19[/C][C]-0.250227[/C][C]-1.8044[/C][C]0.03848[/C][/ROW]
[ROW][C]20[/C][C]-0.250905[/C][C]-1.8093[/C][C]0.038093[/C][/ROW]
[ROW][C]21[/C][C]0.16661[/C][C]1.2014[/C][C]0.117511[/C][/ROW]
[ROW][C]22[/C][C]0.135673[/C][C]0.9783[/C][C]0.166216[/C][/ROW]
[ROW][C]23[/C][C]-0.198299[/C][C]-1.43[/C][C]0.079356[/C][/ROW]
[ROW][C]24[/C][C]-0.225939[/C][C]-1.6293[/C][C]0.05465[/C][/ROW]
[ROW][C]25[/C][C]0.016292[/C][C]0.1175[/C][C]0.453464[/C][/ROW]
[ROW][C]26[/C][C]0.07962[/C][C]0.5741[/C][C]0.284172[/C][/ROW]
[ROW][C]27[/C][C]-0.17321[/C][C]-1.249[/C][C]0.108623[/C][/ROW]
[ROW][C]28[/C][C]-0.181687[/C][C]-1.3102[/C][C]0.097949[/C][/ROW]
[ROW][C]29[/C][C]-0.104448[/C][C]-0.7532[/C][C]0.227367[/C][/ROW]
[ROW][C]30[/C][C]0.074193[/C][C]0.535[/C][C]0.29746[/C][/ROW]
[ROW][C]31[/C][C]-0.068762[/C][C]-0.4959[/C][C]0.311044[/C][/ROW]
[ROW][C]32[/C][C]-0.294786[/C][C]-2.1257[/C][C]0.019147[/C][/ROW]
[ROW][C]33[/C][C]-0.141883[/C][C]-1.0231[/C][C]0.155491[/C][/ROW]
[ROW][C]34[/C][C]0.12885[/C][C]0.9291[/C][C]0.178553[/C][/ROW]
[ROW][C]35[/C][C]-0.017309[/C][C]-0.1248[/C][C]0.450575[/C][/ROW]
[ROW][C]36[/C][C]-0.204128[/C][C]-1.472[/C][C]0.073526[/C][/ROW]
[ROW][C]37[/C][C]-0.180901[/C][C]-1.3045[/C][C]0.098904[/C][/ROW]
[ROW][C]38[/C][C]0.068232[/C][C]0.492[/C][C]0.312385[/C][/ROW]
[ROW][C]39[/C][C]0.023951[/C][C]0.1727[/C][C]0.431772[/C][/ROW]
[ROW][C]40[/C][C]-0.079448[/C][C]-0.5729[/C][C]0.284589[/C][/ROW]
[ROW][C]41[/C][C]-0.138585[/C][C]-0.9994[/C][C]0.161126[/C][/ROW]
[ROW][C]42[/C][C]-0.020845[/C][C]-0.1503[/C][C]0.440549[/C][/ROW]
[ROW][C]43[/C][C]0.086636[/C][C]0.6247[/C][C]0.267437[/C][/ROW]
[ROW][C]44[/C][C]0.019739[/C][C]0.1423[/C][C]0.443681[/C][/ROW]
[ROW][C]45[/C][C]-0.028223[/C][C]-0.2035[/C][C]0.419762[/C][/ROW]
[ROW][C]46[/C][C]-0.051322[/C][C]-0.3701[/C][C]0.35641[/C][/ROW]
[ROW][C]47[/C][C]0.078635[/C][C]0.567[/C][C]0.286561[/C][/ROW]
[ROW][C]48[/C][C]-0.032061[/C][C]-0.2312[/C][C]0.409036[/C][/ROW]
[/TABLE]
Source: https://freestatistics.org/blog/index.php?pk=319792&T=1

Globally Unique Identifier (entire table): ba.freestatistics.org/blog/index.php?pk=319792&T=1

As an alternative you can also use a QR Code:  

The GUIDs for individual cells are displayed in the table below:

Autocorrelation Function
Time lag kACF(k)T-STATP-value
10.1568441.1310.131618
2-0.239562-1.72750.045006
3-0.012085-0.08710.465445
40.5053373.6440.00031
50.2964912.1380.018617
6-0.0985-0.71030.240348
7-0.104465-0.75330.227332
80.2152351.55210.063354
90.3224662.32530.011995
10-0.053707-0.38730.350063
11-0.186398-1.34410.09237
120.1691561.21980.114022
130.3270962.35870.011066
14-0.063611-0.45870.324179
15-0.275174-1.98430.026255
16-0.004118-0.02970.488213
170.252551.82120.037169
180.0626950.45210.326537
19-0.250227-1.80440.03848
20-0.250905-1.80930.038093
210.166611.20140.117511
220.1356730.97830.166216
23-0.198299-1.430.079356
24-0.225939-1.62930.05465
250.0162920.11750.453464
260.079620.57410.284172
27-0.17321-1.2490.108623
28-0.181687-1.31020.097949
29-0.104448-0.75320.227367
300.0741930.5350.29746
31-0.068762-0.49590.311044
32-0.294786-2.12570.019147
33-0.141883-1.02310.155491
340.128850.92910.178553
35-0.017309-0.12480.450575
36-0.204128-1.4720.073526
37-0.180901-1.30450.098904
380.0682320.4920.312385
390.0239510.17270.431772
40-0.079448-0.57290.284589
41-0.138585-0.99940.161126
42-0.020845-0.15030.440549
430.0866360.62470.267437
440.0197390.14230.443681
45-0.028223-0.20350.419762
46-0.051322-0.37010.35641
470.0786350.5670.286561
48-0.032061-0.23120.409036


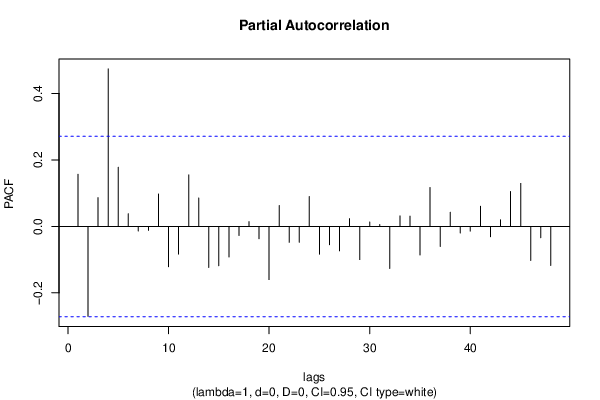
Partial Autocorrelation Function
Time lag kPACF(k)T-STATP-value
10.1568441.1310.131618
2-0.270825-1.95290.028109
30.0864540.62340.267864
40.4742623.41990.000613
50.1781111.28440.102352
60.0378530.2730.392982
7-0.013732-0.0990.460751
8-0.011722-0.08450.466479
90.0973710.70220.242857
10-0.121368-0.87520.192745
11-0.083438-0.60170.275
120.1550131.11780.134392
130.0855650.6170.269958
14-0.123766-0.89250.188121
15-0.118513-0.85460.198343
16-0.09198-0.66330.255041
17-0.027305-0.19690.422337
180.0142470.10270.459284
19-0.036804-0.26540.395875
20-0.160233-1.15550.126592
210.0627180.45230.326478
22-0.047864-0.34520.365686
23-0.047782-0.34460.365908
240.0900380.64930.25951
25-0.083548-0.60250.27474
26-0.055299-0.39880.345848
27-0.073611-0.53080.298904
280.0232080.16740.433871
29-0.099769-0.71940.237544
300.0130110.09380.462805
310.0057380.04140.483578
32-0.126508-0.91230.182921
330.0315280.22740.41052
340.0308750.22260.412342
35-0.08597-0.61990.269002
360.1168940.84290.201563
37-0.060484-0.43620.332265
380.0423130.30510.380745
39-0.019714-0.14220.443751
40-0.014029-0.10120.459904
410.060520.43640.332171
42-0.031096-0.22420.411726
430.0197720.14260.443587
440.10490.75640.226398
450.1293750.93290.177582
46-0.1024-0.73840.231791
47-0.033981-0.2450.403696
48-0.117589-0.84790.200176

\begin{tabular}{lllllllll}
\hline
Partial Autocorrelation Function \tabularnewline
Time lag k & PACF(k) & T-STAT & P-value \tabularnewline
1 & 0.156844 & 1.131 & 0.131618 \tabularnewline
2 & -0.270825 & -1.9529 & 0.028109 \tabularnewline
3 & 0.086454 & 0.6234 & 0.267864 \tabularnewline
4 & 0.474262 & 3.4199 & 0.000613 \tabularnewline
5 & 0.178111 & 1.2844 & 0.102352 \tabularnewline
6 & 0.037853 & 0.273 & 0.392982 \tabularnewline
7 & -0.013732 & -0.099 & 0.460751 \tabularnewline
8 & -0.011722 & -0.0845 & 0.466479 \tabularnewline
9 & 0.097371 & 0.7022 & 0.242857 \tabularnewline
10 & -0.121368 & -0.8752 & 0.192745 \tabularnewline
11 & -0.083438 & -0.6017 & 0.275 \tabularnewline
12 & 0.155013 & 1.1178 & 0.134392 \tabularnewline
13 & 0.085565 & 0.617 & 0.269958 \tabularnewline
14 & -0.123766 & -0.8925 & 0.188121 \tabularnewline
15 & -0.118513 & -0.8546 & 0.198343 \tabularnewline
16 & -0.09198 & -0.6633 & 0.255041 \tabularnewline
17 & -0.027305 & -0.1969 & 0.422337 \tabularnewline
18 & 0.014247 & 0.1027 & 0.459284 \tabularnewline
19 & -0.036804 & -0.2654 & 0.395875 \tabularnewline
20 & -0.160233 & -1.1555 & 0.126592 \tabularnewline
21 & 0.062718 & 0.4523 & 0.326478 \tabularnewline
22 & -0.047864 & -0.3452 & 0.365686 \tabularnewline
23 & -0.047782 & -0.3446 & 0.365908 \tabularnewline
24 & 0.090038 & 0.6493 & 0.25951 \tabularnewline
25 & -0.083548 & -0.6025 & 0.27474 \tabularnewline
26 & -0.055299 & -0.3988 & 0.345848 \tabularnewline
27 & -0.073611 & -0.5308 & 0.298904 \tabularnewline
28 & 0.023208 & 0.1674 & 0.433871 \tabularnewline
29 & -0.099769 & -0.7194 & 0.237544 \tabularnewline
30 & 0.013011 & 0.0938 & 0.462805 \tabularnewline
31 & 0.005738 & 0.0414 & 0.483578 \tabularnewline
32 & -0.126508 & -0.9123 & 0.182921 \tabularnewline
33 & 0.031528 & 0.2274 & 0.41052 \tabularnewline
34 & 0.030875 & 0.2226 & 0.412342 \tabularnewline
35 & -0.08597 & -0.6199 & 0.269002 \tabularnewline
36 & 0.116894 & 0.8429 & 0.201563 \tabularnewline
37 & -0.060484 & -0.4362 & 0.332265 \tabularnewline
38 & 0.042313 & 0.3051 & 0.380745 \tabularnewline
39 & -0.019714 & -0.1422 & 0.443751 \tabularnewline
40 & -0.014029 & -0.1012 & 0.459904 \tabularnewline
41 & 0.06052 & 0.4364 & 0.332171 \tabularnewline
42 & -0.031096 & -0.2242 & 0.411726 \tabularnewline
43 & 0.019772 & 0.1426 & 0.443587 \tabularnewline
44 & 0.1049 & 0.7564 & 0.226398 \tabularnewline
45 & 0.129375 & 0.9329 & 0.177582 \tabularnewline
46 & -0.1024 & -0.7384 & 0.231791 \tabularnewline
47 & -0.033981 & -0.245 & 0.403696 \tabularnewline
48 & -0.117589 & -0.8479 & 0.200176 \tabularnewline
\hline
\end{tabular}
%Source: https://freestatistics.org/blog/index.php?pk=319792&T=2

[TABLE]
[ROW][C]Partial Autocorrelation Function[/C][/ROW]
[ROW][C]Time lag k[/C][C]PACF(k)[/C][C]T-STAT[/C][C]P-value[/C][/ROW]
[ROW][C]1[/C][C]0.156844[/C][C]1.131[/C][C]0.131618[/C][/ROW]
[ROW][C]2[/C][C]-0.270825[/C][C]-1.9529[/C][C]0.028109[/C][/ROW]
[ROW][C]3[/C][C]0.086454[/C][C]0.6234[/C][C]0.267864[/C][/ROW]
[ROW][C]4[/C][C]0.474262[/C][C]3.4199[/C][C]0.000613[/C][/ROW]
[ROW][C]5[/C][C]0.178111[/C][C]1.2844[/C][C]0.102352[/C][/ROW]
[ROW][C]6[/C][C]0.037853[/C][C]0.273[/C][C]0.392982[/C][/ROW]
[ROW][C]7[/C][C]-0.013732[/C][C]-0.099[/C][C]0.460751[/C][/ROW]
[ROW][C]8[/C][C]-0.011722[/C][C]-0.0845[/C][C]0.466479[/C][/ROW]
[ROW][C]9[/C][C]0.097371[/C][C]0.7022[/C][C]0.242857[/C][/ROW]
[ROW][C]10[/C][C]-0.121368[/C][C]-0.8752[/C][C]0.192745[/C][/ROW]
[ROW][C]11[/C][C]-0.083438[/C][C]-0.6017[/C][C]0.275[/C][/ROW]
[ROW][C]12[/C][C]0.155013[/C][C]1.1178[/C][C]0.134392[/C][/ROW]
[ROW][C]13[/C][C]0.085565[/C][C]0.617[/C][C]0.269958[/C][/ROW]
[ROW][C]14[/C][C]-0.123766[/C][C]-0.8925[/C][C]0.188121[/C][/ROW]
[ROW][C]15[/C][C]-0.118513[/C][C]-0.8546[/C][C]0.198343[/C][/ROW]
[ROW][C]16[/C][C]-0.09198[/C][C]-0.6633[/C][C]0.255041[/C][/ROW]
[ROW][C]17[/C][C]-0.027305[/C][C]-0.1969[/C][C]0.422337[/C][/ROW]
[ROW][C]18[/C][C]0.014247[/C][C]0.1027[/C][C]0.459284[/C][/ROW]
[ROW][C]19[/C][C]-0.036804[/C][C]-0.2654[/C][C]0.395875[/C][/ROW]
[ROW][C]20[/C][C]-0.160233[/C][C]-1.1555[/C][C]0.126592[/C][/ROW]
[ROW][C]21[/C][C]0.062718[/C][C]0.4523[/C][C]0.326478[/C][/ROW]
[ROW][C]22[/C][C]-0.047864[/C][C]-0.3452[/C][C]0.365686[/C][/ROW]
[ROW][C]23[/C][C]-0.047782[/C][C]-0.3446[/C][C]0.365908[/C][/ROW]
[ROW][C]24[/C][C]0.090038[/C][C]0.6493[/C][C]0.25951[/C][/ROW]
[ROW][C]25[/C][C]-0.083548[/C][C]-0.6025[/C][C]0.27474[/C][/ROW]
[ROW][C]26[/C][C]-0.055299[/C][C]-0.3988[/C][C]0.345848[/C][/ROW]
[ROW][C]27[/C][C]-0.073611[/C][C]-0.5308[/C][C]0.298904[/C][/ROW]
[ROW][C]28[/C][C]0.023208[/C][C]0.1674[/C][C]0.433871[/C][/ROW]
[ROW][C]29[/C][C]-0.099769[/C][C]-0.7194[/C][C]0.237544[/C][/ROW]
[ROW][C]30[/C][C]0.013011[/C][C]0.0938[/C][C]0.462805[/C][/ROW]
[ROW][C]31[/C][C]0.005738[/C][C]0.0414[/C][C]0.483578[/C][/ROW]
[ROW][C]32[/C][C]-0.126508[/C][C]-0.9123[/C][C]0.182921[/C][/ROW]
[ROW][C]33[/C][C]0.031528[/C][C]0.2274[/C][C]0.41052[/C][/ROW]
[ROW][C]34[/C][C]0.030875[/C][C]0.2226[/C][C]0.412342[/C][/ROW]
[ROW][C]35[/C][C]-0.08597[/C][C]-0.6199[/C][C]0.269002[/C][/ROW]
[ROW][C]36[/C][C]0.116894[/C][C]0.8429[/C][C]0.201563[/C][/ROW]
[ROW][C]37[/C][C]-0.060484[/C][C]-0.4362[/C][C]0.332265[/C][/ROW]
[ROW][C]38[/C][C]0.042313[/C][C]0.3051[/C][C]0.380745[/C][/ROW]
[ROW][C]39[/C][C]-0.019714[/C][C]-0.1422[/C][C]0.443751[/C][/ROW]
[ROW][C]40[/C][C]-0.014029[/C][C]-0.1012[/C][C]0.459904[/C][/ROW]
[ROW][C]41[/C][C]0.06052[/C][C]0.4364[/C][C]0.332171[/C][/ROW]
[ROW][C]42[/C][C]-0.031096[/C][C]-0.2242[/C][C]0.411726[/C][/ROW]
[ROW][C]43[/C][C]0.019772[/C][C]0.1426[/C][C]0.443587[/C][/ROW]
[ROW][C]44[/C][C]0.1049[/C][C]0.7564[/C][C]0.226398[/C][/ROW]
[ROW][C]45[/C][C]0.129375[/C][C]0.9329[/C][C]0.177582[/C][/ROW]
[ROW][C]46[/C][C]-0.1024[/C][C]-0.7384[/C][C]0.231791[/C][/ROW]
[ROW][C]47[/C][C]-0.033981[/C][C]-0.245[/C][C]0.403696[/C][/ROW]
[ROW][C]48[/C][C]-0.117589[/C][C]-0.8479[/C][C]0.200176[/C][/ROW]
[/TABLE]
Source: https://freestatistics.org/blog/index.php?pk=319792&T=2

Globally Unique Identifier (entire table): ba.freestatistics.org/blog/index.php?pk=319792&T=2

As an alternative you can also use a QR Code:  

The GUIDs for individual cells are displayed in the table below:

Partial Autocorrelation Function
Time lag kPACF(k)T-STATP-value
10.1568441.1310.131618
2-0.270825-1.95290.028109
30.0864540.62340.267864
40.4742623.41990.000613
50.1781111.28440.102352
60.0378530.2730.392982
7-0.013732-0.0990.460751
8-0.011722-0.08450.466479
90.0973710.70220.242857
10-0.121368-0.87520.192745
11-0.083438-0.60170.275
120.1550131.11780.134392
130.0855650.6170.269958
14-0.123766-0.89250.188121
15-0.118513-0.85460.198343
16-0.09198-0.66330.255041
17-0.027305-0.19690.422337
180.0142470.10270.459284
19-0.036804-0.26540.395875
20-0.160233-1.15550.126592
210.0627180.45230.326478
22-0.047864-0.34520.365686
23-0.047782-0.34460.365908
240.0900380.64930.25951
25-0.083548-0.60250.27474
26-0.055299-0.39880.345848
27-0.073611-0.53080.298904
280.0232080.16740.433871
29-0.099769-0.71940.237544
300.0130110.09380.462805
310.0057380.04140.483578
32-0.126508-0.91230.182921
330.0315280.22740.41052
340.0308750.22260.412342
35-0.08597-0.61990.269002
360.1168940.84290.201563
37-0.060484-0.43620.332265
380.0423130.30510.380745
39-0.019714-0.14220.443751
40-0.014029-0.10120.459904
410.060520.43640.332171
42-0.031096-0.22420.411726
430.0197720.14260.443587
440.10490.75640.226398
450.1293750.93290.177582
46-0.1024-0.73840.231791
47-0.033981-0.2450.403696
48-0.117589-0.84790.200176


Parameters (Session):
Parameters (R input):
par1 = 48 ; par2 = 1 ; par3 = 0 ; par4 = 0 ; par5 = 12 ; par6 = White Noise ; par7 = 0.95 ; par8 = ;
R code (references can be found in the software module):
if (par1 == 'Default') {
par1 = 10*log10(length(x))
} else {
par1 <- as.numeric(par1)
}
par2 <- as.numeric(par2)
par3 <- as.numeric(par3)
par4 <- as.numeric(par4)
par5 <- as.numeric(par5)
if (par6 == 'White Noise') par6 <- 'white' else par6 <- 'ma'
par7 <- as.numeric(par7)
if (par8 != '') par8 <- as.numeric(par8)
x <- na.omit(x)
ox <- x
if (par8 == '') {
if (par2 == 0) {
x <- log(x)
} else {
x <- (x ^ par2 - 1) / par2
}
} else {
x <- log(x,base=par8)
}
if (par3 > 0) x <- diff(x,lag=1,difference=par3)
if (par4 > 0) x <- diff(x,lag=par5,difference=par4)
bitmap(file='picts.png')
op <- par(mfrow=c(2,1))
plot(ox,type='l',main='Original Time Series',xlab='time',ylab='value')
if (par8=='') {
mytitle <- paste('Working Time Series (lambda=',par2,', d=',par3,', D=',par4,')',sep='')
mysub <- paste('(lambda=',par2,', d=',par3,', D=',par4,', CI=', par7, ', CI type=',par6,')',sep='')
} else {
mytitle <- paste('Working Time Series (base=',par8,', d=',par3,', D=',par4,')',sep='')
mysub <- paste('(base=',par8,', d=',par3,', D=',par4,', CI=', par7, ', CI type=',par6,')',sep='')
}
plot(x,type='l', main=mytitle,xlab='time',ylab='value')
par(op)
dev.off()
bitmap(file='pic1.png')
racf <- acf(x, par1, main='Autocorrelation', xlab='time lag', ylab='ACF', ci.type=par6, ci=par7, sub=mysub)
dev.off()
bitmap(file='pic2.png')
rpacf <- pacf(x,par1,main='Partial Autocorrelation',xlab='lags',ylab='PACF',sub=mysub)
dev.off()
(myacf <- c(racf$acf))
(mypacf <- c(rpacf$acf))
lengthx <- length(x)
sqrtn <- sqrt(lengthx)
load(file='createtable')
a<-table.start()
a<-table.row.start(a)
a<-table.element(a,'Autocorrelation Function',4,TRUE)
a<-table.row.end(a)
a<-table.row.start(a)
a<-table.element(a,'Time lag k',header=TRUE)
a<-table.element(a,'ACF(k)',header=TRUE)
a<-table.element(a,'T-STAT',header=TRUE)
a<-table.element(a,'P-value',header=TRUE)
a<-table.row.end(a)
for (i in 2:(par1+1)) {
a<-table.row.start(a)
a<-table.element(a,i-1,header=TRUE)
a<-table.element(a,round(myacf[i],6))
mytstat <- myacf[i]*sqrtn
a<-table.element(a,round(mytstat,4))
a<-table.element(a,round(1-pt(abs(mytstat),lengthx),6))
a<-table.row.end(a)
}
a<-table.end(a)
table.save(a,file='mytable.tab')
a<-table.start()
a<-table.row.start(a)
a<-table.element(a,'Partial Autocorrelation Function',4,TRUE)
a<-table.row.end(a)
a<-table.row.start(a)
a<-table.element(a,'Time lag k',header=TRUE)
a<-table.element(a,'PACF(k)',header=TRUE)
a<-table.element(a,'T-STAT',header=TRUE)
a<-table.element(a,'P-value',header=TRUE)
a<-table.row.end(a)
for (i in 1:par1) {
a<-table.row.start(a)
a<-table.element(a,i,header=TRUE)
a<-table.element(a,round(mypacf[i],6))
mytstat <- mypacf[i]*sqrtn
a<-table.element(a,round(mytstat,4))
a<-table.element(a,round(1-pt(abs(mytstat),lengthx),6))
a<-table.row.end(a)
}
a<-table.end(a)
table.save(a,file='mytable1.tab')