Free Statistics
of Irreproducible Research!
Description of Statistical Computation | ||||||||||||||||||||||||||||||||||||||||||||||||||||||||||||||||||||||||||||||||||||||||||||||||||||||||||||||
|---|---|---|---|---|---|---|---|---|---|---|---|---|---|---|---|---|---|---|---|---|---|---|---|---|---|---|---|---|---|---|---|---|---|---|---|---|---|---|---|---|---|---|---|---|---|---|---|---|---|---|---|---|---|---|---|---|---|---|---|---|---|---|---|---|---|---|---|---|---|---|---|---|---|---|---|---|---|---|---|---|---|---|---|---|---|---|---|---|---|---|---|---|---|---|---|---|---|---|---|---|---|---|---|---|---|---|---|---|---|---|
| Author's title | ||||||||||||||||||||||||||||||||||||||||||||||||||||||||||||||||||||||||||||||||||||||||||||||||||||||||||||||
| Author | *The author of this computation has been verified* | |||||||||||||||||||||||||||||||||||||||||||||||||||||||||||||||||||||||||||||||||||||||||||||||||||||||||||||
| R Software Module | rwasp_notchedbox1.wasp | |||||||||||||||||||||||||||||||||||||||||||||||||||||||||||||||||||||||||||||||||||||||||||||||||||||||||||||
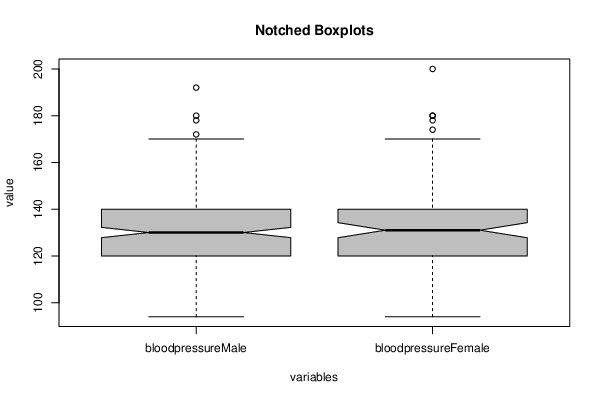
| Title produced by software | Notched Boxplots | |||||||||||||||||||||||||||||||||||||||||||||||||||||||||||||||||||||||||||||||||||||||||||||||||||||||||||||
| Date of computation | Thu, 27 Jan 2022 12:51:49 +0100 | |||||||||||||||||||||||||||||||||||||||||||||||||||||||||||||||||||||||||||||||||||||||||||||||||||||||||||||
| Cite this page as follows | Statistical Computations at FreeStatistics.org, Office for Research Development and Education, URL https://freestatistics.org/blog/index.php?v=date/2022/Jan/27/t1643284570zingfegbcnpz1bn.htm/, Retrieved Tue, 21 May 2024 04:54:11 +0000 | |||||||||||||||||||||||||||||||||||||||||||||||||||||||||||||||||||||||||||||||||||||||||||||||||||||||||||||
| Statistical Computations at FreeStatistics.org, Office for Research Development and Education, URL https://freestatistics.org/blog/index.php?pk=319623, Retrieved Tue, 21 May 2024 04:54:11 +0000 | ||||||||||||||||||||||||||||||||||||||||||||||||||||||||||||||||||||||||||||||||||||||||||||||||||||||||||||||
| QR Codes: | ||||||||||||||||||||||||||||||||||||||||||||||||||||||||||||||||||||||||||||||||||||||||||||||||||||||||||||||
|
| ||||||||||||||||||||||||||||||||||||||||||||||||||||||||||||||||||||||||||||||||||||||||||||||||||||||||||||||
| Original text written by user: | ||||||||||||||||||||||||||||||||||||||||||||||||||||||||||||||||||||||||||||||||||||||||||||||||||||||||||||||
| IsPrivate? | No (this computation is public) | |||||||||||||||||||||||||||||||||||||||||||||||||||||||||||||||||||||||||||||||||||||||||||||||||||||||||||||
| User-defined keywords | ||||||||||||||||||||||||||||||||||||||||||||||||||||||||||||||||||||||||||||||||||||||||||||||||||||||||||||||
| Estimated Impact | 59 | |||||||||||||||||||||||||||||||||||||||||||||||||||||||||||||||||||||||||||||||||||||||||||||||||||||||||||||
Tree of Dependent Computations | ||||||||||||||||||||||||||||||||||||||||||||||||||||||||||||||||||||||||||||||||||||||||||||||||||||||||||||||
| Family? (F = Feedback message, R = changed R code, M = changed R Module, P = changed Parameters, D = changed Data) | ||||||||||||||||||||||||||||||||||||||||||||||||||||||||||||||||||||||||||||||||||||||||||||||||||||||||||||||
| - [Notched Boxplots] [] [2022-01-27 11:51:49] [9d22051737ca820f26ab852e727e6980] [Current] | ||||||||||||||||||||||||||||||||||||||||||||||||||||||||||||||||||||||||||||||||||||||||||||||||||||||||||||||
| Feedback Forum | ||||||||||||||||||||||||||||||||||||||||||||||||||||||||||||||||||||||||||||||||||||||||||||||||||||||||||||||
Post a new message | ||||||||||||||||||||||||||||||||||||||||||||||||||||||||||||||||||||||||||||||||||||||||||||||||||||||||||||||
Dataset | ||||||||||||||||||||||||||||||||||||||||||||||||||||||||||||||||||||||||||||||||||||||||||||||||||||||||||||||
| Dataseries X: | ||||||||||||||||||||||||||||||||||||||||||||||||||||||||||||||||||||||||||||||||||||||||||||||||||||||||||||||
145 NA 130 NA NA 130 120 NA NA 120 140 NA NA 140 120 NA 172 NA 150 NA 140 NA NA 130 130 NA 110 NA NA 150 NA 120 NA 120 NA 150 150 NA NA 140 135 NA 130 NA 140 NA 150 NA 140 NA NA 160 150 NA 110 NA NA 140 130 NA NA 105 120 NA 130 NA 125 NA 125 NA NA 142 NA 135 150 NA NA 155 NA 160 NA 140 130 NA 104 NA NA 130 140 NA 120 NA 140 NA 138 NA NA 128 NA 138 NA 130 120 NA 130 NA NA 108 NA 135 134 NA 122 NA 115 NA 118 NA NA 128 NA 110 108 NA 118 NA 135 NA 140 NA NA 138 100 NA NA 130 120 NA NA 124 120 NA 94 NA 130 NA 140 NA NA 122 NA 135 125 NA 140 NA 128 NA 105 NA 112 NA 128 NA NA 102 152 NA NA 102 NA 115 118 NA 101 NA NA 110 NA 100 124 NA 132 NA 138 NA NA 132 NA 112 142 NA NA 140 108 NA 130 NA 130 NA 148 NA 178 NA NA 140 120 NA 129 NA NA 120 160 NA NA 138 NA 120 NA 110 NA 180 150 NA NA 140 110 NA 130 NA NA 120 130 NA 120 NA NA 105 NA 138 NA 130 138 NA NA 112 NA 108 NA 94 NA 118 112 NA NA 152 NA 136 NA 120 NA 160 NA 134 120 NA 110 NA NA 126 NA 130 NA 120 128 NA 110 NA 128 NA NA 120 115 NA NA 120 NA 106 NA 140 156 NA NA 118 NA 150 120 NA 130 NA 160 NA NA 112 170 NA NA 146 NA 138 NA 130 130 NA 122 NA 125 NA 130 NA 120 NA NA 132 120 NA 138 NA 138 NA 160 NA 120 NA NA 140 130 NA 140 NA 130 NA 110 NA 120 NA 132 NA 130 NA 110 NA 117 NA 140 NA 120 NA 150 NA 132 NA NA 150 NA 130 112 NA 150 NA 112 NA 130 NA 124 NA 140 NA 110 NA NA 130 128 NA 120 NA 145 NA 140 NA 170 NA 150 NA 125 NA 120 NA 110 NA 110 NA 125 NA 150 NA 180 NA NA 160 128 NA 110 NA NA 150 120 NA 140 NA 128 NA 120 NA 118 NA NA 145 125 NA NA 132 NA 130 130 NA 135 NA 130 NA NA 150 140 NA 138 NA NA 200 110 NA 145 NA 120 NA 120 NA 170 NA 125 NA 108 NA 165 NA 160 NA 120 NA 130 NA 140 NA 125 NA 140 NA 125 NA 126 NA 160 NA NA 174 145 NA 152 NA 132 NA 124 NA NA 134 160 NA 192 NA 140 NA 140 NA 132 NA NA 138 100 NA 160 NA 142 NA 128 NA 144 NA NA 150 120 NA NA 178 112 NA 123 NA NA 108 110 NA 112 NA NA 180 118 NA 122 NA 130 NA 120 NA 134 NA 120 NA 100 NA 110 NA 125 NA 146 NA 124 NA NA 136 138 NA 136 NA 128 NA 126 NA 152 NA 140 NA 140 NA 134 NA 154 NA 110 NA NA 128 148 NA 114 NA NA 170 152 NA 120 NA 140 NA NA 124 164 NA NA 140 110 NA 144 NA 130 NA NA 130 | ||||||||||||||||||||||||||||||||||||||||||||||||||||||||||||||||||||||||||||||||||||||||||||||||||||||||||||||
Tables (Output of Computation) | ||||||||||||||||||||||||||||||||||||||||||||||||||||||||||||||||||||||||||||||||||||||||||||||||||||||||||||||
| ||||||||||||||||||||||||||||||||||||||||||||||||||||||||||||||||||||||||||||||||||||||||||||||||||||||||||||||
Figures (Output of Computation) | ||||||||||||||||||||||||||||||||||||||||||||||||||||||||||||||||||||||||||||||||||||||||||||||||||||||||||||||
Input Parameters & R Code | ||||||||||||||||||||||||||||||||||||||||||||||||||||||||||||||||||||||||||||||||||||||||||||||||||||||||||||||
| Parameters (Session): | ||||||||||||||||||||||||||||||||||||||||||||||||||||||||||||||||||||||||||||||||||||||||||||||||||||||||||||||
| Parameters (R input): | ||||||||||||||||||||||||||||||||||||||||||||||||||||||||||||||||||||||||||||||||||||||||||||||||||||||||||||||
| par1 = grey ; par2 = no ; | ||||||||||||||||||||||||||||||||||||||||||||||||||||||||||||||||||||||||||||||||||||||||||||||||||||||||||||||
| R code (references can be found in the software module): | ||||||||||||||||||||||||||||||||||||||||||||||||||||||||||||||||||||||||||||||||||||||||||||||||||||||||||||||
if(par2=='yes') { | ||||||||||||||||||||||||||||||||||||||||||||||||||||||||||||||||||||||||||||||||||||||||||||||||||||||||||||||