Free Statistics
of Irreproducible Research!
Description of Statistical Computation | ||||||||||||||||||||||||||||||||||||||||||||||||||||||||||||||||||||||||||||||||||||||||||||||||||||||||||||||
|---|---|---|---|---|---|---|---|---|---|---|---|---|---|---|---|---|---|---|---|---|---|---|---|---|---|---|---|---|---|---|---|---|---|---|---|---|---|---|---|---|---|---|---|---|---|---|---|---|---|---|---|---|---|---|---|---|---|---|---|---|---|---|---|---|---|---|---|---|---|---|---|---|---|---|---|---|---|---|---|---|---|---|---|---|---|---|---|---|---|---|---|---|---|---|---|---|---|---|---|---|---|---|---|---|---|---|---|---|---|---|
| Author's title | ||||||||||||||||||||||||||||||||||||||||||||||||||||||||||||||||||||||||||||||||||||||||||||||||||||||||||||||
| Author | *Unverified author* | |||||||||||||||||||||||||||||||||||||||||||||||||||||||||||||||||||||||||||||||||||||||||||||||||||||||||||||
| R Software Module | rwasp_notchedbox1.wasp | |||||||||||||||||||||||||||||||||||||||||||||||||||||||||||||||||||||||||||||||||||||||||||||||||||||||||||||
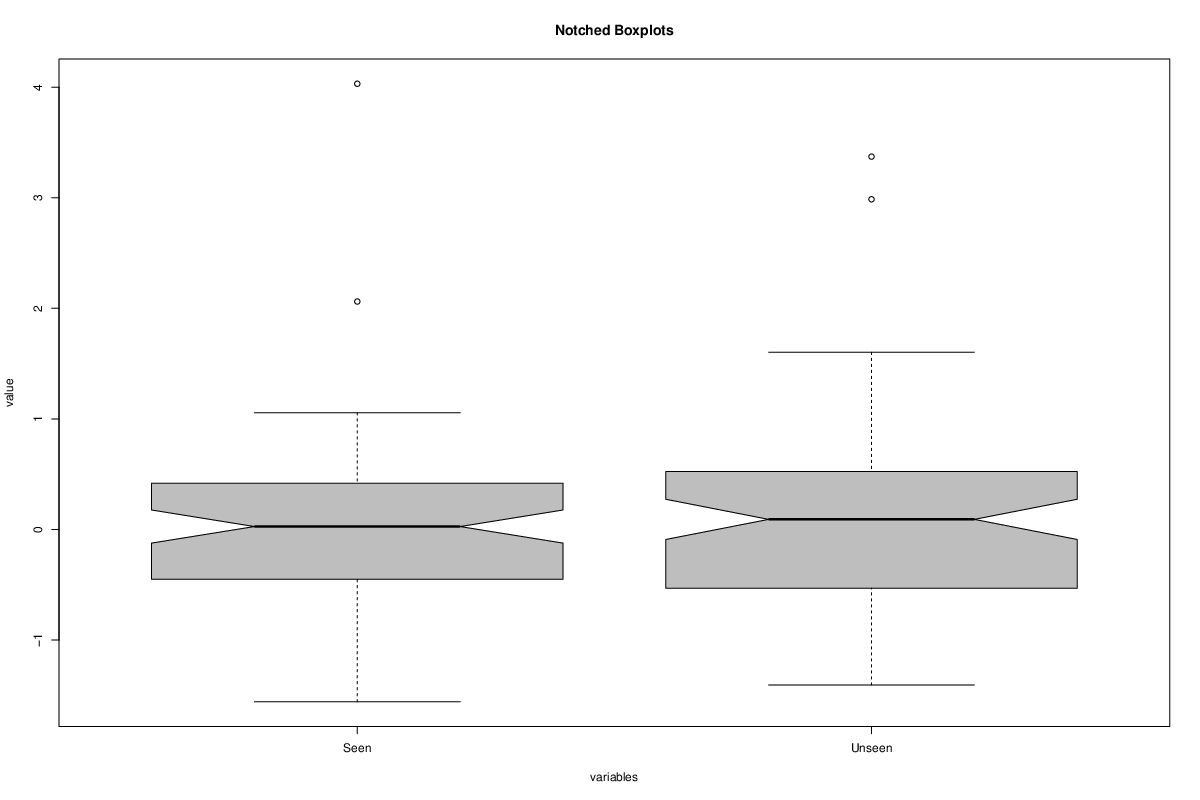
| Title produced by software | Notched Boxplots | |||||||||||||||||||||||||||||||||||||||||||||||||||||||||||||||||||||||||||||||||||||||||||||||||||||||||||||
| Date of computation | Wed, 30 Mar 2022 06:10:00 +0200 | |||||||||||||||||||||||||||||||||||||||||||||||||||||||||||||||||||||||||||||||||||||||||||||||||||||||||||||
| Cite this page as follows | Statistical Computations at FreeStatistics.org, Office for Research Development and Education, URL https://freestatistics.org/blog/index.php?v=date/2022/Mar/30/t1648613466j745h0cho6xivxp.htm/, Retrieved Tue, 14 May 2024 23:35:39 +0000 | |||||||||||||||||||||||||||||||||||||||||||||||||||||||||||||||||||||||||||||||||||||||||||||||||||||||||||||
| Statistical Computations at FreeStatistics.org, Office for Research Development and Education, URL https://freestatistics.org/blog/index.php?pk=319666, Retrieved Tue, 14 May 2024 23:35:39 +0000 | ||||||||||||||||||||||||||||||||||||||||||||||||||||||||||||||||||||||||||||||||||||||||||||||||||||||||||||||
| QR Codes: | ||||||||||||||||||||||||||||||||||||||||||||||||||||||||||||||||||||||||||||||||||||||||||||||||||||||||||||||
|
| ||||||||||||||||||||||||||||||||||||||||||||||||||||||||||||||||||||||||||||||||||||||||||||||||||||||||||||||
| Original text written by user: | ||||||||||||||||||||||||||||||||||||||||||||||||||||||||||||||||||||||||||||||||||||||||||||||||||||||||||||||
| IsPrivate? | No (this computation is public) | |||||||||||||||||||||||||||||||||||||||||||||||||||||||||||||||||||||||||||||||||||||||||||||||||||||||||||||
| User-defined keywords | ||||||||||||||||||||||||||||||||||||||||||||||||||||||||||||||||||||||||||||||||||||||||||||||||||||||||||||||
| Estimated Impact | 53 | |||||||||||||||||||||||||||||||||||||||||||||||||||||||||||||||||||||||||||||||||||||||||||||||||||||||||||||
Tree of Dependent Computations | ||||||||||||||||||||||||||||||||||||||||||||||||||||||||||||||||||||||||||||||||||||||||||||||||||||||||||||||
| Family? (F = Feedback message, R = changed R code, M = changed R Module, P = changed Parameters, D = changed Data) | ||||||||||||||||||||||||||||||||||||||||||||||||||||||||||||||||||||||||||||||||||||||||||||||||||||||||||||||
| - [Notched Boxplots] [] [2022-03-30 04:10:00] [d41d8cd98f00b204e9800998ecf8427e] [Current] | ||||||||||||||||||||||||||||||||||||||||||||||||||||||||||||||||||||||||||||||||||||||||||||||||||||||||||||||
| Feedback Forum | ||||||||||||||||||||||||||||||||||||||||||||||||||||||||||||||||||||||||||||||||||||||||||||||||||||||||||||||
Post a new message | ||||||||||||||||||||||||||||||||||||||||||||||||||||||||||||||||||||||||||||||||||||||||||||||||||||||||||||||
Dataset | ||||||||||||||||||||||||||||||||||||||||||||||||||||||||||||||||||||||||||||||||||||||||||||||||||||||||||||||
| Dataseries X: | ||||||||||||||||||||||||||||||||||||||||||||||||||||||||||||||||||||||||||||||||||||||||||||||||||||||||||||||
-0.572299593 0.382948643 0.638992013 0.72317147 0.62524572 0.323778027 0.550815903 0.1672531 0.33597119 0.725723373 0.503257773 0.545221803 0.238313887 -0.502769327 0.282555867 0.333739857 0.51577352 0.08977025 0.17977084 0.389035237 -0.242019707 0.76827367 0.29737148 0.70643074 0.98801126 0.527700917 0.6293372 0.936756363 0.78738849 -0.59590687 0.786822093 -1.091119053 -0.099908533 -0.531045127 -0.937254717 -0.457464567 0.419313437 0.34840624 0.608159977 0.04004438 0.207388597 0.464069633 -0.15027711 -0.233458483 -0.163052707 -0.417018593 0.416619717 -0.45950068 -1.337676477 0.52123904 -0.972711233 -1.136248207 -1.22074787 -0.47882985 -0.872746753 -0.687930253 4.031316283 -1.181383623 -0.55183544 -0.816245683 2.06182781 -1.032181337 -0.80028459 -0.60641566 0.295267053 -0.925972013 -0.428202153 0.225113243 -0.013737533 3.372183093 0.35443114 1.29320939 0.65054629 0.79207915 0.27290845 0.46614311 -0.029122723 1.48066423 0.596599613 0.610994963 0.27814301 -0.21229458 0.36180128 1.60225188 0.70999045 2.98650736 0.017974397 -0.37410362 -0.41574895 -0.12245065 0.24929226 0.02054671 -0.3141677 0.209157073 -0.0273544 -0.60037336 -0.02711247 -0.282514707 0.23864088 -0.790345903 -0.06650281 0.04810014 -1.0037199 -0.00592279 -0.52428594 0.28231053 -0.817015067 0.300510803 -0.69777783 0.33730977 -0.22870855 0.31644885 -0.64588644 0.271141167 -0.450858817 0.22112899 -0.92828425 -1.346543537 -0.387620753 -1.406596907 -1.558832197 -0.13500845 0.26543871 0.09312555 0.19342487 -0.232294163 0.55717649 0.00103621 0.6330306 -0.281197983 -1.089442327 -1.161395637 -0.004194643 -0.872970147 -0.243769117 -0.653974 0.2693594 -0.44188323 -0.53046746 -0.79052013 0.500498897 -0.919725773 0.21872951 -1.004285413 -0.19170124 -0.52970678 0.273499357 -0.86064673 0.03519006 0.5490325 -0.170471377 0.431493073 0.22034907 0.32806376 -0.449662377 0.639800673 -0.76046092 0.933326097 -1.283059403 0.864791763 0.00642443 1.16723353 1.05549753 1.213003163 | ||||||||||||||||||||||||||||||||||||||||||||||||||||||||||||||||||||||||||||||||||||||||||||||||||||||||||||||
Tables (Output of Computation) | ||||||||||||||||||||||||||||||||||||||||||||||||||||||||||||||||||||||||||||||||||||||||||||||||||||||||||||||
| ||||||||||||||||||||||||||||||||||||||||||||||||||||||||||||||||||||||||||||||||||||||||||||||||||||||||||||||
Figures (Output of Computation) | ||||||||||||||||||||||||||||||||||||||||||||||||||||||||||||||||||||||||||||||||||||||||||||||||||||||||||||||
Input Parameters & R Code | ||||||||||||||||||||||||||||||||||||||||||||||||||||||||||||||||||||||||||||||||||||||||||||||||||||||||||||||
| Parameters (Session): | ||||||||||||||||||||||||||||||||||||||||||||||||||||||||||||||||||||||||||||||||||||||||||||||||||||||||||||||
| par1 = grey ; par2 = no ; | ||||||||||||||||||||||||||||||||||||||||||||||||||||||||||||||||||||||||||||||||||||||||||||||||||||||||||||||
| Parameters (R input): | ||||||||||||||||||||||||||||||||||||||||||||||||||||||||||||||||||||||||||||||||||||||||||||||||||||||||||||||
| par1 = grey ; par2 = no ; | ||||||||||||||||||||||||||||||||||||||||||||||||||||||||||||||||||||||||||||||||||||||||||||||||||||||||||||||
| R code (references can be found in the software module): | ||||||||||||||||||||||||||||||||||||||||||||||||||||||||||||||||||||||||||||||||||||||||||||||||||||||||||||||
par2 <- 'no' | ||||||||||||||||||||||||||||||||||||||||||||||||||||||||||||||||||||||||||||||||||||||||||||||||||||||||||||||