Free Statistics

of Irreproducible Research!

Author's title

Author*Unverified author*
R Software Modulerwasp_exponentialsmoothing.wasp
Title produced by softwareExponential Smoothing
Date of computationFri, 16 Dec 2011 10:03:01 -0500
Cite this page as followsStatistical Computations at FreeStatistics.org, Office for Research Development and Education, URL https://freestatistics.org/blog/index.php?v=date/2011/Dec/16/t1324047795pltwx99jvd8ru6w.htm/, Retrieved Thu, 31 Oct 2024 23:24:13 +0000
Statistical Computations at FreeStatistics.org, Office for Research Development and Education, URL https://freestatistics.org/blog/index.php?pk=156034, Retrieved Thu, 31 Oct 2024 23:24:13 +0000
QR Codes:

Original text written by user:
IsPrivate?No (this computation is public)
User-defined keywords
Estimated Impact149
Family? (F = Feedback message, R = changed R code, M = changed R Module, P = changed Parameters, D = changed Data)
-     [Univariate Data Series] [data set] [2008-12-01 19:54:57] [b98453cac15ba1066b407e146608df68]
- RMPD  [Classical Decomposition] [compendium 8] [2011-11-24 14:23:11] [380049693c521f4999989215fb37aeca]
- RMPD    [Exponential Smoothing] [WS 8 Q3] [2011-11-24 15:31:44] [380049693c521f4999989215fb37aeca]
- R  D        [Exponential Smoothing] [] [2011-12-16 15:03:01] [d41d8cd98f00b204e9800998ecf8427e] [Current]
Feedback Forum

Post a new message
Dataseries X:
117541,78
116587
116809
122819,55
116955
117186
117265
117536
117781
117928
120437,52
121753,21
119369,88
118622
118885
124998,3
119369
119647
119879
120075
120295
120538
123250,68
124631,03
122443,31
121532
121844
128241,75
122391
122644
122927
122909
123417
123756
126540,18
128088,74
125874,28
124817
124961
131499,9
125639
125851
125970
126322
126540
126733
129557,34
131179,77
128754,8
127890
127996
134790,6
128585
128851
129142
129334
129536
129944
132842,76
134447,96
132088,81
130902
131374
138243
131885
131839
132002
132005
132127
132116
134993,94
136459,55


Summary of computational transaction
Raw Inputview raw input (R code)
Raw Outputview raw output of R engine
Computing time1 seconds
R Server'Gertrude Mary Cox' @ cox.wessa.net

\begin{tabular}{lllllllll}
\hline
Summary of computational transaction \tabularnewline
Raw Input & view raw input (R code)  \tabularnewline
Raw Output & view raw output of R engine  \tabularnewline
Computing time & 1 seconds \tabularnewline
R Server & 'Gertrude Mary Cox' @ cox.wessa.net \tabularnewline
\hline
\end{tabular}
%Source: https://freestatistics.org/blog/index.php?pk=156034&T=0

[TABLE]
[ROW][C]Summary of computational transaction[/C][/ROW]
[ROW][C]Raw Input[/C][C]view raw input (R code) [/C][/ROW]
[ROW][C]Raw Output[/C][C]view raw output of R engine [/C][/ROW]
[ROW][C]Computing time[/C][C]1 seconds[/C][/ROW]
[ROW][C]R Server[/C][C]'Gertrude Mary Cox' @ cox.wessa.net[/C][/ROW]
[/TABLE]
Source: https://freestatistics.org/blog/index.php?pk=156034&T=0

Globally Unique Identifier (entire table): ba.freestatistics.org/blog/index.php?pk=156034&T=0

As an alternative you can also use a QR Code:  

The GUIDs for individual cells are displayed in the table below:

Summary of computational transaction
Raw Inputview raw input (R code)
Raw Outputview raw output of R engine
Computing time1 seconds
R Server'Gertrude Mary Cox' @ cox.wessa.net


Estimated Parameters of Exponential Smoothing
ParameterValue
alpha0.624527323641325
beta0.0584944495105362
gamma1

\begin{tabular}{lllllllll}
\hline
Estimated Parameters of Exponential Smoothing \tabularnewline
Parameter & Value \tabularnewline
alpha & 0.624527323641325 \tabularnewline
beta & 0.0584944495105362 \tabularnewline
gamma & 1 \tabularnewline
\hline
\end{tabular}
%Source: https://freestatistics.org/blog/index.php?pk=156034&T=1

[TABLE]
[ROW][C]Estimated Parameters of Exponential Smoothing[/C][/ROW]
[ROW][C]Parameter[/C][C]Value[/C][/ROW]
[ROW][C]alpha[/C][C]0.624527323641325[/C][/ROW]
[ROW][C]beta[/C][C]0.0584944495105362[/C][/ROW]
[ROW][C]gamma[/C][C]1[/C][/ROW]
[/TABLE]
Source: https://freestatistics.org/blog/index.php?pk=156034&T=1

Globally Unique Identifier (entire table): ba.freestatistics.org/blog/index.php?pk=156034&T=1

As an alternative you can also use a QR Code:  

The GUIDs for individual cells are displayed in the table below:

Estimated Parameters of Exponential Smoothing
ParameterValue
alpha0.624527323641325
beta0.0584944495105362
gamma1


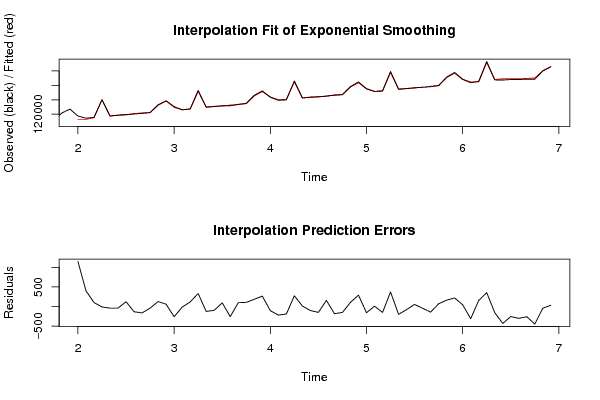
Interpolation Forecasts of Exponential Smoothing
tObservedFittedResiduals
13119369.88118223.9408199791145.93918002138
14118622118221.587820264400.412179736173
15118885118783.307115321101.692884679112
16124998.3125009.5246968-11.2246967995889
17119369119409.747109639-40.7471096387308
18119647119686.184254106-39.1842541056976
19119879119756.612656267122.387343732524
20120075120207.13291481-132.132914809539
21120295120457.542152819-162.542152819413
22120538120579.032517992-41.0325179918
23123250.68123123.346662277127.333337722812
24124631.03124571.8711299659.1588700403081
25122443.31122702.895452613-259.585452613494
26121532121547.378352222-15.3783522215672
27121844121726.624217758117.375782241565
28128241.75127910.171700469331.578299531466
29122391122515.855128707-124.855128706738
30122644122739.73478143-95.7347814297245
31122927122832.82914021194.1708597892284
32122909123166.448829573-257.448829572793
33123417123318.88585187398.1141481267259
34123756123650.017716888105.982283112418
35126540.18126355.965023783184.214976216579
36128088.74127823.095567832265.644432168076
37125874.28125979.618773772-105.33877377196
38124817125033.983668515-216.983668515488
39124961125151.659770825-190.659770825165
40131499.9131226.497577208273.402422791987
41125639125625.58480555513.4151944446639
42125851125952.917659448-101.917659447965
43125970126119.394863838-149.3948638375
44126322126165.91956788156.080432119561
45126540126722.269941525-182.269941524704
46126733126883.154578293-150.154578293266
47129557.34129451.060648934106.279351065561
48131179.77130889.794698884289.975301115875
49128754.8128912.809877872-158.009877871998
50127890127881.0272110848.97278891627502
51127996128146.624290569-150.624290568841
52134790.6134419.091664782371.508335217892
53128585128783.798202828-198.798202827849
54128851128929.508794901-78.5087949007866
55129142129087.84937853354.150621466848
56129334129378.697521281-44.6975212809775
57129536129677.786655184-141.786655183692
58129944129872.66296068771.3370393132645
59132842.76132679.922236018162.837763982039
60134447.96134229.759230977218.200769023242
61132088.81132043.92889731744.881102682848
62130902131213.152346235-311.152346234943
63131374131218.801301485155.198698515072
64138243137889.38527166353.614728339628
65131885132039.203811582-154.203811582294
66131839132269.980870618-430.980870617903
67132002132257.177371426-255.177371426194
68132005132305.601148037-300.601148036803
69132127132386.942838818-259.942838817631
70132116132562.25877543-446.258775430091
71134993.94135035.922125679-41.9821256792929
72136459.55136426.4492270133.1007729896519

\begin{tabular}{lllllllll}
\hline
Interpolation Forecasts of Exponential Smoothing \tabularnewline
t & Observed & Fitted & Residuals \tabularnewline
13 & 119369.88 & 118223.940819979 & 1145.93918002138 \tabularnewline
14 & 118622 & 118221.587820264 & 400.412179736173 \tabularnewline
15 & 118885 & 118783.307115321 & 101.692884679112 \tabularnewline
16 & 124998.3 & 125009.5246968 & -11.2246967995889 \tabularnewline
17 & 119369 & 119409.747109639 & -40.7471096387308 \tabularnewline
18 & 119647 & 119686.184254106 & -39.1842541056976 \tabularnewline
19 & 119879 & 119756.612656267 & 122.387343732524 \tabularnewline
20 & 120075 & 120207.13291481 & -132.132914809539 \tabularnewline
21 & 120295 & 120457.542152819 & -162.542152819413 \tabularnewline
22 & 120538 & 120579.032517992 & -41.0325179918 \tabularnewline
23 & 123250.68 & 123123.346662277 & 127.333337722812 \tabularnewline
24 & 124631.03 & 124571.87112996 & 59.1588700403081 \tabularnewline
25 & 122443.31 & 122702.895452613 & -259.585452613494 \tabularnewline
26 & 121532 & 121547.378352222 & -15.3783522215672 \tabularnewline
27 & 121844 & 121726.624217758 & 117.375782241565 \tabularnewline
28 & 128241.75 & 127910.171700469 & 331.578299531466 \tabularnewline
29 & 122391 & 122515.855128707 & -124.855128706738 \tabularnewline
30 & 122644 & 122739.73478143 & -95.7347814297245 \tabularnewline
31 & 122927 & 122832.829140211 & 94.1708597892284 \tabularnewline
32 & 122909 & 123166.448829573 & -257.448829572793 \tabularnewline
33 & 123417 & 123318.885851873 & 98.1141481267259 \tabularnewline
34 & 123756 & 123650.017716888 & 105.982283112418 \tabularnewline
35 & 126540.18 & 126355.965023783 & 184.214976216579 \tabularnewline
36 & 128088.74 & 127823.095567832 & 265.644432168076 \tabularnewline
37 & 125874.28 & 125979.618773772 & -105.33877377196 \tabularnewline
38 & 124817 & 125033.983668515 & -216.983668515488 \tabularnewline
39 & 124961 & 125151.659770825 & -190.659770825165 \tabularnewline
40 & 131499.9 & 131226.497577208 & 273.402422791987 \tabularnewline
41 & 125639 & 125625.584805555 & 13.4151944446639 \tabularnewline
42 & 125851 & 125952.917659448 & -101.917659447965 \tabularnewline
43 & 125970 & 126119.394863838 & -149.3948638375 \tabularnewline
44 & 126322 & 126165.91956788 & 156.080432119561 \tabularnewline
45 & 126540 & 126722.269941525 & -182.269941524704 \tabularnewline
46 & 126733 & 126883.154578293 & -150.154578293266 \tabularnewline
47 & 129557.34 & 129451.060648934 & 106.279351065561 \tabularnewline
48 & 131179.77 & 130889.794698884 & 289.975301115875 \tabularnewline
49 & 128754.8 & 128912.809877872 & -158.009877871998 \tabularnewline
50 & 127890 & 127881.027211084 & 8.97278891627502 \tabularnewline
51 & 127996 & 128146.624290569 & -150.624290568841 \tabularnewline
52 & 134790.6 & 134419.091664782 & 371.508335217892 \tabularnewline
53 & 128585 & 128783.798202828 & -198.798202827849 \tabularnewline
54 & 128851 & 128929.508794901 & -78.5087949007866 \tabularnewline
55 & 129142 & 129087.849378533 & 54.150621466848 \tabularnewline
56 & 129334 & 129378.697521281 & -44.6975212809775 \tabularnewline
57 & 129536 & 129677.786655184 & -141.786655183692 \tabularnewline
58 & 129944 & 129872.662960687 & 71.3370393132645 \tabularnewline
59 & 132842.76 & 132679.922236018 & 162.837763982039 \tabularnewline
60 & 134447.96 & 134229.759230977 & 218.200769023242 \tabularnewline
61 & 132088.81 & 132043.928897317 & 44.881102682848 \tabularnewline
62 & 130902 & 131213.152346235 & -311.152346234943 \tabularnewline
63 & 131374 & 131218.801301485 & 155.198698515072 \tabularnewline
64 & 138243 & 137889.38527166 & 353.614728339628 \tabularnewline
65 & 131885 & 132039.203811582 & -154.203811582294 \tabularnewline
66 & 131839 & 132269.980870618 & -430.980870617903 \tabularnewline
67 & 132002 & 132257.177371426 & -255.177371426194 \tabularnewline
68 & 132005 & 132305.601148037 & -300.601148036803 \tabularnewline
69 & 132127 & 132386.942838818 & -259.942838817631 \tabularnewline
70 & 132116 & 132562.25877543 & -446.258775430091 \tabularnewline
71 & 134993.94 & 135035.922125679 & -41.9821256792929 \tabularnewline
72 & 136459.55 & 136426.44922701 & 33.1007729896519 \tabularnewline
\hline
\end{tabular}
%Source: https://freestatistics.org/blog/index.php?pk=156034&T=2

[TABLE]
[ROW][C]Interpolation Forecasts of Exponential Smoothing[/C][/ROW]
[ROW][C]t[/C][C]Observed[/C][C]Fitted[/C][C]Residuals[/C][/ROW]
[ROW][C]13[/C][C]119369.88[/C][C]118223.940819979[/C][C]1145.93918002138[/C][/ROW]
[ROW][C]14[/C][C]118622[/C][C]118221.587820264[/C][C]400.412179736173[/C][/ROW]
[ROW][C]15[/C][C]118885[/C][C]118783.307115321[/C][C]101.692884679112[/C][/ROW]
[ROW][C]16[/C][C]124998.3[/C][C]125009.5246968[/C][C]-11.2246967995889[/C][/ROW]
[ROW][C]17[/C][C]119369[/C][C]119409.747109639[/C][C]-40.7471096387308[/C][/ROW]
[ROW][C]18[/C][C]119647[/C][C]119686.184254106[/C][C]-39.1842541056976[/C][/ROW]
[ROW][C]19[/C][C]119879[/C][C]119756.612656267[/C][C]122.387343732524[/C][/ROW]
[ROW][C]20[/C][C]120075[/C][C]120207.13291481[/C][C]-132.132914809539[/C][/ROW]
[ROW][C]21[/C][C]120295[/C][C]120457.542152819[/C][C]-162.542152819413[/C][/ROW]
[ROW][C]22[/C][C]120538[/C][C]120579.032517992[/C][C]-41.0325179918[/C][/ROW]
[ROW][C]23[/C][C]123250.68[/C][C]123123.346662277[/C][C]127.333337722812[/C][/ROW]
[ROW][C]24[/C][C]124631.03[/C][C]124571.87112996[/C][C]59.1588700403081[/C][/ROW]
[ROW][C]25[/C][C]122443.31[/C][C]122702.895452613[/C][C]-259.585452613494[/C][/ROW]
[ROW][C]26[/C][C]121532[/C][C]121547.378352222[/C][C]-15.3783522215672[/C][/ROW]
[ROW][C]27[/C][C]121844[/C][C]121726.624217758[/C][C]117.375782241565[/C][/ROW]
[ROW][C]28[/C][C]128241.75[/C][C]127910.171700469[/C][C]331.578299531466[/C][/ROW]
[ROW][C]29[/C][C]122391[/C][C]122515.855128707[/C][C]-124.855128706738[/C][/ROW]
[ROW][C]30[/C][C]122644[/C][C]122739.73478143[/C][C]-95.7347814297245[/C][/ROW]
[ROW][C]31[/C][C]122927[/C][C]122832.829140211[/C][C]94.1708597892284[/C][/ROW]
[ROW][C]32[/C][C]122909[/C][C]123166.448829573[/C][C]-257.448829572793[/C][/ROW]
[ROW][C]33[/C][C]123417[/C][C]123318.885851873[/C][C]98.1141481267259[/C][/ROW]
[ROW][C]34[/C][C]123756[/C][C]123650.017716888[/C][C]105.982283112418[/C][/ROW]
[ROW][C]35[/C][C]126540.18[/C][C]126355.965023783[/C][C]184.214976216579[/C][/ROW]
[ROW][C]36[/C][C]128088.74[/C][C]127823.095567832[/C][C]265.644432168076[/C][/ROW]
[ROW][C]37[/C][C]125874.28[/C][C]125979.618773772[/C][C]-105.33877377196[/C][/ROW]
[ROW][C]38[/C][C]124817[/C][C]125033.983668515[/C][C]-216.983668515488[/C][/ROW]
[ROW][C]39[/C][C]124961[/C][C]125151.659770825[/C][C]-190.659770825165[/C][/ROW]
[ROW][C]40[/C][C]131499.9[/C][C]131226.497577208[/C][C]273.402422791987[/C][/ROW]
[ROW][C]41[/C][C]125639[/C][C]125625.584805555[/C][C]13.4151944446639[/C][/ROW]
[ROW][C]42[/C][C]125851[/C][C]125952.917659448[/C][C]-101.917659447965[/C][/ROW]
[ROW][C]43[/C][C]125970[/C][C]126119.394863838[/C][C]-149.3948638375[/C][/ROW]
[ROW][C]44[/C][C]126322[/C][C]126165.91956788[/C][C]156.080432119561[/C][/ROW]
[ROW][C]45[/C][C]126540[/C][C]126722.269941525[/C][C]-182.269941524704[/C][/ROW]
[ROW][C]46[/C][C]126733[/C][C]126883.154578293[/C][C]-150.154578293266[/C][/ROW]
[ROW][C]47[/C][C]129557.34[/C][C]129451.060648934[/C][C]106.279351065561[/C][/ROW]
[ROW][C]48[/C][C]131179.77[/C][C]130889.794698884[/C][C]289.975301115875[/C][/ROW]
[ROW][C]49[/C][C]128754.8[/C][C]128912.809877872[/C][C]-158.009877871998[/C][/ROW]
[ROW][C]50[/C][C]127890[/C][C]127881.027211084[/C][C]8.97278891627502[/C][/ROW]
[ROW][C]51[/C][C]127996[/C][C]128146.624290569[/C][C]-150.624290568841[/C][/ROW]
[ROW][C]52[/C][C]134790.6[/C][C]134419.091664782[/C][C]371.508335217892[/C][/ROW]
[ROW][C]53[/C][C]128585[/C][C]128783.798202828[/C][C]-198.798202827849[/C][/ROW]
[ROW][C]54[/C][C]128851[/C][C]128929.508794901[/C][C]-78.5087949007866[/C][/ROW]
[ROW][C]55[/C][C]129142[/C][C]129087.849378533[/C][C]54.150621466848[/C][/ROW]
[ROW][C]56[/C][C]129334[/C][C]129378.697521281[/C][C]-44.6975212809775[/C][/ROW]
[ROW][C]57[/C][C]129536[/C][C]129677.786655184[/C][C]-141.786655183692[/C][/ROW]
[ROW][C]58[/C][C]129944[/C][C]129872.662960687[/C][C]71.3370393132645[/C][/ROW]
[ROW][C]59[/C][C]132842.76[/C][C]132679.922236018[/C][C]162.837763982039[/C][/ROW]
[ROW][C]60[/C][C]134447.96[/C][C]134229.759230977[/C][C]218.200769023242[/C][/ROW]
[ROW][C]61[/C][C]132088.81[/C][C]132043.928897317[/C][C]44.881102682848[/C][/ROW]
[ROW][C]62[/C][C]130902[/C][C]131213.152346235[/C][C]-311.152346234943[/C][/ROW]
[ROW][C]63[/C][C]131374[/C][C]131218.801301485[/C][C]155.198698515072[/C][/ROW]
[ROW][C]64[/C][C]138243[/C][C]137889.38527166[/C][C]353.614728339628[/C][/ROW]
[ROW][C]65[/C][C]131885[/C][C]132039.203811582[/C][C]-154.203811582294[/C][/ROW]
[ROW][C]66[/C][C]131839[/C][C]132269.980870618[/C][C]-430.980870617903[/C][/ROW]
[ROW][C]67[/C][C]132002[/C][C]132257.177371426[/C][C]-255.177371426194[/C][/ROW]
[ROW][C]68[/C][C]132005[/C][C]132305.601148037[/C][C]-300.601148036803[/C][/ROW]
[ROW][C]69[/C][C]132127[/C][C]132386.942838818[/C][C]-259.942838817631[/C][/ROW]
[ROW][C]70[/C][C]132116[/C][C]132562.25877543[/C][C]-446.258775430091[/C][/ROW]
[ROW][C]71[/C][C]134993.94[/C][C]135035.922125679[/C][C]-41.9821256792929[/C][/ROW]
[ROW][C]72[/C][C]136459.55[/C][C]136426.44922701[/C][C]33.1007729896519[/C][/ROW]
[/TABLE]
Source: https://freestatistics.org/blog/index.php?pk=156034&T=2

Globally Unique Identifier (entire table): ba.freestatistics.org/blog/index.php?pk=156034&T=2

As an alternative you can also use a QR Code:  

The GUIDs for individual cells are displayed in the table below:

Interpolation Forecasts of Exponential Smoothing
tObservedFittedResiduals
13119369.88118223.9408199791145.93918002138
14118622118221.587820264400.412179736173
15118885118783.307115321101.692884679112
16124998.3125009.5246968-11.2246967995889
17119369119409.747109639-40.7471096387308
18119647119686.184254106-39.1842541056976
19119879119756.612656267122.387343732524
20120075120207.13291481-132.132914809539
21120295120457.542152819-162.542152819413
22120538120579.032517992-41.0325179918
23123250.68123123.346662277127.333337722812
24124631.03124571.8711299659.1588700403081
25122443.31122702.895452613-259.585452613494
26121532121547.378352222-15.3783522215672
27121844121726.624217758117.375782241565
28128241.75127910.171700469331.578299531466
29122391122515.855128707-124.855128706738
30122644122739.73478143-95.7347814297245
31122927122832.82914021194.1708597892284
32122909123166.448829573-257.448829572793
33123417123318.88585187398.1141481267259
34123756123650.017716888105.982283112418
35126540.18126355.965023783184.214976216579
36128088.74127823.095567832265.644432168076
37125874.28125979.618773772-105.33877377196
38124817125033.983668515-216.983668515488
39124961125151.659770825-190.659770825165
40131499.9131226.497577208273.402422791987
41125639125625.58480555513.4151944446639
42125851125952.917659448-101.917659447965
43125970126119.394863838-149.3948638375
44126322126165.91956788156.080432119561
45126540126722.269941525-182.269941524704
46126733126883.154578293-150.154578293266
47129557.34129451.060648934106.279351065561
48131179.77130889.794698884289.975301115875
49128754.8128912.809877872-158.009877871998
50127890127881.0272110848.97278891627502
51127996128146.624290569-150.624290568841
52134790.6134419.091664782371.508335217892
53128585128783.798202828-198.798202827849
54128851128929.508794901-78.5087949007866
55129142129087.84937853354.150621466848
56129334129378.697521281-44.6975212809775
57129536129677.786655184-141.786655183692
58129944129872.66296068771.3370393132645
59132842.76132679.922236018162.837763982039
60134447.96134229.759230977218.200769023242
61132088.81132043.92889731744.881102682848
62130902131213.152346235-311.152346234943
63131374131218.801301485155.198698515072
64138243137889.38527166353.614728339628
65131885132039.203811582-154.203811582294
66131839132269.980870618-430.980870617903
67132002132257.177371426-255.177371426194
68132005132305.601148037-300.601148036803
69132127132386.942838818-259.942838817631
70132116132562.25877543-446.258775430091
71134993.94135035.922125679-41.9821256792929
72136459.55136426.4492270133.1007729896519


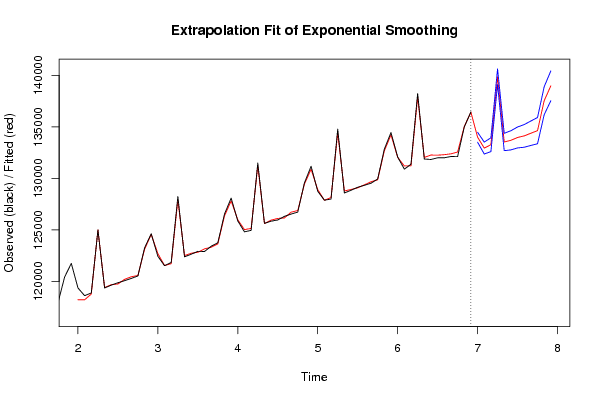
Extrapolation Forecasts of Exponential Smoothing
tForecast95% Lower Bound95% Upper Bound
73134000.998558789133518.260695904134483.736421674
74132947.928601674132369.247182565133526.610020784
75133273.786499926132604.253179199133943.319820652
76139867.058543162139109.519181367140624.597904956
77133537.559105308132693.599847809134381.518362808
78133698.547781727132768.977509665134628.118053788
79133974.486696128132959.603025949134989.370366306
80134128.115982198133027.864583478135228.367380918
81134386.334418598133200.410427755135572.25840944
82134637.408319384133365.32397816135909.492660609
83137541.242855888136182.374315532138900.111396243
84138987.389735705137541.010421494140433.769049915

\begin{tabular}{lllllllll}
\hline
Extrapolation Forecasts of Exponential Smoothing \tabularnewline
t & Forecast & 95% Lower Bound & 95% Upper Bound \tabularnewline
73 & 134000.998558789 & 133518.260695904 & 134483.736421674 \tabularnewline
74 & 132947.928601674 & 132369.247182565 & 133526.610020784 \tabularnewline
75 & 133273.786499926 & 132604.253179199 & 133943.319820652 \tabularnewline
76 & 139867.058543162 & 139109.519181367 & 140624.597904956 \tabularnewline
77 & 133537.559105308 & 132693.599847809 & 134381.518362808 \tabularnewline
78 & 133698.547781727 & 132768.977509665 & 134628.118053788 \tabularnewline
79 & 133974.486696128 & 132959.603025949 & 134989.370366306 \tabularnewline
80 & 134128.115982198 & 133027.864583478 & 135228.367380918 \tabularnewline
81 & 134386.334418598 & 133200.410427755 & 135572.25840944 \tabularnewline
82 & 134637.408319384 & 133365.32397816 & 135909.492660609 \tabularnewline
83 & 137541.242855888 & 136182.374315532 & 138900.111396243 \tabularnewline
84 & 138987.389735705 & 137541.010421494 & 140433.769049915 \tabularnewline
\hline
\end{tabular}
%Source: https://freestatistics.org/blog/index.php?pk=156034&T=3

[TABLE]
[ROW][C]Extrapolation Forecasts of Exponential Smoothing[/C][/ROW]
[ROW][C]t[/C][C]Forecast[/C][C]95% Lower Bound[/C][C]95% Upper Bound[/C][/ROW]
[ROW][C]73[/C][C]134000.998558789[/C][C]133518.260695904[/C][C]134483.736421674[/C][/ROW]
[ROW][C]74[/C][C]132947.928601674[/C][C]132369.247182565[/C][C]133526.610020784[/C][/ROW]
[ROW][C]75[/C][C]133273.786499926[/C][C]132604.253179199[/C][C]133943.319820652[/C][/ROW]
[ROW][C]76[/C][C]139867.058543162[/C][C]139109.519181367[/C][C]140624.597904956[/C][/ROW]
[ROW][C]77[/C][C]133537.559105308[/C][C]132693.599847809[/C][C]134381.518362808[/C][/ROW]
[ROW][C]78[/C][C]133698.547781727[/C][C]132768.977509665[/C][C]134628.118053788[/C][/ROW]
[ROW][C]79[/C][C]133974.486696128[/C][C]132959.603025949[/C][C]134989.370366306[/C][/ROW]
[ROW][C]80[/C][C]134128.115982198[/C][C]133027.864583478[/C][C]135228.367380918[/C][/ROW]
[ROW][C]81[/C][C]134386.334418598[/C][C]133200.410427755[/C][C]135572.25840944[/C][/ROW]
[ROW][C]82[/C][C]134637.408319384[/C][C]133365.32397816[/C][C]135909.492660609[/C][/ROW]
[ROW][C]83[/C][C]137541.242855888[/C][C]136182.374315532[/C][C]138900.111396243[/C][/ROW]
[ROW][C]84[/C][C]138987.389735705[/C][C]137541.010421494[/C][C]140433.769049915[/C][/ROW]
[/TABLE]
Source: https://freestatistics.org/blog/index.php?pk=156034&T=3

Globally Unique Identifier (entire table): ba.freestatistics.org/blog/index.php?pk=156034&T=3

As an alternative you can also use a QR Code:  

The GUIDs for individual cells are displayed in the table below:

Extrapolation Forecasts of Exponential Smoothing
tForecast95% Lower Bound95% Upper Bound
73134000.998558789133518.260695904134483.736421674
74132947.928601674132369.247182565133526.610020784
75133273.786499926132604.253179199133943.319820652
76139867.058543162139109.519181367140624.597904956
77133537.559105308132693.599847809134381.518362808
78133698.547781727132768.977509665134628.118053788
79133974.486696128132959.603025949134989.370366306
80134128.115982198133027.864583478135228.367380918
81134386.334418598133200.410427755135572.25840944
82134637.408319384133365.32397816135909.492660609
83137541.242855888136182.374315532138900.111396243
84138987.389735705137541.010421494140433.769049915


Parameters (Session):
par1 = 12 ; par2 = Triple ; par3 = additive ;
Parameters (R input):
par1 = 12 ; par2 = Triple ; par3 = additive ;
R code (references can be found in the software module):
par1 <- as.numeric(par1)
if (par2 == 'Single') K <- 1
if (par2 == 'Double') K <- 2
if (par2 == 'Triple') K <- par1
nx <- length(x)
nxmK <- nx - K
x <- ts(x, frequency = par1)
if (par2 == 'Single') fit <- HoltWinters(x, gamma=F, beta=F)
if (par2 == 'Double') fit <- HoltWinters(x, gamma=F)
if (par2 == 'Triple') fit <- HoltWinters(x, seasonal=par3)
fit
myresid <- x - fit$fitted[,'xhat']
bitmap(file='test1.png')
op <- par(mfrow=c(2,1))
plot(fit,ylab='Observed (black) / Fitted (red)',main='Interpolation Fit of Exponential Smoothing')
plot(myresid,ylab='Residuals',main='Interpolation Prediction Errors')
par(op)
dev.off()
bitmap(file='test2.png')
p <- predict(fit, par1, prediction.interval=TRUE)
np <- length(p[,1])
plot(fit,p,ylab='Observed (black) / Fitted (red)',main='Extrapolation Fit of Exponential Smoothing')
dev.off()
bitmap(file='test3.png')
op <- par(mfrow = c(2,2))
acf(as.numeric(myresid),lag.max = nx/2,main='Residual ACF')
spectrum(myresid,main='Residals Periodogram')
cpgram(myresid,main='Residal Cumulative Periodogram')
qqnorm(myresid,main='Residual Normal QQ Plot')
qqline(myresid)
par(op)
dev.off()
load(file='createtable')
a<-table.start()
a<-table.row.start(a)
a<-table.element(a,'Estimated Parameters of Exponential Smoothing',2,TRUE)
a<-table.row.end(a)
a<-table.row.start(a)
a<-table.element(a,'Parameter',header=TRUE)
a<-table.element(a,'Value',header=TRUE)
a<-table.row.end(a)
a<-table.row.start(a)
a<-table.element(a,'alpha',header=TRUE)
a<-table.element(a,fit$alpha)
a<-table.row.end(a)
a<-table.row.start(a)
a<-table.element(a,'beta',header=TRUE)
a<-table.element(a,fit$beta)
a<-table.row.end(a)
a<-table.row.start(a)
a<-table.element(a,'gamma',header=TRUE)
a<-table.element(a,fit$gamma)
a<-table.row.end(a)
a<-table.end(a)
table.save(a,file='mytable.tab')
a<-table.start()
a<-table.row.start(a)
a<-table.element(a,'Interpolation Forecasts of Exponential Smoothing',4,TRUE)
a<-table.row.end(a)
a<-table.row.start(a)
a<-table.element(a,'t',header=TRUE)
a<-table.element(a,'Observed',header=TRUE)
a<-table.element(a,'Fitted',header=TRUE)
a<-table.element(a,'Residuals',header=TRUE)
a<-table.row.end(a)
for (i in 1:nxmK) {
a<-table.row.start(a)
a<-table.element(a,i+K,header=TRUE)
a<-table.element(a,x[i+K])
a<-table.element(a,fit$fitted[i,'xhat'])
a<-table.element(a,myresid[i])
a<-table.row.end(a)
}
a<-table.end(a)
table.save(a,file='mytable1.tab')
a<-table.start()
a<-table.row.start(a)
a<-table.element(a,'Extrapolation Forecasts of Exponential Smoothing',4,TRUE)
a<-table.row.end(a)
a<-table.row.start(a)
a<-table.element(a,'t',header=TRUE)
a<-table.element(a,'Forecast',header=TRUE)
a<-table.element(a,'95% Lower Bound',header=TRUE)
a<-table.element(a,'95% Upper Bound',header=TRUE)
a<-table.row.end(a)
for (i in 1:np) {
a<-table.row.start(a)
a<-table.element(a,nx+i,header=TRUE)
a<-table.element(a,p[i,'fit'])
a<-table.element(a,p[i,'lwr'])
a<-table.element(a,p[i,'upr'])
a<-table.row.end(a)
}
a<-table.end(a)
table.save(a,file='mytable2.tab')