Free Statistics

of Irreproducible Research!

Author's title

Author*The author of this computation has been verified*
R Software Modulerwasp_multipleregression.wasp
Title produced by softwareMultiple Regression
Date of computationSat, 13 Dec 2014 10:56:41 +0000
Cite this page as followsStatistical Computations at FreeStatistics.org, Office for Research Development and Education, URL https://freestatistics.org/blog/index.php?v=date/2014/Dec/13/t1418468233u0hnph5mkehd8gi.htm/, Retrieved Sat, 11 May 2024 09:36:03 +0000
Statistical Computations at FreeStatistics.org, Office for Research Development and Education, URL https://freestatistics.org/blog/index.php?pk=266968, Retrieved Sat, 11 May 2024 09:36:03 +0000
QR Codes:

Original text written by user:
IsPrivate?No (this computation is public)
User-defined keywords
Estimated Impact117
Family? (F = Feedback message, R = changed R code, M = changed R Module, P = changed Parameters, D = changed Data)
-     [Multiple Regression] [] [2013-11-04 07:28:31] [0307e7a6407eb638caabc417e3a6b260]
- RM    [Multiple Regression] [] [2014-11-13 17:16:10] [d69b52d23ca73e15a0c741afa583703c]
-  MPD      [Multiple Regression] [huwelijken vs con...] [2014-12-13 10:56:41] [0ce3062f3159e08d115eba7e96d082ef] [Current]
-   P         [Multiple Regression] [aantal huwelijken...] [2014-12-13 11:05:02] [189b7d469e4e3b4e868a6af83e3b3816]
-    D          [Multiple Regression] [scheidingen vs co...] [2014-12-14 15:52:33] [189b7d469e4e3b4e868a6af83e3b3816]
-  M            [Multiple Regression] [] [2014-12-15 13:47:17] [78252ca1523d3477f114bddbfa59edb4]
-  MP           [Multiple Regression] [] [2014-12-15 14:06:54] [78252ca1523d3477f114bddbfa59edb4]
-  M D            [Multiple Regression] [] [2014-12-15 14:24:30] [78252ca1523d3477f114bddbfa59edb4]
-    D              [Multiple Regression] [] [2014-12-15 14:48:59] [78252ca1523d3477f114bddbfa59edb4]
- RMPD        [Exponential Smoothing] [] [2014-12-13 13:28:12] [189b7d469e4e3b4e868a6af83e3b3816]
- RMPD        [Exponential Smoothing] [] [2014-12-13 13:30:12] [189b7d469e4e3b4e868a6af83e3b3816]
- RMPD        [Exponential Smoothing] [] [2014-12-13 13:31:04] [189b7d469e4e3b4e868a6af83e3b3816]
- RMPD        [Exponential Smoothing] [] [2014-12-13 13:31:50] [189b7d469e4e3b4e868a6af83e3b3816]
- RMPD        [Exponential Smoothing] [] [2014-12-13 13:32:46] [189b7d469e4e3b4e868a6af83e3b3816]
- RMPD        [Exponential Smoothing] [] [2014-12-13 13:33:24] [189b7d469e4e3b4e868a6af83e3b3816]
Feedback Forum

Post a new message
Dataseries X:
7233 1
16789 1
13168 1
4969 1
7427 1
16670 1
13347 1
5859 1
7761 0
17855 1
13736 1
6261 1
7582 1
18036 1
13647 1
6296 1
7493 1
17603 1
13731 1
5986 1
7383 1
16733 1
13142 1
5883 1
7509 1
16250 1
13254 1
6283 1
7295 1
15665 1
12787 1
6030 1
6981 1
15453 1
12428 1
5572 0
7037 0
15878 0
12990 0
6205 1
7017 1
18259 1
13660 1
6187 1


Summary of computational transaction
Raw Inputview raw input (R code)
Raw Outputview raw output of R engine
Computing time5 seconds
R Server'Sir Ronald Aylmer Fisher' @ fisher.wessa.net

\begin{tabular}{lllllllll}
\hline
Summary of computational transaction \tabularnewline
Raw Input & view raw input (R code)  \tabularnewline
Raw Output & view raw output of R engine  \tabularnewline
Computing time & 5 seconds \tabularnewline
R Server & 'Sir Ronald Aylmer Fisher' @ fisher.wessa.net \tabularnewline
\hline
\end{tabular}
%Source: https://freestatistics.org/blog/index.php?pk=266968&T=0

[TABLE]
[ROW][C]Summary of computational transaction[/C][/ROW]
[ROW][C]Raw Input[/C][C]view raw input (R code) [/C][/ROW]
[ROW][C]Raw Output[/C][C]view raw output of R engine [/C][/ROW]
[ROW][C]Computing time[/C][C]5 seconds[/C][/ROW]
[ROW][C]R Server[/C][C]'Sir Ronald Aylmer Fisher' @ fisher.wessa.net[/C][/ROW]
[/TABLE]
Source: https://freestatistics.org/blog/index.php?pk=266968&T=0

Globally Unique Identifier (entire table): ba.freestatistics.org/blog/index.php?pk=266968&T=0

As an alternative you can also use a QR Code:  

The GUIDs for individual cells are displayed in the table below:

Summary of computational transaction
Raw Inputview raw input (R code)
Raw Outputview raw output of R engine
Computing time5 seconds
R Server'Sir Ronald Aylmer Fisher' @ fisher.wessa.net


Multiple Linear Regression - Estimated Regression Equation
aantal[t] = + 5646.19 + 342.292huwelijken[t] + 1411.75Q1[t] + 10878.2Q2[t] + 7305.36Q3[t] + e[t]

\begin{tabular}{lllllllll}
\hline
Multiple Linear Regression - Estimated Regression Equation \tabularnewline
aantal[t] =  +  5646.19 +  342.292huwelijken[t] +  1411.75Q1[t] +  10878.2Q2[t] +  7305.36Q3[t]  + e[t] \tabularnewline
\hline
\end{tabular}
%Source: https://freestatistics.org/blog/index.php?pk=266968&T=1

[TABLE]
[ROW][C]Multiple Linear Regression - Estimated Regression Equation[/C][/ROW]
[ROW][C]aantal[t] =  +  5646.19 +  342.292huwelijken[t] +  1411.75Q1[t] +  10878.2Q2[t] +  7305.36Q3[t]  + e[t][/C][/ROW]
[/TABLE]
Source: https://freestatistics.org/blog/index.php?pk=266968&T=1

Globally Unique Identifier (entire table): ba.freestatistics.org/blog/index.php?pk=266968&T=1

As an alternative you can also use a QR Code:  

The GUIDs for individual cells are displayed in the table below:

Multiple Linear Regression - Estimated Regression Equation
aantal[t] = + 5646.19 + 342.292huwelijken[t] + 1411.75Q1[t] + 10878.2Q2[t] + 7305.36Q3[t] + e[t]


Multiple Linear Regression - Ordinary Least Squares
VariableParameterS.D.T-STATH0: parameter = 02-tail p-value1-tail p-value
(Intercept)5646.19307.45218.368.51281e-214.25641e-21
huwelijken342.292277.9971.2310.2255920.112796
Q11411.75248.9045.6721.47896e-067.3948e-07
Q210878.2247.61843.937.86871e-353.93436e-35
Q37305.36247.61829.52.77145e-281.38572e-28

\begin{tabular}{lllllllll}
\hline
Multiple Linear Regression - Ordinary Least Squares \tabularnewline
Variable & Parameter & S.D. & T-STATH0: parameter = 0 & 2-tail p-value & 1-tail p-value \tabularnewline
(Intercept) & 5646.19 & 307.452 & 18.36 & 8.51281e-21 & 4.25641e-21 \tabularnewline
huwelijken & 342.292 & 277.997 & 1.231 & 0.225592 & 0.112796 \tabularnewline
Q1 & 1411.75 & 248.904 & 5.672 & 1.47896e-06 & 7.3948e-07 \tabularnewline
Q2 & 10878.2 & 247.618 & 43.93 & 7.86871e-35 & 3.93436e-35 \tabularnewline
Q3 & 7305.36 & 247.618 & 29.5 & 2.77145e-28 & 1.38572e-28 \tabularnewline
\hline
\end{tabular}
%Source: https://freestatistics.org/blog/index.php?pk=266968&T=2

[TABLE]
[ROW][C]Multiple Linear Regression - Ordinary Least Squares[/C][/ROW]
[ROW][C]Variable[/C][C]Parameter[/C][C]S.D.[/C][C]T-STATH0: parameter = 0[/C][C]2-tail p-value[/C][C]1-tail p-value[/C][/ROW]
[ROW][C](Intercept)[/C][C]5646.19[/C][C]307.452[/C][C]18.36[/C][C]8.51281e-21[/C][C]4.25641e-21[/C][/ROW]
[ROW][C]huwelijken[/C][C]342.292[/C][C]277.997[/C][C]1.231[/C][C]0.225592[/C][C]0.112796[/C][/ROW]
[ROW][C]Q1[/C][C]1411.75[/C][C]248.904[/C][C]5.672[/C][C]1.47896e-06[/C][C]7.3948e-07[/C][/ROW]
[ROW][C]Q2[/C][C]10878.2[/C][C]247.618[/C][C]43.93[/C][C]7.86871e-35[/C][C]3.93436e-35[/C][/ROW]
[ROW][C]Q3[/C][C]7305.36[/C][C]247.618[/C][C]29.5[/C][C]2.77145e-28[/C][C]1.38572e-28[/C][/ROW]
[/TABLE]
Source: https://freestatistics.org/blog/index.php?pk=266968&T=2

Globally Unique Identifier (entire table): ba.freestatistics.org/blog/index.php?pk=266968&T=2

As an alternative you can also use a QR Code:  

The GUIDs for individual cells are displayed in the table below:

Multiple Linear Regression - Ordinary Least Squares
VariableParameterS.D.T-STATH0: parameter = 02-tail p-value1-tail p-value
(Intercept)5646.19307.45218.368.51281e-214.25641e-21
huwelijken342.292277.9971.2310.2255920.112796
Q11411.75248.9045.6721.47896e-067.3948e-07
Q210878.2247.61843.937.86871e-353.93436e-35
Q37305.36247.61829.52.77145e-281.38572e-28


Multiple Linear Regression - Regression Statistics
Multiple R0.992419
R-squared0.984896
Adjusted R-squared0.983347
F-TEST (value)635.789
F-TEST (DF numerator)4
F-TEST (DF denominator)39
p-value0
Multiple Linear Regression - Residual Statistics
Residual Standard Deviation580.716
Sum Squared Residuals13152000

\begin{tabular}{lllllllll}
\hline
Multiple Linear Regression - Regression Statistics \tabularnewline
Multiple R & 0.992419 \tabularnewline
R-squared & 0.984896 \tabularnewline
Adjusted R-squared & 0.983347 \tabularnewline
F-TEST (value) & 635.789 \tabularnewline
F-TEST (DF numerator) & 4 \tabularnewline
F-TEST (DF denominator) & 39 \tabularnewline
p-value & 0 \tabularnewline
Multiple Linear Regression - Residual Statistics \tabularnewline
Residual Standard Deviation & 580.716 \tabularnewline
Sum Squared Residuals & 13152000 \tabularnewline
\hline
\end{tabular}
%Source: https://freestatistics.org/blog/index.php?pk=266968&T=3

[TABLE]
[ROW][C]Multiple Linear Regression - Regression Statistics[/C][/ROW]
[ROW][C]Multiple R[/C][C]0.992419[/C][/ROW]
[ROW][C]R-squared[/C][C]0.984896[/C][/ROW]
[ROW][C]Adjusted R-squared[/C][C]0.983347[/C][/ROW]
[ROW][C]F-TEST (value)[/C][C]635.789[/C][/ROW]
[ROW][C]F-TEST (DF numerator)[/C][C]4[/C][/ROW]
[ROW][C]F-TEST (DF denominator)[/C][C]39[/C][/ROW]
[ROW][C]p-value[/C][C]0[/C][/ROW]
[ROW][C]Multiple Linear Regression - Residual Statistics[/C][/ROW]
[ROW][C]Residual Standard Deviation[/C][C]580.716[/C][/ROW]
[ROW][C]Sum Squared Residuals[/C][C]13152000[/C][/ROW]
[/TABLE]
Source: https://freestatistics.org/blog/index.php?pk=266968&T=3

Globally Unique Identifier (entire table): ba.freestatistics.org/blog/index.php?pk=266968&T=3

As an alternative you can also use a QR Code:  

The GUIDs for individual cells are displayed in the table below:

Multiple Linear Regression - Regression Statistics
Multiple R0.992419
R-squared0.984896
Adjusted R-squared0.983347
F-TEST (value)635.789
F-TEST (DF numerator)4
F-TEST (DF denominator)39
p-value0
Multiple Linear Regression - Residual Statistics
Residual Standard Deviation580.716
Sum Squared Residuals13152000


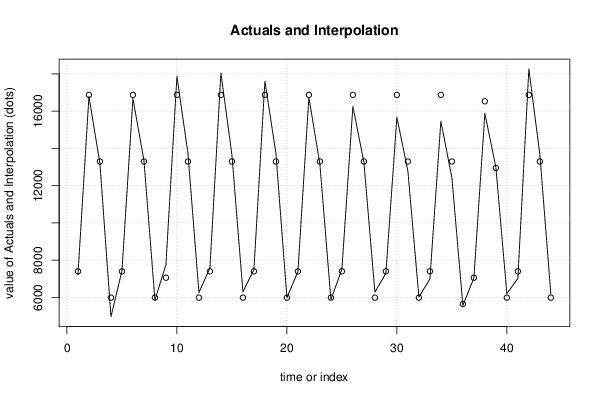
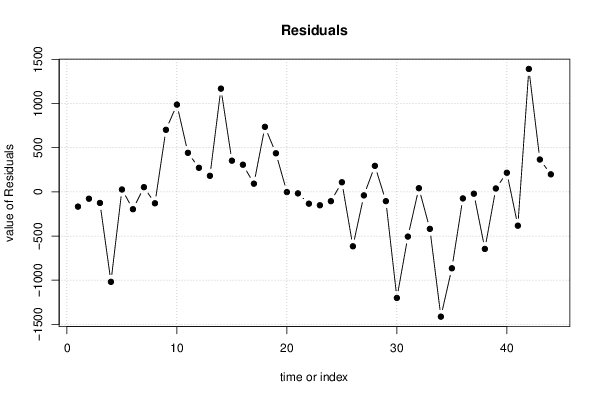
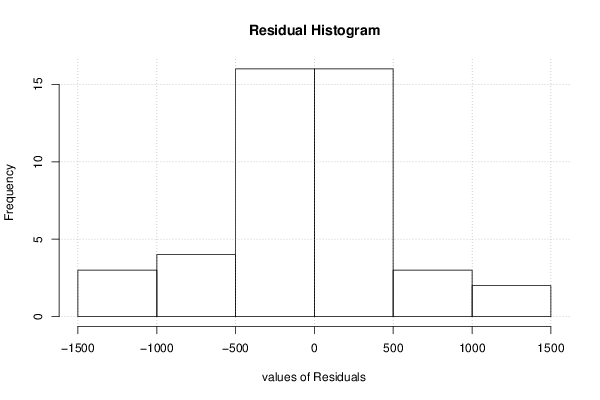
Multiple Linear Regression - Actuals, Interpolation, and Residuals
Time or IndexActualsInterpolationForecastResidualsPrediction Error
172337400.23-167.235
21678916866.7-77.6629
31316813293.8-125.845
449695988.48-1019.48
574277400.2326.7652
61667016866.7-196.663
71334713293.853.1553
858595988.48-129.481
977617057.94703.057
101785516866.7988.337
111373613293.8442.155
1262615988.48272.519
1375827400.23181.765
141803616866.71169.34
151364713293.8353.155
1662965988.48307.519
1774937400.2392.7652
181760316866.7736.337
191373113293.8437.155
2059865988.48-2.48106
2173837400.23-17.2348
221673316866.7-133.663
231314213293.8-151.845
2458835988.48-105.481
2575097400.23108.765
261625016866.7-616.663
271325413293.8-39.8447
2862835988.48294.519
2972957400.23-105.235
301566516866.7-1201.66
311278713293.8-506.845
3260305988.4841.5189
3369817400.23-419.235
341545316866.7-1413.66
351242813293.8-865.845
3655725646.19-74.1894
3770377057.94-20.9432
381587816524.4-646.371
391299012951.638.447
4062055988.48216.519
4170177400.23-383.235
421825916866.71392.34
431366013293.8366.155
4461875988.48198.519

\begin{tabular}{lllllllll}
\hline
Multiple Linear Regression - Actuals, Interpolation, and Residuals \tabularnewline
Time or Index & Actuals & InterpolationForecast & ResidualsPrediction Error \tabularnewline
1 & 7233 & 7400.23 & -167.235 \tabularnewline
2 & 16789 & 16866.7 & -77.6629 \tabularnewline
3 & 13168 & 13293.8 & -125.845 \tabularnewline
4 & 4969 & 5988.48 & -1019.48 \tabularnewline
5 & 7427 & 7400.23 & 26.7652 \tabularnewline
6 & 16670 & 16866.7 & -196.663 \tabularnewline
7 & 13347 & 13293.8 & 53.1553 \tabularnewline
8 & 5859 & 5988.48 & -129.481 \tabularnewline
9 & 7761 & 7057.94 & 703.057 \tabularnewline
10 & 17855 & 16866.7 & 988.337 \tabularnewline
11 & 13736 & 13293.8 & 442.155 \tabularnewline
12 & 6261 & 5988.48 & 272.519 \tabularnewline
13 & 7582 & 7400.23 & 181.765 \tabularnewline
14 & 18036 & 16866.7 & 1169.34 \tabularnewline
15 & 13647 & 13293.8 & 353.155 \tabularnewline
16 & 6296 & 5988.48 & 307.519 \tabularnewline
17 & 7493 & 7400.23 & 92.7652 \tabularnewline
18 & 17603 & 16866.7 & 736.337 \tabularnewline
19 & 13731 & 13293.8 & 437.155 \tabularnewline
20 & 5986 & 5988.48 & -2.48106 \tabularnewline
21 & 7383 & 7400.23 & -17.2348 \tabularnewline
22 & 16733 & 16866.7 & -133.663 \tabularnewline
23 & 13142 & 13293.8 & -151.845 \tabularnewline
24 & 5883 & 5988.48 & -105.481 \tabularnewline
25 & 7509 & 7400.23 & 108.765 \tabularnewline
26 & 16250 & 16866.7 & -616.663 \tabularnewline
27 & 13254 & 13293.8 & -39.8447 \tabularnewline
28 & 6283 & 5988.48 & 294.519 \tabularnewline
29 & 7295 & 7400.23 & -105.235 \tabularnewline
30 & 15665 & 16866.7 & -1201.66 \tabularnewline
31 & 12787 & 13293.8 & -506.845 \tabularnewline
32 & 6030 & 5988.48 & 41.5189 \tabularnewline
33 & 6981 & 7400.23 & -419.235 \tabularnewline
34 & 15453 & 16866.7 & -1413.66 \tabularnewline
35 & 12428 & 13293.8 & -865.845 \tabularnewline
36 & 5572 & 5646.19 & -74.1894 \tabularnewline
37 & 7037 & 7057.94 & -20.9432 \tabularnewline
38 & 15878 & 16524.4 & -646.371 \tabularnewline
39 & 12990 & 12951.6 & 38.447 \tabularnewline
40 & 6205 & 5988.48 & 216.519 \tabularnewline
41 & 7017 & 7400.23 & -383.235 \tabularnewline
42 & 18259 & 16866.7 & 1392.34 \tabularnewline
43 & 13660 & 13293.8 & 366.155 \tabularnewline
44 & 6187 & 5988.48 & 198.519 \tabularnewline
\hline
\end{tabular}
%Source: https://freestatistics.org/blog/index.php?pk=266968&T=4

[TABLE]
[ROW][C]Multiple Linear Regression - Actuals, Interpolation, and Residuals[/C][/ROW]
[ROW][C]Time or Index[/C][C]Actuals[/C][C]InterpolationForecast[/C][C]ResidualsPrediction Error[/C][/ROW]
[ROW][C]1[/C][C]7233[/C][C]7400.23[/C][C]-167.235[/C][/ROW]
[ROW][C]2[/C][C]16789[/C][C]16866.7[/C][C]-77.6629[/C][/ROW]
[ROW][C]3[/C][C]13168[/C][C]13293.8[/C][C]-125.845[/C][/ROW]
[ROW][C]4[/C][C]4969[/C][C]5988.48[/C][C]-1019.48[/C][/ROW]
[ROW][C]5[/C][C]7427[/C][C]7400.23[/C][C]26.7652[/C][/ROW]
[ROW][C]6[/C][C]16670[/C][C]16866.7[/C][C]-196.663[/C][/ROW]
[ROW][C]7[/C][C]13347[/C][C]13293.8[/C][C]53.1553[/C][/ROW]
[ROW][C]8[/C][C]5859[/C][C]5988.48[/C][C]-129.481[/C][/ROW]
[ROW][C]9[/C][C]7761[/C][C]7057.94[/C][C]703.057[/C][/ROW]
[ROW][C]10[/C][C]17855[/C][C]16866.7[/C][C]988.337[/C][/ROW]
[ROW][C]11[/C][C]13736[/C][C]13293.8[/C][C]442.155[/C][/ROW]
[ROW][C]12[/C][C]6261[/C][C]5988.48[/C][C]272.519[/C][/ROW]
[ROW][C]13[/C][C]7582[/C][C]7400.23[/C][C]181.765[/C][/ROW]
[ROW][C]14[/C][C]18036[/C][C]16866.7[/C][C]1169.34[/C][/ROW]
[ROW][C]15[/C][C]13647[/C][C]13293.8[/C][C]353.155[/C][/ROW]
[ROW][C]16[/C][C]6296[/C][C]5988.48[/C][C]307.519[/C][/ROW]
[ROW][C]17[/C][C]7493[/C][C]7400.23[/C][C]92.7652[/C][/ROW]
[ROW][C]18[/C][C]17603[/C][C]16866.7[/C][C]736.337[/C][/ROW]
[ROW][C]19[/C][C]13731[/C][C]13293.8[/C][C]437.155[/C][/ROW]
[ROW][C]20[/C][C]5986[/C][C]5988.48[/C][C]-2.48106[/C][/ROW]
[ROW][C]21[/C][C]7383[/C][C]7400.23[/C][C]-17.2348[/C][/ROW]
[ROW][C]22[/C][C]16733[/C][C]16866.7[/C][C]-133.663[/C][/ROW]
[ROW][C]23[/C][C]13142[/C][C]13293.8[/C][C]-151.845[/C][/ROW]
[ROW][C]24[/C][C]5883[/C][C]5988.48[/C][C]-105.481[/C][/ROW]
[ROW][C]25[/C][C]7509[/C][C]7400.23[/C][C]108.765[/C][/ROW]
[ROW][C]26[/C][C]16250[/C][C]16866.7[/C][C]-616.663[/C][/ROW]
[ROW][C]27[/C][C]13254[/C][C]13293.8[/C][C]-39.8447[/C][/ROW]
[ROW][C]28[/C][C]6283[/C][C]5988.48[/C][C]294.519[/C][/ROW]
[ROW][C]29[/C][C]7295[/C][C]7400.23[/C][C]-105.235[/C][/ROW]
[ROW][C]30[/C][C]15665[/C][C]16866.7[/C][C]-1201.66[/C][/ROW]
[ROW][C]31[/C][C]12787[/C][C]13293.8[/C][C]-506.845[/C][/ROW]
[ROW][C]32[/C][C]6030[/C][C]5988.48[/C][C]41.5189[/C][/ROW]
[ROW][C]33[/C][C]6981[/C][C]7400.23[/C][C]-419.235[/C][/ROW]
[ROW][C]34[/C][C]15453[/C][C]16866.7[/C][C]-1413.66[/C][/ROW]
[ROW][C]35[/C][C]12428[/C][C]13293.8[/C][C]-865.845[/C][/ROW]
[ROW][C]36[/C][C]5572[/C][C]5646.19[/C][C]-74.1894[/C][/ROW]
[ROW][C]37[/C][C]7037[/C][C]7057.94[/C][C]-20.9432[/C][/ROW]
[ROW][C]38[/C][C]15878[/C][C]16524.4[/C][C]-646.371[/C][/ROW]
[ROW][C]39[/C][C]12990[/C][C]12951.6[/C][C]38.447[/C][/ROW]
[ROW][C]40[/C][C]6205[/C][C]5988.48[/C][C]216.519[/C][/ROW]
[ROW][C]41[/C][C]7017[/C][C]7400.23[/C][C]-383.235[/C][/ROW]
[ROW][C]42[/C][C]18259[/C][C]16866.7[/C][C]1392.34[/C][/ROW]
[ROW][C]43[/C][C]13660[/C][C]13293.8[/C][C]366.155[/C][/ROW]
[ROW][C]44[/C][C]6187[/C][C]5988.48[/C][C]198.519[/C][/ROW]
[/TABLE]
Source: https://freestatistics.org/blog/index.php?pk=266968&T=4

Globally Unique Identifier (entire table): ba.freestatistics.org/blog/index.php?pk=266968&T=4

As an alternative you can also use a QR Code:  

The GUIDs for individual cells are displayed in the table below:

Multiple Linear Regression - Actuals, Interpolation, and Residuals
Time or IndexActualsInterpolationForecastResidualsPrediction Error
172337400.23-167.235
21678916866.7-77.6629
31316813293.8-125.845
449695988.48-1019.48
574277400.2326.7652
61667016866.7-196.663
71334713293.853.1553
858595988.48-129.481
977617057.94703.057
101785516866.7988.337
111373613293.8442.155
1262615988.48272.519
1375827400.23181.765
141803616866.71169.34
151364713293.8353.155
1662965988.48307.519
1774937400.2392.7652
181760316866.7736.337
191373113293.8437.155
2059865988.48-2.48106
2173837400.23-17.2348
221673316866.7-133.663
231314213293.8-151.845
2458835988.48-105.481
2575097400.23108.765
261625016866.7-616.663
271325413293.8-39.8447
2862835988.48294.519
2972957400.23-105.235
301566516866.7-1201.66
311278713293.8-506.845
3260305988.4841.5189
3369817400.23-419.235
341545316866.7-1413.66
351242813293.8-865.845
3655725646.19-74.1894
3770377057.94-20.9432
381587816524.4-646.371
391299012951.638.447
4062055988.48216.519
4170177400.23-383.235
421825916866.71392.34
431366013293.8366.155
4461875988.48198.519


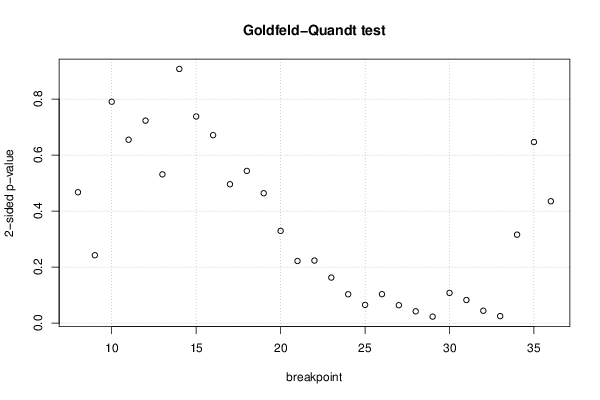
Goldfeld-Quandt test for Heteroskedasticity
p-valuesAlternative Hypothesis
breakpoint indexgreater2-sidedless
80.2335790.4671580.766421
90.1211260.2422520.878874
100.3951880.7903760.604812
110.3273250.6546490.672675
120.3613880.7227760.638612
130.2654910.5309810.734509
140.4536910.9073820.546309
150.3688590.7377180.631141
160.3354410.6708820.664559
170.2478330.4956650.752167
180.2716590.5433170.728341
190.2318070.4636140.768193
200.1646310.3292620.835369
210.1108380.2216760.889162
220.1116330.2232660.888367
230.08126240.1625250.918738
240.051440.102880.94856
250.03242420.06484840.967576
260.05160380.1032080.948396
270.03190860.06381720.968091
280.02100230.04200450.978998
290.01145680.02291360.988543
300.05389870.1077970.946101
310.04110780.08221550.958892
320.02197790.04395580.978022
330.01242550.0248510.987574
340.1578180.3156370.842182
350.3232330.6464660.676767
360.2174850.4349690.782515

\begin{tabular}{lllllllll}
\hline
Goldfeld-Quandt test for Heteroskedasticity \tabularnewline
p-values & Alternative Hypothesis \tabularnewline
breakpoint index & greater & 2-sided & less \tabularnewline
8 & 0.233579 & 0.467158 & 0.766421 \tabularnewline
9 & 0.121126 & 0.242252 & 0.878874 \tabularnewline
10 & 0.395188 & 0.790376 & 0.604812 \tabularnewline
11 & 0.327325 & 0.654649 & 0.672675 \tabularnewline
12 & 0.361388 & 0.722776 & 0.638612 \tabularnewline
13 & 0.265491 & 0.530981 & 0.734509 \tabularnewline
14 & 0.453691 & 0.907382 & 0.546309 \tabularnewline
15 & 0.368859 & 0.737718 & 0.631141 \tabularnewline
16 & 0.335441 & 0.670882 & 0.664559 \tabularnewline
17 & 0.247833 & 0.495665 & 0.752167 \tabularnewline
18 & 0.271659 & 0.543317 & 0.728341 \tabularnewline
19 & 0.231807 & 0.463614 & 0.768193 \tabularnewline
20 & 0.164631 & 0.329262 & 0.835369 \tabularnewline
21 & 0.110838 & 0.221676 & 0.889162 \tabularnewline
22 & 0.111633 & 0.223266 & 0.888367 \tabularnewline
23 & 0.0812624 & 0.162525 & 0.918738 \tabularnewline
24 & 0.05144 & 0.10288 & 0.94856 \tabularnewline
25 & 0.0324242 & 0.0648484 & 0.967576 \tabularnewline
26 & 0.0516038 & 0.103208 & 0.948396 \tabularnewline
27 & 0.0319086 & 0.0638172 & 0.968091 \tabularnewline
28 & 0.0210023 & 0.0420045 & 0.978998 \tabularnewline
29 & 0.0114568 & 0.0229136 & 0.988543 \tabularnewline
30 & 0.0538987 & 0.107797 & 0.946101 \tabularnewline
31 & 0.0411078 & 0.0822155 & 0.958892 \tabularnewline
32 & 0.0219779 & 0.0439558 & 0.978022 \tabularnewline
33 & 0.0124255 & 0.024851 & 0.987574 \tabularnewline
34 & 0.157818 & 0.315637 & 0.842182 \tabularnewline
35 & 0.323233 & 0.646466 & 0.676767 \tabularnewline
36 & 0.217485 & 0.434969 & 0.782515 \tabularnewline
\hline
\end{tabular}
%Source: https://freestatistics.org/blog/index.php?pk=266968&T=5

[TABLE]
[ROW][C]Goldfeld-Quandt test for Heteroskedasticity[/C][/ROW]
[ROW][C]p-values[/C][C]Alternative Hypothesis[/C][/ROW]
[ROW][C]breakpoint index[/C][C]greater[/C][C]2-sided[/C][C]less[/C][/ROW]
[ROW][C]8[/C][C]0.233579[/C][C]0.467158[/C][C]0.766421[/C][/ROW]
[ROW][C]9[/C][C]0.121126[/C][C]0.242252[/C][C]0.878874[/C][/ROW]
[ROW][C]10[/C][C]0.395188[/C][C]0.790376[/C][C]0.604812[/C][/ROW]
[ROW][C]11[/C][C]0.327325[/C][C]0.654649[/C][C]0.672675[/C][/ROW]
[ROW][C]12[/C][C]0.361388[/C][C]0.722776[/C][C]0.638612[/C][/ROW]
[ROW][C]13[/C][C]0.265491[/C][C]0.530981[/C][C]0.734509[/C][/ROW]
[ROW][C]14[/C][C]0.453691[/C][C]0.907382[/C][C]0.546309[/C][/ROW]
[ROW][C]15[/C][C]0.368859[/C][C]0.737718[/C][C]0.631141[/C][/ROW]
[ROW][C]16[/C][C]0.335441[/C][C]0.670882[/C][C]0.664559[/C][/ROW]
[ROW][C]17[/C][C]0.247833[/C][C]0.495665[/C][C]0.752167[/C][/ROW]
[ROW][C]18[/C][C]0.271659[/C][C]0.543317[/C][C]0.728341[/C][/ROW]
[ROW][C]19[/C][C]0.231807[/C][C]0.463614[/C][C]0.768193[/C][/ROW]
[ROW][C]20[/C][C]0.164631[/C][C]0.329262[/C][C]0.835369[/C][/ROW]
[ROW][C]21[/C][C]0.110838[/C][C]0.221676[/C][C]0.889162[/C][/ROW]
[ROW][C]22[/C][C]0.111633[/C][C]0.223266[/C][C]0.888367[/C][/ROW]
[ROW][C]23[/C][C]0.0812624[/C][C]0.162525[/C][C]0.918738[/C][/ROW]
[ROW][C]24[/C][C]0.05144[/C][C]0.10288[/C][C]0.94856[/C][/ROW]
[ROW][C]25[/C][C]0.0324242[/C][C]0.0648484[/C][C]0.967576[/C][/ROW]
[ROW][C]26[/C][C]0.0516038[/C][C]0.103208[/C][C]0.948396[/C][/ROW]
[ROW][C]27[/C][C]0.0319086[/C][C]0.0638172[/C][C]0.968091[/C][/ROW]
[ROW][C]28[/C][C]0.0210023[/C][C]0.0420045[/C][C]0.978998[/C][/ROW]
[ROW][C]29[/C][C]0.0114568[/C][C]0.0229136[/C][C]0.988543[/C][/ROW]
[ROW][C]30[/C][C]0.0538987[/C][C]0.107797[/C][C]0.946101[/C][/ROW]
[ROW][C]31[/C][C]0.0411078[/C][C]0.0822155[/C][C]0.958892[/C][/ROW]
[ROW][C]32[/C][C]0.0219779[/C][C]0.0439558[/C][C]0.978022[/C][/ROW]
[ROW][C]33[/C][C]0.0124255[/C][C]0.024851[/C][C]0.987574[/C][/ROW]
[ROW][C]34[/C][C]0.157818[/C][C]0.315637[/C][C]0.842182[/C][/ROW]
[ROW][C]35[/C][C]0.323233[/C][C]0.646466[/C][C]0.676767[/C][/ROW]
[ROW][C]36[/C][C]0.217485[/C][C]0.434969[/C][C]0.782515[/C][/ROW]
[/TABLE]
Source: https://freestatistics.org/blog/index.php?pk=266968&T=5

Globally Unique Identifier (entire table): ba.freestatistics.org/blog/index.php?pk=266968&T=5

As an alternative you can also use a QR Code:  

The GUIDs for individual cells are displayed in the table below:

Goldfeld-Quandt test for Heteroskedasticity
p-valuesAlternative Hypothesis
breakpoint indexgreater2-sidedless
80.2335790.4671580.766421
90.1211260.2422520.878874
100.3951880.7903760.604812
110.3273250.6546490.672675
120.3613880.7227760.638612
130.2654910.5309810.734509
140.4536910.9073820.546309
150.3688590.7377180.631141
160.3354410.6708820.664559
170.2478330.4956650.752167
180.2716590.5433170.728341
190.2318070.4636140.768193
200.1646310.3292620.835369
210.1108380.2216760.889162
220.1116330.2232660.888367
230.08126240.1625250.918738
240.051440.102880.94856
250.03242420.06484840.967576
260.05160380.1032080.948396
270.03190860.06381720.968091
280.02100230.04200450.978998
290.01145680.02291360.988543
300.05389870.1077970.946101
310.04110780.08221550.958892
320.02197790.04395580.978022
330.01242550.0248510.987574
340.1578180.3156370.842182
350.3232330.6464660.676767
360.2174850.4349690.782515


Meta Analysis of Goldfeld-Quandt test for Heteroskedasticity
Description# significant tests% significant testsOK/NOK
1% type I error level00OK
5% type I error level40.137931NOK
10% type I error level70.241379NOK

\begin{tabular}{lllllllll}
\hline
Meta Analysis of Goldfeld-Quandt test for Heteroskedasticity \tabularnewline
Description & # significant tests & % significant tests & OK/NOK \tabularnewline
1% type I error level & 0 & 0 & OK \tabularnewline
5% type I error level & 4 & 0.137931 & NOK \tabularnewline
10% type I error level & 7 & 0.241379 & NOK \tabularnewline
\hline
\end{tabular}
%Source: https://freestatistics.org/blog/index.php?pk=266968&T=6

[TABLE]
[ROW][C]Meta Analysis of Goldfeld-Quandt test for Heteroskedasticity[/C][/ROW]
[ROW][C]Description[/C][C]# significant tests[/C][C]% significant tests[/C][C]OK/NOK[/C][/ROW]
[ROW][C]1% type I error level[/C][C]0[/C][C]0[/C][C]OK[/C][/ROW]
[ROW][C]5% type I error level[/C][C]4[/C][C]0.137931[/C][C]NOK[/C][/ROW]
[ROW][C]10% type I error level[/C][C]7[/C][C]0.241379[/C][C]NOK[/C][/ROW]
[/TABLE]
Source: https://freestatistics.org/blog/index.php?pk=266968&T=6

Globally Unique Identifier (entire table): ba.freestatistics.org/blog/index.php?pk=266968&T=6

As an alternative you can also use a QR Code:  

The GUIDs for individual cells are displayed in the table below:

Meta Analysis of Goldfeld-Quandt test for Heteroskedasticity
Description# significant tests% significant testsOK/NOK
1% type I error level00OK
5% type I error level40.137931NOK
10% type I error level70.241379NOK


Parameters (Session):
par1 = 1 ; par2 = Include Quarterly Dummies ; par3 = No Linear Trend ;
Parameters (R input):
par1 = 1 ; par2 = Include Quarterly Dummies ; par3 = No Linear Trend ;
R code (references can be found in the software module):
library(lattice)
library(lmtest)
n25 <- 25 #minimum number of obs. for Goldfeld-Quandt test
par1 <- as.numeric(par1)
x <- t(y)
k <- length(x[1,])
n <- length(x[,1])
x1 <- cbind(x[,par1], x[,1:k!=par1])
mycolnames <- c(colnames(x)[par1], colnames(x)[1:k!=par1])
colnames(x1) <- mycolnames #colnames(x)[par1]
x <- x1
if (par3 == 'First Differences'){
x2 <- array(0, dim=c(n-1,k), dimnames=list(1:(n-1), paste('(1-B)',colnames(x),sep='')))
for (i in 1:n-1) {
for (j in 1:k) {
x2[i,j] <- x[i+1,j] - x[i,j]
}
}
x <- x2
}
if (par2 == 'Include Monthly Dummies'){
x2 <- array(0, dim=c(n,11), dimnames=list(1:n, paste('M', seq(1:11), sep ='')))
for (i in 1:11){
x2[seq(i,n,12),i] <- 1
}
x <- cbind(x, x2)
}
if (par2 == 'Include Quarterly Dummies'){
x2 <- array(0, dim=c(n,3), dimnames=list(1:n, paste('Q', seq(1:3), sep ='')))
for (i in 1:3){
x2[seq(i,n,4),i] <- 1
}
x <- cbind(x, x2)
}
k <- length(x[1,])
if (par3 == 'Linear Trend'){
x <- cbind(x, c(1:n))
colnames(x)[k+1] <- 't'
}
x
k <- length(x[1,])
df <- as.data.frame(x)
(mylm <- lm(df))
(mysum <- summary(mylm))
if (n > n25) {
kp3 <- k + 3
nmkm3 <- n - k - 3
gqarr <- array(NA, dim=c(nmkm3-kp3+1,3))
numgqtests <- 0
numsignificant1 <- 0
numsignificant5 <- 0
numsignificant10 <- 0
for (mypoint in kp3:nmkm3) {
j <- 0
numgqtests <- numgqtests + 1
for (myalt in c('greater', 'two.sided', 'less')) {
j <- j + 1
gqarr[mypoint-kp3+1,j] <- gqtest(mylm, point=mypoint, alternative=myalt)$p.value
}
if (gqarr[mypoint-kp3+1,2] < 0.01) numsignificant1 <- numsignificant1 + 1
if (gqarr[mypoint-kp3+1,2] < 0.05) numsignificant5 <- numsignificant5 + 1
if (gqarr[mypoint-kp3+1,2] < 0.10) numsignificant10 <- numsignificant10 + 1
}
gqarr
}
bitmap(file='test0.png')
plot(x[,1], type='l', main='Actuals and Interpolation', ylab='value of Actuals and Interpolation (dots)', xlab='time or index')
points(x[,1]-mysum$resid)
grid()
dev.off()
bitmap(file='test1.png')
plot(mysum$resid, type='b', pch=19, main='Residuals', ylab='value of Residuals', xlab='time or index')
grid()
dev.off()
bitmap(file='test2.png')
hist(mysum$resid, main='Residual Histogram', xlab='values of Residuals')
grid()
dev.off()
bitmap(file='test3.png')
densityplot(~mysum$resid,col='black',main='Residual Density Plot', xlab='values of Residuals')
dev.off()
bitmap(file='test4.png')
qqnorm(mysum$resid, main='Residual Normal Q-Q Plot')
qqline(mysum$resid)
grid()
dev.off()
(myerror <- as.ts(mysum$resid))
bitmap(file='test5.png')
dum <- cbind(lag(myerror,k=1),myerror)
dum
dum1 <- dum[2:length(myerror),]
dum1
z <- as.data.frame(dum1)
z
plot(z,main=paste('Residual Lag plot, lowess, and regression line'), ylab='values of Residuals', xlab='lagged values of Residuals')
lines(lowess(z))
abline(lm(z))
grid()
dev.off()
bitmap(file='test6.png')
acf(mysum$resid, lag.max=length(mysum$resid)/2, main='Residual Autocorrelation Function')
grid()
dev.off()
bitmap(file='test7.png')
pacf(mysum$resid, lag.max=length(mysum$resid)/2, main='Residual Partial Autocorrelation Function')
grid()
dev.off()
bitmap(file='test8.png')
opar <- par(mfrow = c(2,2), oma = c(0, 0, 1.1, 0))
plot(mylm, las = 1, sub='Residual Diagnostics')
par(opar)
dev.off()
if (n > n25) {
bitmap(file='test9.png')
plot(kp3:nmkm3,gqarr[,2], main='Goldfeld-Quandt test',ylab='2-sided p-value',xlab='breakpoint')
grid()
dev.off()
}
load(file='createtable')
a<-table.start()
a<-table.row.start(a)
a<-table.element(a, 'Multiple Linear Regression - Estimated Regression Equation', 1, TRUE)
a<-table.row.end(a)
myeq <- colnames(x)[1]
myeq <- paste(myeq, '[t] = ', sep='')
for (i in 1:k){
if (mysum$coefficients[i,1] > 0) myeq <- paste(myeq, '+', '')
myeq <- paste(myeq, signif(mysum$coefficients[i,1],6), sep=' ')
if (rownames(mysum$coefficients)[i] != '(Intercept)') {
myeq <- paste(myeq, rownames(mysum$coefficients)[i], sep='')
if (rownames(mysum$coefficients)[i] != 't') myeq <- paste(myeq, '[t]', sep='')
}
}
myeq <- paste(myeq, ' + e[t]')
a<-table.row.start(a)
a<-table.element(a, myeq)
a<-table.row.end(a)
a<-table.end(a)
table.save(a,file='mytable1.tab')
a<-table.start()
a<-table.row.start(a)
a<-table.element(a,hyperlink('ols1.htm','Multiple Linear Regression - Ordinary Least Squares',''), 6, TRUE)
a<-table.row.end(a)
a<-table.row.start(a)
a<-table.element(a,'Variable',header=TRUE)
a<-table.element(a,'Parameter',header=TRUE)
a<-table.element(a,'S.D.',header=TRUE)
a<-table.element(a,'T-STAT
H0: parameter = 0',header=TRUE)
a<-table.element(a,'2-tail p-value',header=TRUE)
a<-table.element(a,'1-tail p-value',header=TRUE)
a<-table.row.end(a)
for (i in 1:k){
a<-table.row.start(a)
a<-table.element(a,rownames(mysum$coefficients)[i],header=TRUE)
a<-table.element(a,signif(mysum$coefficients[i,1],6))
a<-table.element(a, signif(mysum$coefficients[i,2],6))
a<-table.element(a, signif(mysum$coefficients[i,3],4))
a<-table.element(a, signif(mysum$coefficients[i,4],6))
a<-table.element(a, signif(mysum$coefficients[i,4]/2,6))
a<-table.row.end(a)
}
a<-table.end(a)
table.save(a,file='mytable2.tab')
a<-table.start()
a<-table.row.start(a)
a<-table.element(a, 'Multiple Linear Regression - Regression Statistics', 2, TRUE)
a<-table.row.end(a)
a<-table.row.start(a)
a<-table.element(a, 'Multiple R',1,TRUE)
a<-table.element(a, signif(sqrt(mysum$r.squared),6))
a<-table.row.end(a)
a<-table.row.start(a)
a<-table.element(a, 'R-squared',1,TRUE)
a<-table.element(a, signif(mysum$r.squared,6))
a<-table.row.end(a)
a<-table.row.start(a)
a<-table.element(a, 'Adjusted R-squared',1,TRUE)
a<-table.element(a, signif(mysum$adj.r.squared,6))
a<-table.row.end(a)
a<-table.row.start(a)
a<-table.element(a, 'F-TEST (value)',1,TRUE)
a<-table.element(a, signif(mysum$fstatistic[1],6))
a<-table.row.end(a)
a<-table.row.start(a)
a<-table.element(a, 'F-TEST (DF numerator)',1,TRUE)
a<-table.element(a, signif(mysum$fstatistic[2],6))
a<-table.row.end(a)
a<-table.row.start(a)
a<-table.element(a, 'F-TEST (DF denominator)',1,TRUE)
a<-table.element(a, signif(mysum$fstatistic[3],6))
a<-table.row.end(a)
a<-table.row.start(a)
a<-table.element(a, 'p-value',1,TRUE)
a<-table.element(a, signif(1-pf(mysum$fstatistic[1],mysum$fstatistic[2],mysum$fstatistic[3]),6))
a<-table.row.end(a)
a<-table.row.start(a)
a<-table.element(a, 'Multiple Linear Regression - Residual Statistics', 2, TRUE)
a<-table.row.end(a)
a<-table.row.start(a)
a<-table.element(a, 'Residual Standard Deviation',1,TRUE)
a<-table.element(a, signif(mysum$sigma,6))
a<-table.row.end(a)
a<-table.row.start(a)
a<-table.element(a, 'Sum Squared Residuals',1,TRUE)
a<-table.element(a, signif(sum(myerror*myerror),6))
a<-table.row.end(a)
a<-table.end(a)
table.save(a,file='mytable3.tab')
a<-table.start()
a<-table.row.start(a)
a<-table.element(a, 'Multiple Linear Regression - Actuals, Interpolation, and Residuals', 4, TRUE)
a<-table.row.end(a)
a<-table.row.start(a)
a<-table.element(a, 'Time or Index', 1, TRUE)
a<-table.element(a, 'Actuals', 1, TRUE)
a<-table.element(a, 'Interpolation
Forecast', 1, TRUE)
a<-table.element(a, 'Residuals
Prediction Error', 1, TRUE)
a<-table.row.end(a)
for (i in 1:n) {
a<-table.row.start(a)
a<-table.element(a,i, 1, TRUE)
a<-table.element(a,signif(x[i],6))
a<-table.element(a,signif(x[i]-mysum$resid[i],6))
a<-table.element(a,signif(mysum$resid[i],6))
a<-table.row.end(a)
}
a<-table.end(a)
table.save(a,file='mytable4.tab')
if (n > n25) {
a<-table.start()
a<-table.row.start(a)
a<-table.element(a,'Goldfeld-Quandt test for Heteroskedasticity',4,TRUE)
a<-table.row.end(a)
a<-table.row.start(a)
a<-table.element(a,'p-values',header=TRUE)
a<-table.element(a,'Alternative Hypothesis',3,header=TRUE)
a<-table.row.end(a)
a<-table.row.start(a)
a<-table.element(a,'breakpoint index',header=TRUE)
a<-table.element(a,'greater',header=TRUE)
a<-table.element(a,'2-sided',header=TRUE)
a<-table.element(a,'less',header=TRUE)
a<-table.row.end(a)
for (mypoint in kp3:nmkm3) {
a<-table.row.start(a)
a<-table.element(a,mypoint,header=TRUE)
a<-table.element(a,signif(gqarr[mypoint-kp3+1,1],6))
a<-table.element(a,signif(gqarr[mypoint-kp3+1,2],6))
a<-table.element(a,signif(gqarr[mypoint-kp3+1,3],6))
a<-table.row.end(a)
}
a<-table.end(a)
table.save(a,file='mytable5.tab')
a<-table.start()
a<-table.row.start(a)
a<-table.element(a,'Meta Analysis of Goldfeld-Quandt test for Heteroskedasticity',4,TRUE)
a<-table.row.end(a)
a<-table.row.start(a)
a<-table.element(a,'Description',header=TRUE)
a<-table.element(a,'# significant tests',header=TRUE)
a<-table.element(a,'% significant tests',header=TRUE)
a<-table.element(a,'OK/NOK',header=TRUE)
a<-table.row.end(a)
a<-table.row.start(a)
a<-table.element(a,'1% type I error level',header=TRUE)
a<-table.element(a,signif(numsignificant1,6))
a<-table.element(a,signif(numsignificant1/numgqtests,6))
if (numsignificant1/numgqtests < 0.01) dum <- 'OK' else dum <- 'NOK'
a<-table.element(a,dum)
a<-table.row.end(a)
a<-table.row.start(a)
a<-table.element(a,'5% type I error level',header=TRUE)
a<-table.element(a,signif(numsignificant5,6))
a<-table.element(a,signif(numsignificant5/numgqtests,6))
if (numsignificant5/numgqtests < 0.05) dum <- 'OK' else dum <- 'NOK'
a<-table.element(a,dum)
a<-table.row.end(a)
a<-table.row.start(a)
a<-table.element(a,'10% type I error level',header=TRUE)
a<-table.element(a,signif(numsignificant10,6))
a<-table.element(a,signif(numsignificant10/numgqtests,6))
if (numsignificant10/numgqtests < 0.1) dum <- 'OK' else dum <- 'NOK'
a<-table.element(a,dum)
a<-table.row.end(a)
a<-table.end(a)
table.save(a,file='mytable6.tab')
}