Free Statistics

of Irreproducible Research!

Author's title

Author*The author of this computation has been verified*
R Software Modulerwasp_multipleregression.wasp
Title produced by softwareMultiple Regression
Date of computationSun, 14 Dec 2014 15:52:33 +0000
Cite this page as followsStatistical Computations at FreeStatistics.org, Office for Research Development and Education, URL https://freestatistics.org/blog/index.php?v=date/2014/Dec/14/t1418574329dglur9smzmupuq6.htm/, Retrieved Sat, 11 May 2024 14:20:37 +0000
Statistical Computations at FreeStatistics.org, Office for Research Development and Education, URL https://freestatistics.org/blog/index.php?pk=267730, Retrieved Sat, 11 May 2024 14:20:37 +0000
QR Codes:

Original text written by user:
IsPrivate?No (this computation is public)
User-defined keywords
Estimated Impact120
Family? (F = Feedback message, R = changed R code, M = changed R Module, P = changed Parameters, D = changed Data)
-     [Multiple Regression] [] [2013-11-04 07:28:31] [0307e7a6407eb638caabc417e3a6b260]
- RM    [Multiple Regression] [] [2014-11-13 17:16:10] [d69b52d23ca73e15a0c741afa583703c]
-  MPD    [Multiple Regression] [huwelijken vs con...] [2014-12-13 10:56:41] [189b7d469e4e3b4e868a6af83e3b3816]
-   P       [Multiple Regression] [aantal huwelijken...] [2014-12-13 11:05:02] [189b7d469e4e3b4e868a6af83e3b3816]
-    D          [Multiple Regression] [scheidingen vs co...] [2014-12-14 15:52:33] [0ce3062f3159e08d115eba7e96d082ef] [Current]
Feedback Forum

Post a new message
Dataseries X:
6305 1
7179 1
7326 1
8093 1
7096 1
7738 1
8576 1
9196 0
7908 1
8763 1
9185 1
9510 1
7475 1
7083 1
7796 1
7727 1
6837 1
6933 1
7749 1
7670 1
7268 1
7585 1
8239 1
7748 1
7514 1
7665 1
8238 1
7988 1
7286 1
7778 1
8140 1
8151 1
7478 1
7408 1
7791 1
7951 0
7170 0
7032 0
7803 0
7309 1
6638 1
6592 1
6963 1
6809 1


Summary of computational transaction
Raw Inputview raw input (R code)
Raw Outputview raw output of R engine
Computing time5 seconds
R Server'Herman Ole Andreas Wold' @ wold.wessa.net

\begin{tabular}{lllllllll}
\hline
Summary of computational transaction \tabularnewline
Raw Input & view raw input (R code)  \tabularnewline
Raw Output & view raw output of R engine  \tabularnewline
Computing time & 5 seconds \tabularnewline
R Server & 'Herman Ole Andreas Wold' @ wold.wessa.net \tabularnewline
\hline
\end{tabular}
%Source: https://freestatistics.org/blog/index.php?pk=267730&T=0

[TABLE]
[ROW][C]Summary of computational transaction[/C][/ROW]
[ROW][C]Raw Input[/C][C]view raw input (R code) [/C][/ROW]
[ROW][C]Raw Output[/C][C]view raw output of R engine [/C][/ROW]
[ROW][C]Computing time[/C][C]5 seconds[/C][/ROW]
[ROW][C]R Server[/C][C]'Herman Ole Andreas Wold' @ wold.wessa.net[/C][/ROW]
[/TABLE]
Source: https://freestatistics.org/blog/index.php?pk=267730&T=0

Globally Unique Identifier (entire table): ba.freestatistics.org/blog/index.php?pk=267730&T=0

As an alternative you can also use a QR Code:  

The GUIDs for individual cells are displayed in the table below:

Summary of computational transaction
Raw Inputview raw input (R code)
Raw Outputview raw output of R engine
Computing time5 seconds
R Server'Herman Ole Andreas Wold' @ wold.wessa.net


Multiple Linear Regression - Estimated Regression Equation
aantal[t] = + 7830.4 -201.246scheidingen[t] + e[t]

\begin{tabular}{lllllllll}
\hline
Multiple Linear Regression - Estimated Regression Equation \tabularnewline
aantal[t] =  +  7830.4 -201.246scheidingen[t]  + e[t] \tabularnewline
\hline
\end{tabular}
%Source: https://freestatistics.org/blog/index.php?pk=267730&T=1

[TABLE]
[ROW][C]Multiple Linear Regression - Estimated Regression Equation[/C][/ROW]
[ROW][C]aantal[t] =  +  7830.4 -201.246scheidingen[t]  + e[t][/C][/ROW]
[/TABLE]
Source: https://freestatistics.org/blog/index.php?pk=267730&T=1

Globally Unique Identifier (entire table): ba.freestatistics.org/blog/index.php?pk=267730&T=1

As an alternative you can also use a QR Code:  

The GUIDs for individual cells are displayed in the table below:

Multiple Linear Regression - Estimated Regression Equation
aantal[t] = + 7830.4 -201.246scheidingen[t] + e[t]


Multiple Linear Regression - Ordinary Least Squares
VariableParameterS.D.T-STATH0: parameter = 02-tail p-value1-tail p-value
(Intercept)7830.4310.90725.195.70229e-272.85114e-27
scheidingen-201.246330.236-0.60940.5455410.272771

\begin{tabular}{lllllllll}
\hline
Multiple Linear Regression - Ordinary Least Squares \tabularnewline
Variable & Parameter & S.D. & T-STATH0: parameter = 0 & 2-tail p-value & 1-tail p-value \tabularnewline
(Intercept) & 7830.4 & 310.907 & 25.19 & 5.70229e-27 & 2.85114e-27 \tabularnewline
scheidingen & -201.246 & 330.236 & -0.6094 & 0.545541 & 0.272771 \tabularnewline
\hline
\end{tabular}
%Source: https://freestatistics.org/blog/index.php?pk=267730&T=2

[TABLE]
[ROW][C]Multiple Linear Regression - Ordinary Least Squares[/C][/ROW]
[ROW][C]Variable[/C][C]Parameter[/C][C]S.D.[/C][C]T-STATH0: parameter = 0[/C][C]2-tail p-value[/C][C]1-tail p-value[/C][/ROW]
[ROW][C](Intercept)[/C][C]7830.4[/C][C]310.907[/C][C]25.19[/C][C]5.70229e-27[/C][C]2.85114e-27[/C][/ROW]
[ROW][C]scheidingen[/C][C]-201.246[/C][C]330.236[/C][C]-0.6094[/C][C]0.545541[/C][C]0.272771[/C][/ROW]
[/TABLE]
Source: https://freestatistics.org/blog/index.php?pk=267730&T=2

Globally Unique Identifier (entire table): ba.freestatistics.org/blog/index.php?pk=267730&T=2

As an alternative you can also use a QR Code:  

The GUIDs for individual cells are displayed in the table below:

Multiple Linear Regression - Ordinary Least Squares
VariableParameterS.D.T-STATH0: parameter = 02-tail p-value1-tail p-value
(Intercept)7830.4310.90725.195.70229e-272.85114e-27
scheidingen-201.246330.236-0.60940.5455410.272771


Multiple Linear Regression - Regression Statistics
Multiple R0.0936197
R-squared0.00876465
Adjusted R-squared-0.0148362
F-TEST (value)0.37137
F-TEST (DF numerator)1
F-TEST (DF denominator)42
p-value0.545541
Multiple Linear Regression - Residual Statistics
Residual Standard Deviation695.208
Sum Squared Residuals20299200

\begin{tabular}{lllllllll}
\hline
Multiple Linear Regression - Regression Statistics \tabularnewline
Multiple R & 0.0936197 \tabularnewline
R-squared & 0.00876465 \tabularnewline
Adjusted R-squared & -0.0148362 \tabularnewline
F-TEST (value) & 0.37137 \tabularnewline
F-TEST (DF numerator) & 1 \tabularnewline
F-TEST (DF denominator) & 42 \tabularnewline
p-value & 0.545541 \tabularnewline
Multiple Linear Regression - Residual Statistics \tabularnewline
Residual Standard Deviation & 695.208 \tabularnewline
Sum Squared Residuals & 20299200 \tabularnewline
\hline
\end{tabular}
%Source: https://freestatistics.org/blog/index.php?pk=267730&T=3

[TABLE]
[ROW][C]Multiple Linear Regression - Regression Statistics[/C][/ROW]
[ROW][C]Multiple R[/C][C]0.0936197[/C][/ROW]
[ROW][C]R-squared[/C][C]0.00876465[/C][/ROW]
[ROW][C]Adjusted R-squared[/C][C]-0.0148362[/C][/ROW]
[ROW][C]F-TEST (value)[/C][C]0.37137[/C][/ROW]
[ROW][C]F-TEST (DF numerator)[/C][C]1[/C][/ROW]
[ROW][C]F-TEST (DF denominator)[/C][C]42[/C][/ROW]
[ROW][C]p-value[/C][C]0.545541[/C][/ROW]
[ROW][C]Multiple Linear Regression - Residual Statistics[/C][/ROW]
[ROW][C]Residual Standard Deviation[/C][C]695.208[/C][/ROW]
[ROW][C]Sum Squared Residuals[/C][C]20299200[/C][/ROW]
[/TABLE]
Source: https://freestatistics.org/blog/index.php?pk=267730&T=3

Globally Unique Identifier (entire table): ba.freestatistics.org/blog/index.php?pk=267730&T=3

As an alternative you can also use a QR Code:  

The GUIDs for individual cells are displayed in the table below:

Multiple Linear Regression - Regression Statistics
Multiple R0.0936197
R-squared0.00876465
Adjusted R-squared-0.0148362
F-TEST (value)0.37137
F-TEST (DF numerator)1
F-TEST (DF denominator)42
p-value0.545541
Multiple Linear Regression - Residual Statistics
Residual Standard Deviation695.208
Sum Squared Residuals20299200


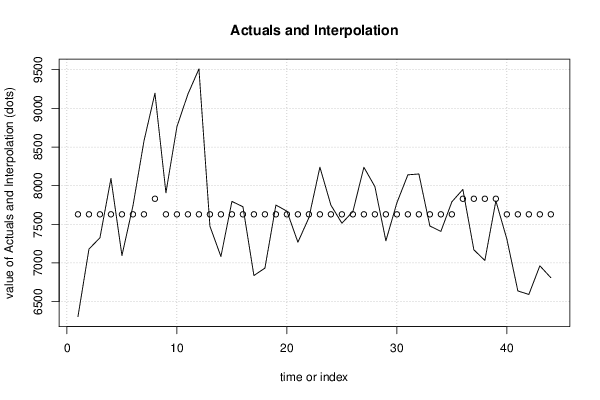
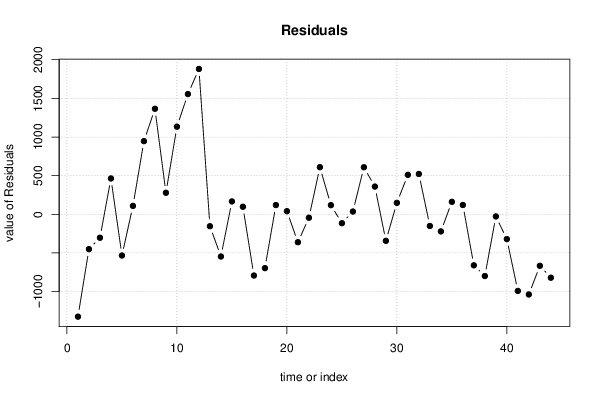
Multiple Linear Regression - Actuals, Interpolation, and Residuals
Time or IndexActualsInterpolationForecastResidualsPrediction Error
163057629.15-1324.15
271797629.15-450.154
373267629.15-303.154
480937629.15463.846
570967629.15-533.154
677387629.15108.846
785767629.15946.846
891967830.41365.6
979087629.15278.846
1087637629.151133.85
1191857629.151555.85
1295107629.151880.85
1374757629.15-154.154
1470837629.15-546.154
1577967629.15166.846
1677277629.1597.8462
1768377629.15-792.154
1869337629.15-696.154
1977497629.15119.846
2076707629.1540.8462
2172687629.15-361.154
2275857629.15-44.1538
2382397629.15609.846
2477487629.15118.846
2575147629.15-115.154
2676657629.1535.8462
2782387629.15608.846
2879887629.15358.846
2972867629.15-343.154
3077787629.15148.846
3181407629.15510.846
3281517629.15521.846
3374787629.15-151.154
3474087629.15-221.154
3577917629.15161.846
3679517830.4120.6
3771707830.4-660.4
3870327830.4-798.4
3978037830.4-27.4
4073097629.15-320.154
4166387629.15-991.154
4265927629.15-1037.15
4369637629.15-666.154
4468097629.15-820.154

\begin{tabular}{lllllllll}
\hline
Multiple Linear Regression - Actuals, Interpolation, and Residuals \tabularnewline
Time or Index & Actuals & InterpolationForecast & ResidualsPrediction Error \tabularnewline
1 & 6305 & 7629.15 & -1324.15 \tabularnewline
2 & 7179 & 7629.15 & -450.154 \tabularnewline
3 & 7326 & 7629.15 & -303.154 \tabularnewline
4 & 8093 & 7629.15 & 463.846 \tabularnewline
5 & 7096 & 7629.15 & -533.154 \tabularnewline
6 & 7738 & 7629.15 & 108.846 \tabularnewline
7 & 8576 & 7629.15 & 946.846 \tabularnewline
8 & 9196 & 7830.4 & 1365.6 \tabularnewline
9 & 7908 & 7629.15 & 278.846 \tabularnewline
10 & 8763 & 7629.15 & 1133.85 \tabularnewline
11 & 9185 & 7629.15 & 1555.85 \tabularnewline
12 & 9510 & 7629.15 & 1880.85 \tabularnewline
13 & 7475 & 7629.15 & -154.154 \tabularnewline
14 & 7083 & 7629.15 & -546.154 \tabularnewline
15 & 7796 & 7629.15 & 166.846 \tabularnewline
16 & 7727 & 7629.15 & 97.8462 \tabularnewline
17 & 6837 & 7629.15 & -792.154 \tabularnewline
18 & 6933 & 7629.15 & -696.154 \tabularnewline
19 & 7749 & 7629.15 & 119.846 \tabularnewline
20 & 7670 & 7629.15 & 40.8462 \tabularnewline
21 & 7268 & 7629.15 & -361.154 \tabularnewline
22 & 7585 & 7629.15 & -44.1538 \tabularnewline
23 & 8239 & 7629.15 & 609.846 \tabularnewline
24 & 7748 & 7629.15 & 118.846 \tabularnewline
25 & 7514 & 7629.15 & -115.154 \tabularnewline
26 & 7665 & 7629.15 & 35.8462 \tabularnewline
27 & 8238 & 7629.15 & 608.846 \tabularnewline
28 & 7988 & 7629.15 & 358.846 \tabularnewline
29 & 7286 & 7629.15 & -343.154 \tabularnewline
30 & 7778 & 7629.15 & 148.846 \tabularnewline
31 & 8140 & 7629.15 & 510.846 \tabularnewline
32 & 8151 & 7629.15 & 521.846 \tabularnewline
33 & 7478 & 7629.15 & -151.154 \tabularnewline
34 & 7408 & 7629.15 & -221.154 \tabularnewline
35 & 7791 & 7629.15 & 161.846 \tabularnewline
36 & 7951 & 7830.4 & 120.6 \tabularnewline
37 & 7170 & 7830.4 & -660.4 \tabularnewline
38 & 7032 & 7830.4 & -798.4 \tabularnewline
39 & 7803 & 7830.4 & -27.4 \tabularnewline
40 & 7309 & 7629.15 & -320.154 \tabularnewline
41 & 6638 & 7629.15 & -991.154 \tabularnewline
42 & 6592 & 7629.15 & -1037.15 \tabularnewline
43 & 6963 & 7629.15 & -666.154 \tabularnewline
44 & 6809 & 7629.15 & -820.154 \tabularnewline
\hline
\end{tabular}
%Source: https://freestatistics.org/blog/index.php?pk=267730&T=4

[TABLE]
[ROW][C]Multiple Linear Regression - Actuals, Interpolation, and Residuals[/C][/ROW]
[ROW][C]Time or Index[/C][C]Actuals[/C][C]InterpolationForecast[/C][C]ResidualsPrediction Error[/C][/ROW]
[ROW][C]1[/C][C]6305[/C][C]7629.15[/C][C]-1324.15[/C][/ROW]
[ROW][C]2[/C][C]7179[/C][C]7629.15[/C][C]-450.154[/C][/ROW]
[ROW][C]3[/C][C]7326[/C][C]7629.15[/C][C]-303.154[/C][/ROW]
[ROW][C]4[/C][C]8093[/C][C]7629.15[/C][C]463.846[/C][/ROW]
[ROW][C]5[/C][C]7096[/C][C]7629.15[/C][C]-533.154[/C][/ROW]
[ROW][C]6[/C][C]7738[/C][C]7629.15[/C][C]108.846[/C][/ROW]
[ROW][C]7[/C][C]8576[/C][C]7629.15[/C][C]946.846[/C][/ROW]
[ROW][C]8[/C][C]9196[/C][C]7830.4[/C][C]1365.6[/C][/ROW]
[ROW][C]9[/C][C]7908[/C][C]7629.15[/C][C]278.846[/C][/ROW]
[ROW][C]10[/C][C]8763[/C][C]7629.15[/C][C]1133.85[/C][/ROW]
[ROW][C]11[/C][C]9185[/C][C]7629.15[/C][C]1555.85[/C][/ROW]
[ROW][C]12[/C][C]9510[/C][C]7629.15[/C][C]1880.85[/C][/ROW]
[ROW][C]13[/C][C]7475[/C][C]7629.15[/C][C]-154.154[/C][/ROW]
[ROW][C]14[/C][C]7083[/C][C]7629.15[/C][C]-546.154[/C][/ROW]
[ROW][C]15[/C][C]7796[/C][C]7629.15[/C][C]166.846[/C][/ROW]
[ROW][C]16[/C][C]7727[/C][C]7629.15[/C][C]97.8462[/C][/ROW]
[ROW][C]17[/C][C]6837[/C][C]7629.15[/C][C]-792.154[/C][/ROW]
[ROW][C]18[/C][C]6933[/C][C]7629.15[/C][C]-696.154[/C][/ROW]
[ROW][C]19[/C][C]7749[/C][C]7629.15[/C][C]119.846[/C][/ROW]
[ROW][C]20[/C][C]7670[/C][C]7629.15[/C][C]40.8462[/C][/ROW]
[ROW][C]21[/C][C]7268[/C][C]7629.15[/C][C]-361.154[/C][/ROW]
[ROW][C]22[/C][C]7585[/C][C]7629.15[/C][C]-44.1538[/C][/ROW]
[ROW][C]23[/C][C]8239[/C][C]7629.15[/C][C]609.846[/C][/ROW]
[ROW][C]24[/C][C]7748[/C][C]7629.15[/C][C]118.846[/C][/ROW]
[ROW][C]25[/C][C]7514[/C][C]7629.15[/C][C]-115.154[/C][/ROW]
[ROW][C]26[/C][C]7665[/C][C]7629.15[/C][C]35.8462[/C][/ROW]
[ROW][C]27[/C][C]8238[/C][C]7629.15[/C][C]608.846[/C][/ROW]
[ROW][C]28[/C][C]7988[/C][C]7629.15[/C][C]358.846[/C][/ROW]
[ROW][C]29[/C][C]7286[/C][C]7629.15[/C][C]-343.154[/C][/ROW]
[ROW][C]30[/C][C]7778[/C][C]7629.15[/C][C]148.846[/C][/ROW]
[ROW][C]31[/C][C]8140[/C][C]7629.15[/C][C]510.846[/C][/ROW]
[ROW][C]32[/C][C]8151[/C][C]7629.15[/C][C]521.846[/C][/ROW]
[ROW][C]33[/C][C]7478[/C][C]7629.15[/C][C]-151.154[/C][/ROW]
[ROW][C]34[/C][C]7408[/C][C]7629.15[/C][C]-221.154[/C][/ROW]
[ROW][C]35[/C][C]7791[/C][C]7629.15[/C][C]161.846[/C][/ROW]
[ROW][C]36[/C][C]7951[/C][C]7830.4[/C][C]120.6[/C][/ROW]
[ROW][C]37[/C][C]7170[/C][C]7830.4[/C][C]-660.4[/C][/ROW]
[ROW][C]38[/C][C]7032[/C][C]7830.4[/C][C]-798.4[/C][/ROW]
[ROW][C]39[/C][C]7803[/C][C]7830.4[/C][C]-27.4[/C][/ROW]
[ROW][C]40[/C][C]7309[/C][C]7629.15[/C][C]-320.154[/C][/ROW]
[ROW][C]41[/C][C]6638[/C][C]7629.15[/C][C]-991.154[/C][/ROW]
[ROW][C]42[/C][C]6592[/C][C]7629.15[/C][C]-1037.15[/C][/ROW]
[ROW][C]43[/C][C]6963[/C][C]7629.15[/C][C]-666.154[/C][/ROW]
[ROW][C]44[/C][C]6809[/C][C]7629.15[/C][C]-820.154[/C][/ROW]
[/TABLE]
Source: https://freestatistics.org/blog/index.php?pk=267730&T=4

Globally Unique Identifier (entire table): ba.freestatistics.org/blog/index.php?pk=267730&T=4

As an alternative you can also use a QR Code:  

The GUIDs for individual cells are displayed in the table below:

Multiple Linear Regression - Actuals, Interpolation, and Residuals
Time or IndexActualsInterpolationForecastResidualsPrediction Error
163057629.15-1324.15
271797629.15-450.154
373267629.15-303.154
480937629.15463.846
570967629.15-533.154
677387629.15108.846
785767629.15946.846
891967830.41365.6
979087629.15278.846
1087637629.151133.85
1191857629.151555.85
1295107629.151880.85
1374757629.15-154.154
1470837629.15-546.154
1577967629.15166.846
1677277629.1597.8462
1768377629.15-792.154
1869337629.15-696.154
1977497629.15119.846
2076707629.1540.8462
2172687629.15-361.154
2275857629.15-44.1538
2382397629.15609.846
2477487629.15118.846
2575147629.15-115.154
2676657629.1535.8462
2782387629.15608.846
2879887629.15358.846
2972867629.15-343.154
3077787629.15148.846
3181407629.15510.846
3281517629.15521.846
3374787629.15-151.154
3474087629.15-221.154
3577917629.15161.846
3679517830.4120.6
3771707830.4-660.4
3870327830.4-798.4
3978037830.4-27.4
4073097629.15-320.154
4166387629.15-991.154
4265927629.15-1037.15
4369637629.15-666.154
4468097629.15-820.154


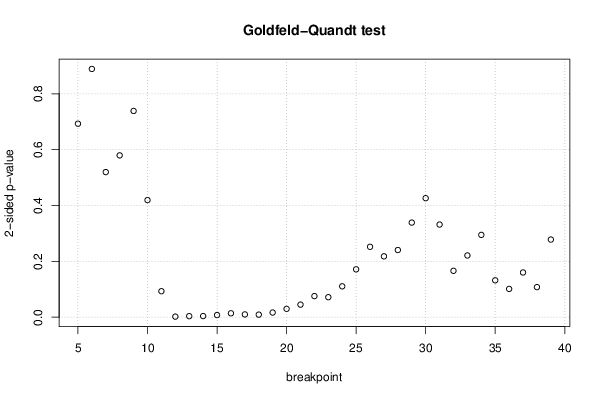
Goldfeld-Quandt test for Heteroskedasticity
p-valuesAlternative Hypothesis
breakpoint indexgreater2-sidedless
50.6536290.6927420.346371
60.5555460.8889070.444454
70.7402380.5195240.259762
80.7102730.5794550.289727
90.6307380.7385240.369262
100.7903690.4192610.209631
110.9534770.09304570.0465228
120.9990350.001930350.000965174
130.9981940.003612320.00180616
140.9979740.004052360.00202618
150.9961850.007629910.00381495
160.9929850.01403050.00701527
170.9950.009999050.00499952
180.9954340.009132250.00456612
190.9916550.01668990.00834495
200.9850470.02990540.0149527
210.9775320.04493690.0224684
220.9622620.07547630.0377381
230.9642110.07157780.0357889
240.9447150.1105710.0552854
250.9142750.1714510.0857254
260.873980.252040.12602
270.8910440.2179120.108956
280.8797320.2405350.120268
290.8306170.3387650.169383
300.7869270.4261460.213073
310.8341240.3317520.165876
320.9169470.1661060.0830532
330.8894810.2210370.110519
340.8526180.2947640.147382
350.9339270.1321460.0660729
360.9494090.1011820.0505912
370.9199250.160150.0800748
380.9461270.1077460.0538729
390.8610150.2779690.138985

\begin{tabular}{lllllllll}
\hline
Goldfeld-Quandt test for Heteroskedasticity \tabularnewline
p-values & Alternative Hypothesis \tabularnewline
breakpoint index & greater & 2-sided & less \tabularnewline
5 & 0.653629 & 0.692742 & 0.346371 \tabularnewline
6 & 0.555546 & 0.888907 & 0.444454 \tabularnewline
7 & 0.740238 & 0.519524 & 0.259762 \tabularnewline
8 & 0.710273 & 0.579455 & 0.289727 \tabularnewline
9 & 0.630738 & 0.738524 & 0.369262 \tabularnewline
10 & 0.790369 & 0.419261 & 0.209631 \tabularnewline
11 & 0.953477 & 0.0930457 & 0.0465228 \tabularnewline
12 & 0.999035 & 0.00193035 & 0.000965174 \tabularnewline
13 & 0.998194 & 0.00361232 & 0.00180616 \tabularnewline
14 & 0.997974 & 0.00405236 & 0.00202618 \tabularnewline
15 & 0.996185 & 0.00762991 & 0.00381495 \tabularnewline
16 & 0.992985 & 0.0140305 & 0.00701527 \tabularnewline
17 & 0.995 & 0.00999905 & 0.00499952 \tabularnewline
18 & 0.995434 & 0.00913225 & 0.00456612 \tabularnewline
19 & 0.991655 & 0.0166899 & 0.00834495 \tabularnewline
20 & 0.985047 & 0.0299054 & 0.0149527 \tabularnewline
21 & 0.977532 & 0.0449369 & 0.0224684 \tabularnewline
22 & 0.962262 & 0.0754763 & 0.0377381 \tabularnewline
23 & 0.964211 & 0.0715778 & 0.0357889 \tabularnewline
24 & 0.944715 & 0.110571 & 0.0552854 \tabularnewline
25 & 0.914275 & 0.171451 & 0.0857254 \tabularnewline
26 & 0.87398 & 0.25204 & 0.12602 \tabularnewline
27 & 0.891044 & 0.217912 & 0.108956 \tabularnewline
28 & 0.879732 & 0.240535 & 0.120268 \tabularnewline
29 & 0.830617 & 0.338765 & 0.169383 \tabularnewline
30 & 0.786927 & 0.426146 & 0.213073 \tabularnewline
31 & 0.834124 & 0.331752 & 0.165876 \tabularnewline
32 & 0.916947 & 0.166106 & 0.0830532 \tabularnewline
33 & 0.889481 & 0.221037 & 0.110519 \tabularnewline
34 & 0.852618 & 0.294764 & 0.147382 \tabularnewline
35 & 0.933927 & 0.132146 & 0.0660729 \tabularnewline
36 & 0.949409 & 0.101182 & 0.0505912 \tabularnewline
37 & 0.919925 & 0.16015 & 0.0800748 \tabularnewline
38 & 0.946127 & 0.107746 & 0.0538729 \tabularnewline
39 & 0.861015 & 0.277969 & 0.138985 \tabularnewline
\hline
\end{tabular}
%Source: https://freestatistics.org/blog/index.php?pk=267730&T=5

[TABLE]
[ROW][C]Goldfeld-Quandt test for Heteroskedasticity[/C][/ROW]
[ROW][C]p-values[/C][C]Alternative Hypothesis[/C][/ROW]
[ROW][C]breakpoint index[/C][C]greater[/C][C]2-sided[/C][C]less[/C][/ROW]
[ROW][C]5[/C][C]0.653629[/C][C]0.692742[/C][C]0.346371[/C][/ROW]
[ROW][C]6[/C][C]0.555546[/C][C]0.888907[/C][C]0.444454[/C][/ROW]
[ROW][C]7[/C][C]0.740238[/C][C]0.519524[/C][C]0.259762[/C][/ROW]
[ROW][C]8[/C][C]0.710273[/C][C]0.579455[/C][C]0.289727[/C][/ROW]
[ROW][C]9[/C][C]0.630738[/C][C]0.738524[/C][C]0.369262[/C][/ROW]
[ROW][C]10[/C][C]0.790369[/C][C]0.419261[/C][C]0.209631[/C][/ROW]
[ROW][C]11[/C][C]0.953477[/C][C]0.0930457[/C][C]0.0465228[/C][/ROW]
[ROW][C]12[/C][C]0.999035[/C][C]0.00193035[/C][C]0.000965174[/C][/ROW]
[ROW][C]13[/C][C]0.998194[/C][C]0.00361232[/C][C]0.00180616[/C][/ROW]
[ROW][C]14[/C][C]0.997974[/C][C]0.00405236[/C][C]0.00202618[/C][/ROW]
[ROW][C]15[/C][C]0.996185[/C][C]0.00762991[/C][C]0.00381495[/C][/ROW]
[ROW][C]16[/C][C]0.992985[/C][C]0.0140305[/C][C]0.00701527[/C][/ROW]
[ROW][C]17[/C][C]0.995[/C][C]0.00999905[/C][C]0.00499952[/C][/ROW]
[ROW][C]18[/C][C]0.995434[/C][C]0.00913225[/C][C]0.00456612[/C][/ROW]
[ROW][C]19[/C][C]0.991655[/C][C]0.0166899[/C][C]0.00834495[/C][/ROW]
[ROW][C]20[/C][C]0.985047[/C][C]0.0299054[/C][C]0.0149527[/C][/ROW]
[ROW][C]21[/C][C]0.977532[/C][C]0.0449369[/C][C]0.0224684[/C][/ROW]
[ROW][C]22[/C][C]0.962262[/C][C]0.0754763[/C][C]0.0377381[/C][/ROW]
[ROW][C]23[/C][C]0.964211[/C][C]0.0715778[/C][C]0.0357889[/C][/ROW]
[ROW][C]24[/C][C]0.944715[/C][C]0.110571[/C][C]0.0552854[/C][/ROW]
[ROW][C]25[/C][C]0.914275[/C][C]0.171451[/C][C]0.0857254[/C][/ROW]
[ROW][C]26[/C][C]0.87398[/C][C]0.25204[/C][C]0.12602[/C][/ROW]
[ROW][C]27[/C][C]0.891044[/C][C]0.217912[/C][C]0.108956[/C][/ROW]
[ROW][C]28[/C][C]0.879732[/C][C]0.240535[/C][C]0.120268[/C][/ROW]
[ROW][C]29[/C][C]0.830617[/C][C]0.338765[/C][C]0.169383[/C][/ROW]
[ROW][C]30[/C][C]0.786927[/C][C]0.426146[/C][C]0.213073[/C][/ROW]
[ROW][C]31[/C][C]0.834124[/C][C]0.331752[/C][C]0.165876[/C][/ROW]
[ROW][C]32[/C][C]0.916947[/C][C]0.166106[/C][C]0.0830532[/C][/ROW]
[ROW][C]33[/C][C]0.889481[/C][C]0.221037[/C][C]0.110519[/C][/ROW]
[ROW][C]34[/C][C]0.852618[/C][C]0.294764[/C][C]0.147382[/C][/ROW]
[ROW][C]35[/C][C]0.933927[/C][C]0.132146[/C][C]0.0660729[/C][/ROW]
[ROW][C]36[/C][C]0.949409[/C][C]0.101182[/C][C]0.0505912[/C][/ROW]
[ROW][C]37[/C][C]0.919925[/C][C]0.16015[/C][C]0.0800748[/C][/ROW]
[ROW][C]38[/C][C]0.946127[/C][C]0.107746[/C][C]0.0538729[/C][/ROW]
[ROW][C]39[/C][C]0.861015[/C][C]0.277969[/C][C]0.138985[/C][/ROW]
[/TABLE]
Source: https://freestatistics.org/blog/index.php?pk=267730&T=5

Globally Unique Identifier (entire table): ba.freestatistics.org/blog/index.php?pk=267730&T=5

As an alternative you can also use a QR Code:  

The GUIDs for individual cells are displayed in the table below:

Goldfeld-Quandt test for Heteroskedasticity
p-valuesAlternative Hypothesis
breakpoint indexgreater2-sidedless
50.6536290.6927420.346371
60.5555460.8889070.444454
70.7402380.5195240.259762
80.7102730.5794550.289727
90.6307380.7385240.369262
100.7903690.4192610.209631
110.9534770.09304570.0465228
120.9990350.001930350.000965174
130.9981940.003612320.00180616
140.9979740.004052360.00202618
150.9961850.007629910.00381495
160.9929850.01403050.00701527
170.9950.009999050.00499952
180.9954340.009132250.00456612
190.9916550.01668990.00834495
200.9850470.02990540.0149527
210.9775320.04493690.0224684
220.9622620.07547630.0377381
230.9642110.07157780.0357889
240.9447150.1105710.0552854
250.9142750.1714510.0857254
260.873980.252040.12602
270.8910440.2179120.108956
280.8797320.2405350.120268
290.8306170.3387650.169383
300.7869270.4261460.213073
310.8341240.3317520.165876
320.9169470.1661060.0830532
330.8894810.2210370.110519
340.8526180.2947640.147382
350.9339270.1321460.0660729
360.9494090.1011820.0505912
370.9199250.160150.0800748
380.9461270.1077460.0538729
390.8610150.2779690.138985


Meta Analysis of Goldfeld-Quandt test for Heteroskedasticity
Description# significant tests% significant testsOK/NOK
1% type I error level60.171429NOK
5% type I error level100.285714NOK
10% type I error level130.371429NOK

\begin{tabular}{lllllllll}
\hline
Meta Analysis of Goldfeld-Quandt test for Heteroskedasticity \tabularnewline
Description & # significant tests & % significant tests & OK/NOK \tabularnewline
1% type I error level & 6 & 0.171429 & NOK \tabularnewline
5% type I error level & 10 & 0.285714 & NOK \tabularnewline
10% type I error level & 13 & 0.371429 & NOK \tabularnewline
\hline
\end{tabular}
%Source: https://freestatistics.org/blog/index.php?pk=267730&T=6

[TABLE]
[ROW][C]Meta Analysis of Goldfeld-Quandt test for Heteroskedasticity[/C][/ROW]
[ROW][C]Description[/C][C]# significant tests[/C][C]% significant tests[/C][C]OK/NOK[/C][/ROW]
[ROW][C]1% type I error level[/C][C]6[/C][C]0.171429[/C][C]NOK[/C][/ROW]
[ROW][C]5% type I error level[/C][C]10[/C][C]0.285714[/C][C]NOK[/C][/ROW]
[ROW][C]10% type I error level[/C][C]13[/C][C]0.371429[/C][C]NOK[/C][/ROW]
[/TABLE]
Source: https://freestatistics.org/blog/index.php?pk=267730&T=6

Globally Unique Identifier (entire table): ba.freestatistics.org/blog/index.php?pk=267730&T=6

As an alternative you can also use a QR Code:  

The GUIDs for individual cells are displayed in the table below:

Meta Analysis of Goldfeld-Quandt test for Heteroskedasticity
Description# significant tests% significant testsOK/NOK
1% type I error level60.171429NOK
5% type I error level100.285714NOK
10% type I error level130.371429NOK


Parameters (Session):
par1 = 1 ; par2 = Do not include Seasonal Dummies ; par3 = No Linear Trend ;
Parameters (R input):
par1 = 1 ; par2 = Do not include Seasonal Dummies ; par3 = No Linear Trend ;
R code (references can be found in the software module):
library(lattice)
library(lmtest)
n25 <- 25 #minimum number of obs. for Goldfeld-Quandt test
par1 <- as.numeric(par1)
x <- t(y)
k <- length(x[1,])
n <- length(x[,1])
x1 <- cbind(x[,par1], x[,1:k!=par1])
mycolnames <- c(colnames(x)[par1], colnames(x)[1:k!=par1])
colnames(x1) <- mycolnames #colnames(x)[par1]
x <- x1
if (par3 == 'First Differences'){
x2 <- array(0, dim=c(n-1,k), dimnames=list(1:(n-1), paste('(1-B)',colnames(x),sep='')))
for (i in 1:n-1) {
for (j in 1:k) {
x2[i,j] <- x[i+1,j] - x[i,j]
}
}
x <- x2
}
if (par2 == 'Include Monthly Dummies'){
x2 <- array(0, dim=c(n,11), dimnames=list(1:n, paste('M', seq(1:11), sep ='')))
for (i in 1:11){
x2[seq(i,n,12),i] <- 1
}
x <- cbind(x, x2)
}
if (par2 == 'Include Quarterly Dummies'){
x2 <- array(0, dim=c(n,3), dimnames=list(1:n, paste('Q', seq(1:3), sep ='')))
for (i in 1:3){
x2[seq(i,n,4),i] <- 1
}
x <- cbind(x, x2)
}
k <- length(x[1,])
if (par3 == 'Linear Trend'){
x <- cbind(x, c(1:n))
colnames(x)[k+1] <- 't'
}
x
k <- length(x[1,])
df <- as.data.frame(x)
(mylm <- lm(df))
(mysum <- summary(mylm))
if (n > n25) {
kp3 <- k + 3
nmkm3 <- n - k - 3
gqarr <- array(NA, dim=c(nmkm3-kp3+1,3))
numgqtests <- 0
numsignificant1 <- 0
numsignificant5 <- 0
numsignificant10 <- 0
for (mypoint in kp3:nmkm3) {
j <- 0
numgqtests <- numgqtests + 1
for (myalt in c('greater', 'two.sided', 'less')) {
j <- j + 1
gqarr[mypoint-kp3+1,j] <- gqtest(mylm, point=mypoint, alternative=myalt)$p.value
}
if (gqarr[mypoint-kp3+1,2] < 0.01) numsignificant1 <- numsignificant1 + 1
if (gqarr[mypoint-kp3+1,2] < 0.05) numsignificant5 <- numsignificant5 + 1
if (gqarr[mypoint-kp3+1,2] < 0.10) numsignificant10 <- numsignificant10 + 1
}
gqarr
}
bitmap(file='test0.png')
plot(x[,1], type='l', main='Actuals and Interpolation', ylab='value of Actuals and Interpolation (dots)', xlab='time or index')
points(x[,1]-mysum$resid)
grid()
dev.off()
bitmap(file='test1.png')
plot(mysum$resid, type='b', pch=19, main='Residuals', ylab='value of Residuals', xlab='time or index')
grid()
dev.off()
bitmap(file='test2.png')
hist(mysum$resid, main='Residual Histogram', xlab='values of Residuals')
grid()
dev.off()
bitmap(file='test3.png')
densityplot(~mysum$resid,col='black',main='Residual Density Plot', xlab='values of Residuals')
dev.off()
bitmap(file='test4.png')
qqnorm(mysum$resid, main='Residual Normal Q-Q Plot')
qqline(mysum$resid)
grid()
dev.off()
(myerror <- as.ts(mysum$resid))
bitmap(file='test5.png')
dum <- cbind(lag(myerror,k=1),myerror)
dum
dum1 <- dum[2:length(myerror),]
dum1
z <- as.data.frame(dum1)
z
plot(z,main=paste('Residual Lag plot, lowess, and regression line'), ylab='values of Residuals', xlab='lagged values of Residuals')
lines(lowess(z))
abline(lm(z))
grid()
dev.off()
bitmap(file='test6.png')
acf(mysum$resid, lag.max=length(mysum$resid)/2, main='Residual Autocorrelation Function')
grid()
dev.off()
bitmap(file='test7.png')
pacf(mysum$resid, lag.max=length(mysum$resid)/2, main='Residual Partial Autocorrelation Function')
grid()
dev.off()
bitmap(file='test8.png')
opar <- par(mfrow = c(2,2), oma = c(0, 0, 1.1, 0))
plot(mylm, las = 1, sub='Residual Diagnostics')
par(opar)
dev.off()
if (n > n25) {
bitmap(file='test9.png')
plot(kp3:nmkm3,gqarr[,2], main='Goldfeld-Quandt test',ylab='2-sided p-value',xlab='breakpoint')
grid()
dev.off()
}
load(file='createtable')
a<-table.start()
a<-table.row.start(a)
a<-table.element(a, 'Multiple Linear Regression - Estimated Regression Equation', 1, TRUE)
a<-table.row.end(a)
myeq <- colnames(x)[1]
myeq <- paste(myeq, '[t] = ', sep='')
for (i in 1:k){
if (mysum$coefficients[i,1] > 0) myeq <- paste(myeq, '+', '')
myeq <- paste(myeq, signif(mysum$coefficients[i,1],6), sep=' ')
if (rownames(mysum$coefficients)[i] != '(Intercept)') {
myeq <- paste(myeq, rownames(mysum$coefficients)[i], sep='')
if (rownames(mysum$coefficients)[i] != 't') myeq <- paste(myeq, '[t]', sep='')
}
}
myeq <- paste(myeq, ' + e[t]')
a<-table.row.start(a)
a<-table.element(a, myeq)
a<-table.row.end(a)
a<-table.end(a)
table.save(a,file='mytable1.tab')
a<-table.start()
a<-table.row.start(a)
a<-table.element(a,hyperlink('ols1.htm','Multiple Linear Regression - Ordinary Least Squares',''), 6, TRUE)
a<-table.row.end(a)
a<-table.row.start(a)
a<-table.element(a,'Variable',header=TRUE)
a<-table.element(a,'Parameter',header=TRUE)
a<-table.element(a,'S.D.',header=TRUE)
a<-table.element(a,'T-STAT
H0: parameter = 0',header=TRUE)
a<-table.element(a,'2-tail p-value',header=TRUE)
a<-table.element(a,'1-tail p-value',header=TRUE)
a<-table.row.end(a)
for (i in 1:k){
a<-table.row.start(a)
a<-table.element(a,rownames(mysum$coefficients)[i],header=TRUE)
a<-table.element(a,signif(mysum$coefficients[i,1],6))
a<-table.element(a, signif(mysum$coefficients[i,2],6))
a<-table.element(a, signif(mysum$coefficients[i,3],4))
a<-table.element(a, signif(mysum$coefficients[i,4],6))
a<-table.element(a, signif(mysum$coefficients[i,4]/2,6))
a<-table.row.end(a)
}
a<-table.end(a)
table.save(a,file='mytable2.tab')
a<-table.start()
a<-table.row.start(a)
a<-table.element(a, 'Multiple Linear Regression - Regression Statistics', 2, TRUE)
a<-table.row.end(a)
a<-table.row.start(a)
a<-table.element(a, 'Multiple R',1,TRUE)
a<-table.element(a, signif(sqrt(mysum$r.squared),6))
a<-table.row.end(a)
a<-table.row.start(a)
a<-table.element(a, 'R-squared',1,TRUE)
a<-table.element(a, signif(mysum$r.squared,6))
a<-table.row.end(a)
a<-table.row.start(a)
a<-table.element(a, 'Adjusted R-squared',1,TRUE)
a<-table.element(a, signif(mysum$adj.r.squared,6))
a<-table.row.end(a)
a<-table.row.start(a)
a<-table.element(a, 'F-TEST (value)',1,TRUE)
a<-table.element(a, signif(mysum$fstatistic[1],6))
a<-table.row.end(a)
a<-table.row.start(a)
a<-table.element(a, 'F-TEST (DF numerator)',1,TRUE)
a<-table.element(a, signif(mysum$fstatistic[2],6))
a<-table.row.end(a)
a<-table.row.start(a)
a<-table.element(a, 'F-TEST (DF denominator)',1,TRUE)
a<-table.element(a, signif(mysum$fstatistic[3],6))
a<-table.row.end(a)
a<-table.row.start(a)
a<-table.element(a, 'p-value',1,TRUE)
a<-table.element(a, signif(1-pf(mysum$fstatistic[1],mysum$fstatistic[2],mysum$fstatistic[3]),6))
a<-table.row.end(a)
a<-table.row.start(a)
a<-table.element(a, 'Multiple Linear Regression - Residual Statistics', 2, TRUE)
a<-table.row.end(a)
a<-table.row.start(a)
a<-table.element(a, 'Residual Standard Deviation',1,TRUE)
a<-table.element(a, signif(mysum$sigma,6))
a<-table.row.end(a)
a<-table.row.start(a)
a<-table.element(a, 'Sum Squared Residuals',1,TRUE)
a<-table.element(a, signif(sum(myerror*myerror),6))
a<-table.row.end(a)
a<-table.end(a)
table.save(a,file='mytable3.tab')
a<-table.start()
a<-table.row.start(a)
a<-table.element(a, 'Multiple Linear Regression - Actuals, Interpolation, and Residuals', 4, TRUE)
a<-table.row.end(a)
a<-table.row.start(a)
a<-table.element(a, 'Time or Index', 1, TRUE)
a<-table.element(a, 'Actuals', 1, TRUE)
a<-table.element(a, 'Interpolation
Forecast', 1, TRUE)
a<-table.element(a, 'Residuals
Prediction Error', 1, TRUE)
a<-table.row.end(a)
for (i in 1:n) {
a<-table.row.start(a)
a<-table.element(a,i, 1, TRUE)
a<-table.element(a,signif(x[i],6))
a<-table.element(a,signif(x[i]-mysum$resid[i],6))
a<-table.element(a,signif(mysum$resid[i],6))
a<-table.row.end(a)
}
a<-table.end(a)
table.save(a,file='mytable4.tab')
if (n > n25) {
a<-table.start()
a<-table.row.start(a)
a<-table.element(a,'Goldfeld-Quandt test for Heteroskedasticity',4,TRUE)
a<-table.row.end(a)
a<-table.row.start(a)
a<-table.element(a,'p-values',header=TRUE)
a<-table.element(a,'Alternative Hypothesis',3,header=TRUE)
a<-table.row.end(a)
a<-table.row.start(a)
a<-table.element(a,'breakpoint index',header=TRUE)
a<-table.element(a,'greater',header=TRUE)
a<-table.element(a,'2-sided',header=TRUE)
a<-table.element(a,'less',header=TRUE)
a<-table.row.end(a)
for (mypoint in kp3:nmkm3) {
a<-table.row.start(a)
a<-table.element(a,mypoint,header=TRUE)
a<-table.element(a,signif(gqarr[mypoint-kp3+1,1],6))
a<-table.element(a,signif(gqarr[mypoint-kp3+1,2],6))
a<-table.element(a,signif(gqarr[mypoint-kp3+1,3],6))
a<-table.row.end(a)
}
a<-table.end(a)
table.save(a,file='mytable5.tab')
a<-table.start()
a<-table.row.start(a)
a<-table.element(a,'Meta Analysis of Goldfeld-Quandt test for Heteroskedasticity',4,TRUE)
a<-table.row.end(a)
a<-table.row.start(a)
a<-table.element(a,'Description',header=TRUE)
a<-table.element(a,'# significant tests',header=TRUE)
a<-table.element(a,'% significant tests',header=TRUE)
a<-table.element(a,'OK/NOK',header=TRUE)
a<-table.row.end(a)
a<-table.row.start(a)
a<-table.element(a,'1% type I error level',header=TRUE)
a<-table.element(a,signif(numsignificant1,6))
a<-table.element(a,signif(numsignificant1/numgqtests,6))
if (numsignificant1/numgqtests < 0.01) dum <- 'OK' else dum <- 'NOK'
a<-table.element(a,dum)
a<-table.row.end(a)
a<-table.row.start(a)
a<-table.element(a,'5% type I error level',header=TRUE)
a<-table.element(a,signif(numsignificant5,6))
a<-table.element(a,signif(numsignificant5/numgqtests,6))
if (numsignificant5/numgqtests < 0.05) dum <- 'OK' else dum <- 'NOK'
a<-table.element(a,dum)
a<-table.row.end(a)
a<-table.row.start(a)
a<-table.element(a,'10% type I error level',header=TRUE)
a<-table.element(a,signif(numsignificant10,6))
a<-table.element(a,signif(numsignificant10/numgqtests,6))
if (numsignificant10/numgqtests < 0.1) dum <- 'OK' else dum <- 'NOK'
a<-table.element(a,dum)
a<-table.row.end(a)
a<-table.end(a)
table.save(a,file='mytable6.tab')
}