Free Statistics
of Irreproducible Research!
Description of Statistical Computation | |||||||||||||||||||||
|---|---|---|---|---|---|---|---|---|---|---|---|---|---|---|---|---|---|---|---|---|---|
| Author's title | |||||||||||||||||||||
| Author | *The author of this computation has been verified* | ||||||||||||||||||||
| R Software Module | rwasp_skewness_kurtosis_plot.wasp | ||||||||||||||||||||
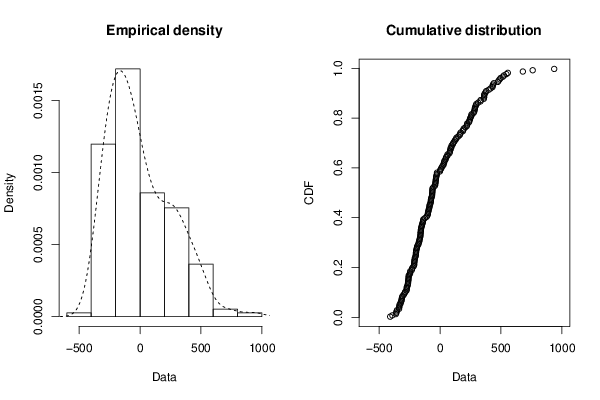
| Title produced by software | Skewness-Kurtosis Plot | ||||||||||||||||||||
| Date of computation | Fri, 04 Dec 2015 22:41:54 +0000 | ||||||||||||||||||||
| Cite this page as follows | Statistical Computations at FreeStatistics.org, Office for Research Development and Education, URL https://freestatistics.org/blog/index.php?v=date/2015/Dec/04/t1449271847o2d4uvdwzm4b2t0.htm/, Retrieved Thu, 06 Jun 2024 05:21:55 +0000 | ||||||||||||||||||||
| Statistical Computations at FreeStatistics.org, Office for Research Development and Education, URL https://freestatistics.org/blog/index.php?pk=285186, Retrieved Thu, 06 Jun 2024 05:21:55 +0000 | |||||||||||||||||||||
| QR Codes: | |||||||||||||||||||||
|
| |||||||||||||||||||||
| Original text written by user: | |||||||||||||||||||||
| IsPrivate? | No (this computation is public) | ||||||||||||||||||||
| User-defined keywords | |||||||||||||||||||||
| Estimated Impact | 117 | ||||||||||||||||||||
Tree of Dependent Computations | |||||||||||||||||||||
| Family? (F = Feedback message, R = changed R code, M = changed R Module, P = changed Parameters, D = changed Data) | |||||||||||||||||||||
| - [Skewness-Kurtosis Plot] [] [2015-12-04 22:41:54] [63a9f0ea7bb98050796b649e85481845] [Current] | |||||||||||||||||||||
| Feedback Forum | |||||||||||||||||||||
Post a new message | |||||||||||||||||||||
Dataset | |||||||||||||||||||||
| Dataseries X: | |||||||||||||||||||||
-30.75 -209.8 -210.8 -332.8 -85.75 -206.8 -158.8 -87.75 -138.8 -64.75 434.2 430.2 34.25 47.25 -0.7515 -159.8 -142.8 -197.8 87.25 82.25 1.249 290.2 524.2 760.2 312.2 -62.75 -24.75 -94.75 87.25 28.25 77.25 208.2 -98.75 274.2 515.2 474.2 362.2 50.25 117.2 -148.8 258.2 135.2 247.2 -28.75 60.25 258.2 679.2 936.2 379.2 245.2 -40.75 223.2 285.2 95.25 294.2 194.2 366.2 362.2 400.2 432.2 -109.8 -214.8 -169.8 -335.8 13.25 80.25 61.25 169.2 286.2 359.2 374.2 333.2 -140.8 -361.8 -65.75 -335.8 -198.8 -296.8 -275.8 -174.8 -61.75 -156.8 187.2 481.2 -244.8 -62.75 -310.8 -322.8 -187.8 -408.8 -191.8 -390.8 -90.75 30.25 240.2 556.2 -69.75 -316.8 -306.8 -314.8 -323.8 -197.8 -189.8 -74.75 -202.8 -32.75 282.2 497.2 238.2 -255.8 -154.8 -258.8 -271.8 -95.75 -60.75 -79.75 -74.75 -34.75 332.2 544.2 95.25 -272.8 44.25 -256.8 -161.8 -286.8 -290.8 -163.8 -72.75 -64.75 298.2 489.2 -52.75 -356.8 -211.8 -357.8 -264.8 -195.8 -257.8 -165.8 -169.8 109.2 19.25 223.2 -243.8 -259.8 -175.8 -313.8 -195.8 -332.8 -76.75 -207.8 -36.75 220.2 150.2 8.249 -261.8 -272.8 -261.8 -352.8 -230.8 -159.8 -229.8 -33.75 -123.8 132.2 280.2 361.2 -223.8 -264.7 -103.7 -153.7 -85.7 -245.7 -147.7 -182.7 105.3 165.3 161.3 191.3 35.3 -156.7 -39.7 -211.7 -24.7 -136.7 -99.7 -37.7 122.3 253.3 415.3 441.3 | |||||||||||||||||||||
Tables (Output of Computation) | |||||||||||||||||||||
| |||||||||||||||||||||
Figures (Output of Computation) | |||||||||||||||||||||
Input Parameters & R Code | |||||||||||||||||||||
| Parameters (Session): | |||||||||||||||||||||
| Parameters (R input): | |||||||||||||||||||||
| R code (references can be found in the software module): | |||||||||||||||||||||
library(fitdistrplus) | |||||||||||||||||||||