Free Statistics

of Irreproducible Research!

Author's title

Author*The author of this computation has been verified*
R Software Modulerwasp_hierarchicalclustering.wasp
Title produced by softwareHierarchical Clustering
Date of computationWed, 12 Nov 2008 11:58:10 -0700
Cite this page as followsStatistical Computations at FreeStatistics.org, Office for Research Development and Education, URL https://freestatistics.org/blog/index.php?v=date/2008/Nov/12/t122651661441zvhk2re3jjm2x.htm/, Retrieved Sat, 18 May 2024 22:31:29 +0000
Statistical Computations at FreeStatistics.org, Office for Research Development and Education, URL https://freestatistics.org/blog/index.php?pk=24386, Retrieved Sat, 18 May 2024 22:31:29 +0000
QR Codes:

Original text written by user:
IsPrivate?No (this computation is public)
User-defined keywordshierarchical
Estimated Impact154
Family? (F = Feedback message, R = changed R code, M = changed R Module, P = changed Parameters, D = changed Data)
F     [Hierarchical Clustering] [Hierarchical Clus...] [2008-11-11 11:00:46] [94862dbeb1b738961deecd49975f349b]
F   PD    [Hierarchical Clustering] [hierarchical clus...] [2008-11-12 18:58:10] [35c75b0726318bf2908e4a56ed2df1a9] [Current]
Feedback Forum
2008-11-21 22:05:29 [Gilliam Schoorel] [reply
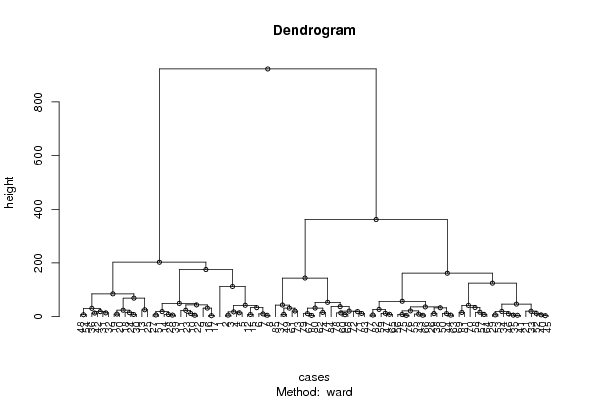
De dendogram gaat de tijdreeksen opdelen in twee clusters. Elke cluster wordt steeds opnieuw opgedeeld tot men aan een periode komt. Ze vergelijkt gelijkaardige gegevens van de variabelen. Goede oplossing
2008-11-24 15:24:10 [Ellen Van den Broeck] [reply
Dus de gegevens worden opgedeeld per periodes die op elkaar gelijken of dezelfde kenmerken vertonen. Iedere verdere vertakking bevat periodes die iets gemeenschappelijk hebben. Deze dendogram is zeer ver vertakt.

Post a new message
Dataseries X:
62.2	 43.5	200.7
88.5	 37.7	146.5
93.3	 36.8	143.6
89.2	 24.4	141.5
101.3	 31.3	137.5
97	 43.9	138.7
102.2	 53.6	135.5
100.3	 48.9	136.4
78.2	 30.9	112.1
105.9	 31.8	109
119.9 41.3	  123.8
108	 43.7	151.2
77	 54.1	139.2
93.1	 47.8	115.7
109.5	 36.7	147.6
100.4	 30.8	126.1
99	 31.9	122.8
113.9	 61.7	137.3
102.1	 73	  142
101.6	 64.7	137.4
84	 24.2	89.4
110.7	 33.9	108
111.6	 32.4	117.7
110.7	 63.2	127.3
73.1	 71.8	121
87.5	 60.4	104.1
109.6	 48	119.5
99.3	 44.5	116.7
92.1	 44.9	96.1
109.3	 70.9	125
94.5	 72.7	118.8
91.4	 59.5	114.9
82.9	 35.9	79.3
103.3	 40	  90.5
96	 43.6	87.8
104.8	 57.2	109.4
65.8	 75.8	88.9
78.7	 57.7	97.4
100.3 47.7	  112
85	 42.3	86.8
94.5	 43	  82.9
97.9	 68	  105.2
91.9	 70.6	89.1
87.2	 54.2	85.5
84.4	 38.6	87.1
99.2	 40.3	85.2
105.4	 49.2	88.2
110.9	 68.5	104
69.8	 75.9	96.4
86.8	 63.2	82.3
106.7	 49.8	114.1
88.8	 37	  88.9
96.9	 48.8	93.6
108.1	 74.9	101.8
93.7	 75.3	96.6
94.8	 66.9	93.7
79.8	 44.1	68.4
95.6	 39.8	68.7
107.9	 56.6	81.2
104.9	 77.1	85.1
61.9	 78.5	75.4
85.7	 70.6	71.6
92.4	 54.2	83
86.4	 47.2	72.3
99.3	 55.1	90.2
95.5	 74.5	89
97	 88	  84.9
102.1	 80.8	90.9
77.8	 54.4	46.6
105.5	 55.2	55.4
113.2	 73.8	88.7
108.8	 85.3	76
66.9	 98.7	76.9
89.3	 86.1	72.1
93.6	 62.5	90
92	 58.6	92.3
99.5	 67	  78
98.6	 88.4	93.9
94.6	 96.5	84.5
96.7	 87.1	80.4
75.3	 61.2	60.5
102.5	 62.5	75.3
115.1	 85.2	91.5
104.7	 101.7	105.2
71.4	 113.7	92.7


Summary of computational transaction
Raw Inputview raw input (R code)
Raw Outputview raw output of R engine
Computing time2 seconds
R Server'Gwilym Jenkins' @ 72.249.127.135

\begin{tabular}{lllllllll}
\hline
Summary of computational transaction \tabularnewline
Raw Input & view raw input (R code)  \tabularnewline
Raw Output & view raw output of R engine  \tabularnewline
Computing time & 2 seconds \tabularnewline
R Server & 'Gwilym Jenkins' @ 72.249.127.135 \tabularnewline
\hline
\end{tabular}
%Source: https://freestatistics.org/blog/index.php?pk=24386&T=0

[TABLE]
[ROW][C]Summary of computational transaction[/C][/ROW]
[ROW][C]Raw Input[/C][C]view raw input (R code) [/C][/ROW]
[ROW][C]Raw Output[/C][C]view raw output of R engine [/C][/ROW]
[ROW][C]Computing time[/C][C]2 seconds[/C][/ROW]
[ROW][C]R Server[/C][C]'Gwilym Jenkins' @ 72.249.127.135[/C][/ROW]
[/TABLE]
Source: https://freestatistics.org/blog/index.php?pk=24386&T=0

Globally Unique Identifier (entire table): ba.freestatistics.org/blog/index.php?pk=24386&T=0

As an alternative you can also use a QR Code:  

The GUIDs for individual cells are displayed in the table below:

Summary of computational transaction
Raw Inputview raw input (R code)
Raw Outputview raw output of R engine
Computing time2 seconds
R Server'Gwilym Jenkins' @ 72.249.127.135


Summary of Dendrogram
LabelHeight
13.74966665185053
23.76031913539263
34.59891291502677
44.80208288141718
55.1487862647424
65.15945733580576
75.3084837759948
85.33385414123783
95.67978872846517
105.72632889513846
115.76974869470067
125.77321400954443
136.04483250388297
146.38827050147378
156.65806144472115
166.67083203206317
177.32393336944023
187.42765104188398
198.01311425102625
208.15720540381325
218.20228987643107
228.22834381117324
238.26922003577121
248.50058821494136
258.71894489029493
269.48602495241368
279.50263121456367
2810.2029644138025
2910.9242212456256
3011.3399800956223
3111.3850779531806
3211.5323656253959
3311.7385307321470
3411.8915936694793
3512.2912119092932
3612.444955970077
3713.4866600757934
3813.8811042129643
3914.1088624630053
4014.4920667953194
4115.0410359466301
4215.6748205731358
4315.9204271299485
4416.3908218441782
4517.8266993247784
4618.5741683916382
4718.7680628117252
4818.9832594757116
4919.5452875756097
5020.2885410306815
5120.6052819647626
5220.8636046741688
5321.3449239510999
5423.6397113048711
5523.9900922615064
5625.6854044157377
5727.0159606945415
5831.0573737150870
5931.7750944194458
6031.8555300413931
6132.0179864797182
6233.1860959278244
6333.6504516095465
6433.946598447509
6536.3055062500737
6637.2580674919272
6741.9563652262156
6842.3787672712521
6943.4183873064041
7043.7968622407546
7146.7511332021842
7249.2947627942733
7353.3274303249379
7457.3164566420601
7568.9222504554683
7684.905491216104
77112.476001114202
78124.894875240283
79143.902023138068
80161.794252558235
81175.511990556912
82202.793574212824
83361.942616892302
84922.954746322548

\begin{tabular}{lllllllll}
\hline
Summary of Dendrogram \tabularnewline
Label & Height \tabularnewline
1 & 3.74966665185053 \tabularnewline
2 & 3.76031913539263 \tabularnewline
3 & 4.59891291502677 \tabularnewline
4 & 4.80208288141718 \tabularnewline
5 & 5.1487862647424 \tabularnewline
6 & 5.15945733580576 \tabularnewline
7 & 5.3084837759948 \tabularnewline
8 & 5.33385414123783 \tabularnewline
9 & 5.67978872846517 \tabularnewline
10 & 5.72632889513846 \tabularnewline
11 & 5.76974869470067 \tabularnewline
12 & 5.77321400954443 \tabularnewline
13 & 6.04483250388297 \tabularnewline
14 & 6.38827050147378 \tabularnewline
15 & 6.65806144472115 \tabularnewline
16 & 6.67083203206317 \tabularnewline
17 & 7.32393336944023 \tabularnewline
18 & 7.42765104188398 \tabularnewline
19 & 8.01311425102625 \tabularnewline
20 & 8.15720540381325 \tabularnewline
21 & 8.20228987643107 \tabularnewline
22 & 8.22834381117324 \tabularnewline
23 & 8.26922003577121 \tabularnewline
24 & 8.50058821494136 \tabularnewline
25 & 8.71894489029493 \tabularnewline
26 & 9.48602495241368 \tabularnewline
27 & 9.50263121456367 \tabularnewline
28 & 10.2029644138025 \tabularnewline
29 & 10.9242212456256 \tabularnewline
30 & 11.3399800956223 \tabularnewline
31 & 11.3850779531806 \tabularnewline
32 & 11.5323656253959 \tabularnewline
33 & 11.7385307321470 \tabularnewline
34 & 11.8915936694793 \tabularnewline
35 & 12.2912119092932 \tabularnewline
36 & 12.444955970077 \tabularnewline
37 & 13.4866600757934 \tabularnewline
38 & 13.8811042129643 \tabularnewline
39 & 14.1088624630053 \tabularnewline
40 & 14.4920667953194 \tabularnewline
41 & 15.0410359466301 \tabularnewline
42 & 15.6748205731358 \tabularnewline
43 & 15.9204271299485 \tabularnewline
44 & 16.3908218441782 \tabularnewline
45 & 17.8266993247784 \tabularnewline
46 & 18.5741683916382 \tabularnewline
47 & 18.7680628117252 \tabularnewline
48 & 18.9832594757116 \tabularnewline
49 & 19.5452875756097 \tabularnewline
50 & 20.2885410306815 \tabularnewline
51 & 20.6052819647626 \tabularnewline
52 & 20.8636046741688 \tabularnewline
53 & 21.3449239510999 \tabularnewline
54 & 23.6397113048711 \tabularnewline
55 & 23.9900922615064 \tabularnewline
56 & 25.6854044157377 \tabularnewline
57 & 27.0159606945415 \tabularnewline
58 & 31.0573737150870 \tabularnewline
59 & 31.7750944194458 \tabularnewline
60 & 31.8555300413931 \tabularnewline
61 & 32.0179864797182 \tabularnewline
62 & 33.1860959278244 \tabularnewline
63 & 33.6504516095465 \tabularnewline
64 & 33.946598447509 \tabularnewline
65 & 36.3055062500737 \tabularnewline
66 & 37.2580674919272 \tabularnewline
67 & 41.9563652262156 \tabularnewline
68 & 42.3787672712521 \tabularnewline
69 & 43.4183873064041 \tabularnewline
70 & 43.7968622407546 \tabularnewline
71 & 46.7511332021842 \tabularnewline
72 & 49.2947627942733 \tabularnewline
73 & 53.3274303249379 \tabularnewline
74 & 57.3164566420601 \tabularnewline
75 & 68.9222504554683 \tabularnewline
76 & 84.905491216104 \tabularnewline
77 & 112.476001114202 \tabularnewline
78 & 124.894875240283 \tabularnewline
79 & 143.902023138068 \tabularnewline
80 & 161.794252558235 \tabularnewline
81 & 175.511990556912 \tabularnewline
82 & 202.793574212824 \tabularnewline
83 & 361.942616892302 \tabularnewline
84 & 922.954746322548 \tabularnewline
\hline
\end{tabular}
%Source: https://freestatistics.org/blog/index.php?pk=24386&T=1

[TABLE]
[ROW][C]Summary of Dendrogram[/C][/ROW]
[ROW][C]Label[/C][C]Height[/C][/ROW]
[ROW][C]1[/C][C]3.74966665185053[/C][/ROW]
[ROW][C]2[/C][C]3.76031913539263[/C][/ROW]
[ROW][C]3[/C][C]4.59891291502677[/C][/ROW]
[ROW][C]4[/C][C]4.80208288141718[/C][/ROW]
[ROW][C]5[/C][C]5.1487862647424[/C][/ROW]
[ROW][C]6[/C][C]5.15945733580576[/C][/ROW]
[ROW][C]7[/C][C]5.3084837759948[/C][/ROW]
[ROW][C]8[/C][C]5.33385414123783[/C][/ROW]
[ROW][C]9[/C][C]5.67978872846517[/C][/ROW]
[ROW][C]10[/C][C]5.72632889513846[/C][/ROW]
[ROW][C]11[/C][C]5.76974869470067[/C][/ROW]
[ROW][C]12[/C][C]5.77321400954443[/C][/ROW]
[ROW][C]13[/C][C]6.04483250388297[/C][/ROW]
[ROW][C]14[/C][C]6.38827050147378[/C][/ROW]
[ROW][C]15[/C][C]6.65806144472115[/C][/ROW]
[ROW][C]16[/C][C]6.67083203206317[/C][/ROW]
[ROW][C]17[/C][C]7.32393336944023[/C][/ROW]
[ROW][C]18[/C][C]7.42765104188398[/C][/ROW]
[ROW][C]19[/C][C]8.01311425102625[/C][/ROW]
[ROW][C]20[/C][C]8.15720540381325[/C][/ROW]
[ROW][C]21[/C][C]8.20228987643107[/C][/ROW]
[ROW][C]22[/C][C]8.22834381117324[/C][/ROW]
[ROW][C]23[/C][C]8.26922003577121[/C][/ROW]
[ROW][C]24[/C][C]8.50058821494136[/C][/ROW]
[ROW][C]25[/C][C]8.71894489029493[/C][/ROW]
[ROW][C]26[/C][C]9.48602495241368[/C][/ROW]
[ROW][C]27[/C][C]9.50263121456367[/C][/ROW]
[ROW][C]28[/C][C]10.2029644138025[/C][/ROW]
[ROW][C]29[/C][C]10.9242212456256[/C][/ROW]
[ROW][C]30[/C][C]11.3399800956223[/C][/ROW]
[ROW][C]31[/C][C]11.3850779531806[/C][/ROW]
[ROW][C]32[/C][C]11.5323656253959[/C][/ROW]
[ROW][C]33[/C][C]11.7385307321470[/C][/ROW]
[ROW][C]34[/C][C]11.8915936694793[/C][/ROW]
[ROW][C]35[/C][C]12.2912119092932[/C][/ROW]
[ROW][C]36[/C][C]12.444955970077[/C][/ROW]
[ROW][C]37[/C][C]13.4866600757934[/C][/ROW]
[ROW][C]38[/C][C]13.8811042129643[/C][/ROW]
[ROW][C]39[/C][C]14.1088624630053[/C][/ROW]
[ROW][C]40[/C][C]14.4920667953194[/C][/ROW]
[ROW][C]41[/C][C]15.0410359466301[/C][/ROW]
[ROW][C]42[/C][C]15.6748205731358[/C][/ROW]
[ROW][C]43[/C][C]15.9204271299485[/C][/ROW]
[ROW][C]44[/C][C]16.3908218441782[/C][/ROW]
[ROW][C]45[/C][C]17.8266993247784[/C][/ROW]
[ROW][C]46[/C][C]18.5741683916382[/C][/ROW]
[ROW][C]47[/C][C]18.7680628117252[/C][/ROW]
[ROW][C]48[/C][C]18.9832594757116[/C][/ROW]
[ROW][C]49[/C][C]19.5452875756097[/C][/ROW]
[ROW][C]50[/C][C]20.2885410306815[/C][/ROW]
[ROW][C]51[/C][C]20.6052819647626[/C][/ROW]
[ROW][C]52[/C][C]20.8636046741688[/C][/ROW]
[ROW][C]53[/C][C]21.3449239510999[/C][/ROW]
[ROW][C]54[/C][C]23.6397113048711[/C][/ROW]
[ROW][C]55[/C][C]23.9900922615064[/C][/ROW]
[ROW][C]56[/C][C]25.6854044157377[/C][/ROW]
[ROW][C]57[/C][C]27.0159606945415[/C][/ROW]
[ROW][C]58[/C][C]31.0573737150870[/C][/ROW]
[ROW][C]59[/C][C]31.7750944194458[/C][/ROW]
[ROW][C]60[/C][C]31.8555300413931[/C][/ROW]
[ROW][C]61[/C][C]32.0179864797182[/C][/ROW]
[ROW][C]62[/C][C]33.1860959278244[/C][/ROW]
[ROW][C]63[/C][C]33.6504516095465[/C][/ROW]
[ROW][C]64[/C][C]33.946598447509[/C][/ROW]
[ROW][C]65[/C][C]36.3055062500737[/C][/ROW]
[ROW][C]66[/C][C]37.2580674919272[/C][/ROW]
[ROW][C]67[/C][C]41.9563652262156[/C][/ROW]
[ROW][C]68[/C][C]42.3787672712521[/C][/ROW]
[ROW][C]69[/C][C]43.4183873064041[/C][/ROW]
[ROW][C]70[/C][C]43.7968622407546[/C][/ROW]
[ROW][C]71[/C][C]46.7511332021842[/C][/ROW]
[ROW][C]72[/C][C]49.2947627942733[/C][/ROW]
[ROW][C]73[/C][C]53.3274303249379[/C][/ROW]
[ROW][C]74[/C][C]57.3164566420601[/C][/ROW]
[ROW][C]75[/C][C]68.9222504554683[/C][/ROW]
[ROW][C]76[/C][C]84.905491216104[/C][/ROW]
[ROW][C]77[/C][C]112.476001114202[/C][/ROW]
[ROW][C]78[/C][C]124.894875240283[/C][/ROW]
[ROW][C]79[/C][C]143.902023138068[/C][/ROW]
[ROW][C]80[/C][C]161.794252558235[/C][/ROW]
[ROW][C]81[/C][C]175.511990556912[/C][/ROW]
[ROW][C]82[/C][C]202.793574212824[/C][/ROW]
[ROW][C]83[/C][C]361.942616892302[/C][/ROW]
[ROW][C]84[/C][C]922.954746322548[/C][/ROW]
[/TABLE]
Source: https://freestatistics.org/blog/index.php?pk=24386&T=1

Globally Unique Identifier (entire table): ba.freestatistics.org/blog/index.php?pk=24386&T=1

As an alternative you can also use a QR Code:  

The GUIDs for individual cells are displayed in the table below:

Summary of Dendrogram
LabelHeight
13.74966665185053
23.76031913539263
34.59891291502677
44.80208288141718
55.1487862647424
65.15945733580576
75.3084837759948
85.33385414123783
95.67978872846517
105.72632889513846
115.76974869470067
125.77321400954443
136.04483250388297
146.38827050147378
156.65806144472115
166.67083203206317
177.32393336944023
187.42765104188398
198.01311425102625
208.15720540381325
218.20228987643107
228.22834381117324
238.26922003577121
248.50058821494136
258.71894489029493
269.48602495241368
279.50263121456367
2810.2029644138025
2910.9242212456256
3011.3399800956223
3111.3850779531806
3211.5323656253959
3311.7385307321470
3411.8915936694793
3512.2912119092932
3612.444955970077
3713.4866600757934
3813.8811042129643
3914.1088624630053
4014.4920667953194
4115.0410359466301
4215.6748205731358
4315.9204271299485
4416.3908218441782
4517.8266993247784
4618.5741683916382
4718.7680628117252
4818.9832594757116
4919.5452875756097
5020.2885410306815
5120.6052819647626
5220.8636046741688
5321.3449239510999
5423.6397113048711
5523.9900922615064
5625.6854044157377
5727.0159606945415
5831.0573737150870
5931.7750944194458
6031.8555300413931
6132.0179864797182
6233.1860959278244
6333.6504516095465
6433.946598447509
6536.3055062500737
6637.2580674919272
6741.9563652262156
6842.3787672712521
6943.4183873064041
7043.7968622407546
7146.7511332021842
7249.2947627942733
7353.3274303249379
7457.3164566420601
7568.9222504554683
7684.905491216104
77112.476001114202
78124.894875240283
79143.902023138068
80161.794252558235
81175.511990556912
82202.793574212824
83361.942616892302
84922.954746322548


Parameters (Session):
par1 = ward ; par2 = ALL ; par3 = FALSE ; par4 = FALSE ;
Parameters (R input):
par1 = ward ; par2 = ALL ; par3 = FALSE ; par4 = FALSE ;
R code (references can be found in the software module):
par3 <- as.logical(par3)
par4 <- as.logical(par4)
if (par3 == 'TRUE'){
dum = xlab
xlab = ylab
ylab = dum
}
x <- t(y)
hc <- hclust(dist(x),method=par1)
d <- as.dendrogram(hc)
str(d)
mysub <- paste('Method: ',par1)
bitmap(file='test1.png')
if (par4 == 'TRUE'){
plot(d,main=main,ylab=ylab,xlab=xlab,horiz=par3, nodePar=list(pch = c(1,NA), cex=0.8, lab.cex = 0.8),type='t',center=T, sub=mysub)
} else {
plot(d,main=main,ylab=ylab,xlab=xlab,horiz=par3, nodePar=list(pch = c(1,NA), cex=0.8, lab.cex = 0.8), sub=mysub)
}
dev.off()
if (par2 != 'ALL'){
if (par3 == 'TRUE'){
ylab = 'cluster'
} else {
xlab = 'cluster'
}
par2 <- as.numeric(par2)
memb <- cutree(hc, k = par2)
cent <- NULL
for(k in 1:par2){
cent <- rbind(cent, colMeans(x[memb == k, , drop = FALSE]))
}
hc1 <- hclust(dist(cent),method=par1, members = table(memb))
de <- as.dendrogram(hc1)
bitmap(file='test2.png')
if (par4 == 'TRUE'){
plot(de,main=main,ylab=ylab,xlab=xlab,horiz=par3, nodePar=list(pch = c(1,NA), cex=0.8, lab.cex = 0.8),type='t',center=T, sub=mysub)
} else {
plot(de,main=main,ylab=ylab,xlab=xlab,horiz=par3, nodePar=list(pch = c(1,NA), cex=0.8, lab.cex = 0.8), sub=mysub)
}
dev.off()
str(de)
}
load(file='createtable')
a<-table.start()
a<-table.row.start(a)
a<-table.element(a,'Summary of Dendrogram',2,TRUE)
a<-table.row.end(a)
a<-table.row.start(a)
a<-table.element(a,'Label',header=TRUE)
a<-table.element(a,'Height',header=TRUE)
a<-table.row.end(a)
num <- length(x[,1])-1
for (i in 1:num)
{
a<-table.row.start(a)
a<-table.element(a,hc$labels[i])
a<-table.element(a,hc$height[i])
a<-table.row.end(a)
}
a<-table.end(a)
table.save(a,file='mytable1.tab')
if (par2 != 'ALL'){
a<-table.start()
a<-table.row.start(a)
a<-table.element(a,'Summary of Cut Dendrogram',2,TRUE)
a<-table.row.end(a)
a<-table.row.start(a)
a<-table.element(a,'Label',header=TRUE)
a<-table.element(a,'Height',header=TRUE)
a<-table.row.end(a)
num <- par2-1
for (i in 1:num)
{
a<-table.row.start(a)
a<-table.element(a,i)
a<-table.element(a,hc1$height[i])
a<-table.row.end(a)
}
a<-table.end(a)
table.save(a,file='mytable2.tab')
}