Free Statistics

of Irreproducible Research!

Author's title

Author*The author of this computation has been verified*
R Software Modulerwasp_multipleregression.wasp
Title produced by softwareMultiple Regression
Date of computationWed, 20 Nov 2013 12:05:14 -0500
Cite this page as followsStatistical Computations at FreeStatistics.org, Office for Research Development and Education, URL https://freestatistics.org/blog/index.php?v=date/2013/Nov/20/t1384967229f6qemn7nmvmu3tm.htm/, Retrieved Wed, 01 May 2024 23:11:57 +0000
Statistical Computations at FreeStatistics.org, Office for Research Development and Education, URL https://freestatistics.org/blog/index.php?pk=226672, Retrieved Wed, 01 May 2024 23:11:57 +0000
QR Codes:

Original text written by user:
IsPrivate?No (this computation is public)
User-defined keywords
Estimated Impact85
Family? (F = Feedback message, R = changed R code, M = changed R Module, P = changed Parameters, D = changed Data)
-       [Multiple Regression] [W7_opgave1] [2013-11-20 17:05:14] [6ca235be63c25d1ede0161784935ca53] [Current]
Feedback Forum

Post a new message
Dataseries X:
9,2	2,07	102,06	0,44	0,67
11,7	1,92	81,65	0,44	0,80
15,8	1,95	86,18	0,46	0,76
8,6	1,89	81,65	0,42	0,65
23,2	2,10	92,99	0,45	0,90
27,4	1,95	102,06	0,43	0,78
9,3	1,92	83,91	0,49	0,77
16	2,07	106,59	0,47	0,75
4,7	2,10	106,59	0,44	0,82
12,5	2,04	95,25	0,48	0,83
20,1	2,10	111,13	0,52	0,63
9,1	2,10	111,13	0,49	0,76
8,1	1,92	83,91	0,37	0,71
8,6	1,86	83,91	0,42	0,78
20,3	1,89	81,65	0,44	0,78
25	2,07	99,79	0,50	0,88
19,2	1,98	88,00	0,50	0,83
3,3	2,32	102,06	0,43	0,57
11,2	1,92	95,25	0,37	0,82
10,5	2,16	108,86	0,50	0,71
10,1	2,07	102,06	0,40	0,77
7,2	2,23	119,29	0,48	0,66
13,6	1,95	95,25	0,48	0,24
9	2,07	106,59	0,43	0,73
24,6	2,19	104,33	0,56	0,72
12,6	1,95	86,18	0,44	0,76
5,6	2,01	99,79	0,49	0,75
8,7	2,07	95,25	0,40	0,74
7,7	1,86	81,65	0,42	0,71
24,1	1,98	106,59	0,49	0,74
11,7	1,95	83,91	0,48	0,86
7,7	1,83	79,38	0,39	0,72
9,6	1,83	87,09	0,44	0,79
7,2	2,23	119,29	0,48	0,66
12,3	1,86	81,65	0,34	0,82
8,9	2,04	108,86	0,52	0,73
13,6	1,95	95,25	0,48	0,85
11,2	1,77	72,57	0,41	0,81
2,8	2,10	104,33	0,41	0,60
3,2	2,13	111,13	0,41	0,57
9,4	2,23	103,42	0,45	0,73
11,9	1,80	70,31	0,29	0,71
15,4	1,89	90,72	0,45	0,80
7,4	2,07	106,59	0,55	0,78
18,9	2,13	106,59	0,48	0,74
7,9	1,80	47,63	0,36	0,84
12,2	1,86	81,65	0,53	0,79
11	1,74	83,91	0,35	0,70
2,8	2,16	111,13	0,41	0,78
11,8	1,77	81,65	0,43	0,87
17,1	2,26	108,86	0,60	0,71
11,6	2,07	102,06	0,48	0,70
5,8	2,07	97,52	0,46	0,73
8,3	2,13	104,33	0,44	0,76


Summary of computational transaction
Raw Inputview raw input (R code)
Raw Outputview raw output of R engine
Computing time10 seconds
R Server'Gertrude Mary Cox' @ cox.wessa.net

\begin{tabular}{lllllllll}
\hline
Summary of computational transaction \tabularnewline
Raw Input & view raw input (R code)  \tabularnewline
Raw Output & view raw output of R engine  \tabularnewline
Computing time & 10 seconds \tabularnewline
R Server & 'Gertrude Mary Cox' @ cox.wessa.net \tabularnewline
\hline
\end{tabular}
%Source: https://freestatistics.org/blog/index.php?pk=226672&T=0

[TABLE]
[ROW][C]Summary of computational transaction[/C][/ROW]
[ROW][C]Raw Input[/C][C]view raw input (R code) [/C][/ROW]
[ROW][C]Raw Output[/C][C]view raw output of R engine [/C][/ROW]
[ROW][C]Computing time[/C][C]10 seconds[/C][/ROW]
[ROW][C]R Server[/C][C]'Gertrude Mary Cox' @ cox.wessa.net[/C][/ROW]
[/TABLE]
Source: https://freestatistics.org/blog/index.php?pk=226672&T=0

Globally Unique Identifier (entire table): ba.freestatistics.org/blog/index.php?pk=226672&T=0

As an alternative you can also use a QR Code:  

The GUIDs for individual cells are displayed in the table below:

Summary of computational transaction
Raw Inputview raw input (R code)
Raw Outputview raw output of R engine
Computing time10 seconds
R Server'Gertrude Mary Cox' @ cox.wessa.net


Multiple Linear Regression - Estimated Regression Equation
V1[t] = + 4.56113 -12.2915V2[t] + 0.0249683V3[t] + 46.7043V4[t] + 11.4732V5[t] + e[t]

\begin{tabular}{lllllllll}
\hline
Multiple Linear Regression - Estimated Regression Equation \tabularnewline
V1[t] =  +  4.56113 -12.2915V2[t] +  0.0249683V3[t] +  46.7043V4[t] +  11.4732V5[t]  + e[t] \tabularnewline
\hline
\end{tabular}
%Source: https://freestatistics.org/blog/index.php?pk=226672&T=1

[TABLE]
[ROW][C]Multiple Linear Regression - Estimated Regression Equation[/C][/ROW]
[ROW][C]V1[t] =  +  4.56113 -12.2915V2[t] +  0.0249683V3[t] +  46.7043V4[t] +  11.4732V5[t]  + e[t][/C][/ROW]
[/TABLE]
Source: https://freestatistics.org/blog/index.php?pk=226672&T=1

Globally Unique Identifier (entire table): ba.freestatistics.org/blog/index.php?pk=226672&T=1

As an alternative you can also use a QR Code:  

The GUIDs for individual cells are displayed in the table below:

Multiple Linear Regression - Estimated Regression Equation
V1[t] = + 4.56113 -12.2915V2[t] + 0.0249683V3[t] + 46.7043V4[t] + 11.4732V5[t] + e[t]


Multiple Linear Regression - Ordinary Least Squares
VariableParameterS.D.T-STATH0: parameter = 02-tail p-value1-tail p-value
(Intercept)4.5611314.94770.30510.7615530.380776
V2-12.29159.77056-1.2580.214350.107175
V30.02496830.1016440.24560.8069840.403492
V446.704315.59342.9950.004293410.00214671
V511.47327.830091.4650.1492360.074618

\begin{tabular}{lllllllll}
\hline
Multiple Linear Regression - Ordinary Least Squares \tabularnewline
Variable & Parameter & S.D. & T-STATH0: parameter = 0 & 2-tail p-value & 1-tail p-value \tabularnewline
(Intercept) & 4.56113 & 14.9477 & 0.3051 & 0.761553 & 0.380776 \tabularnewline
V2 & -12.2915 & 9.77056 & -1.258 & 0.21435 & 0.107175 \tabularnewline
V3 & 0.0249683 & 0.101644 & 0.2456 & 0.806984 & 0.403492 \tabularnewline
V4 & 46.7043 & 15.5934 & 2.995 & 0.00429341 & 0.00214671 \tabularnewline
V5 & 11.4732 & 7.83009 & 1.465 & 0.149236 & 0.074618 \tabularnewline
\hline
\end{tabular}
%Source: https://freestatistics.org/blog/index.php?pk=226672&T=2

[TABLE]
[ROW][C]Multiple Linear Regression - Ordinary Least Squares[/C][/ROW]
[ROW][C]Variable[/C][C]Parameter[/C][C]S.D.[/C][C]T-STATH0: parameter = 0[/C][C]2-tail p-value[/C][C]1-tail p-value[/C][/ROW]
[ROW][C](Intercept)[/C][C]4.56113[/C][C]14.9477[/C][C]0.3051[/C][C]0.761553[/C][C]0.380776[/C][/ROW]
[ROW][C]V2[/C][C]-12.2915[/C][C]9.77056[/C][C]-1.258[/C][C]0.21435[/C][C]0.107175[/C][/ROW]
[ROW][C]V3[/C][C]0.0249683[/C][C]0.101644[/C][C]0.2456[/C][C]0.806984[/C][C]0.403492[/C][/ROW]
[ROW][C]V4[/C][C]46.7043[/C][C]15.5934[/C][C]2.995[/C][C]0.00429341[/C][C]0.00214671[/C][/ROW]
[ROW][C]V5[/C][C]11.4732[/C][C]7.83009[/C][C]1.465[/C][C]0.149236[/C][C]0.074618[/C][/ROW]
[/TABLE]
Source: https://freestatistics.org/blog/index.php?pk=226672&T=2

Globally Unique Identifier (entire table): ba.freestatistics.org/blog/index.php?pk=226672&T=2

As an alternative you can also use a QR Code:  

The GUIDs for individual cells are displayed in the table below:

Multiple Linear Regression - Ordinary Least Squares
VariableParameterS.D.T-STATH0: parameter = 02-tail p-value1-tail p-value
(Intercept)4.5611314.94770.30510.7615530.380776
V2-12.29159.77056-1.2580.214350.107175
V30.02496830.1016440.24560.8069840.403492
V446.704315.59342.9950.004293410.00214671
V511.47327.830091.4650.1492360.074618


Multiple Linear Regression - Regression Statistics
Multiple R0.464044
R-squared0.215337
Adjusted R-squared0.151283
F-TEST (value)3.3618
F-TEST (DF numerator)4
F-TEST (DF denominator)49
p-value0.0164969
Multiple Linear Regression - Residual Statistics
Residual Standard Deviation5.43474
Sum Squared Residuals1447.28

\begin{tabular}{lllllllll}
\hline
Multiple Linear Regression - Regression Statistics \tabularnewline
Multiple R & 0.464044 \tabularnewline
R-squared & 0.215337 \tabularnewline
Adjusted R-squared & 0.151283 \tabularnewline
F-TEST (value) & 3.3618 \tabularnewline
F-TEST (DF numerator) & 4 \tabularnewline
F-TEST (DF denominator) & 49 \tabularnewline
p-value & 0.0164969 \tabularnewline
Multiple Linear Regression - Residual Statistics \tabularnewline
Residual Standard Deviation & 5.43474 \tabularnewline
Sum Squared Residuals & 1447.28 \tabularnewline
\hline
\end{tabular}
%Source: https://freestatistics.org/blog/index.php?pk=226672&T=3

[TABLE]
[ROW][C]Multiple Linear Regression - Regression Statistics[/C][/ROW]
[ROW][C]Multiple R[/C][C]0.464044[/C][/ROW]
[ROW][C]R-squared[/C][C]0.215337[/C][/ROW]
[ROW][C]Adjusted R-squared[/C][C]0.151283[/C][/ROW]
[ROW][C]F-TEST (value)[/C][C]3.3618[/C][/ROW]
[ROW][C]F-TEST (DF numerator)[/C][C]4[/C][/ROW]
[ROW][C]F-TEST (DF denominator)[/C][C]49[/C][/ROW]
[ROW][C]p-value[/C][C]0.0164969[/C][/ROW]
[ROW][C]Multiple Linear Regression - Residual Statistics[/C][/ROW]
[ROW][C]Residual Standard Deviation[/C][C]5.43474[/C][/ROW]
[ROW][C]Sum Squared Residuals[/C][C]1447.28[/C][/ROW]
[/TABLE]
Source: https://freestatistics.org/blog/index.php?pk=226672&T=3

Globally Unique Identifier (entire table): ba.freestatistics.org/blog/index.php?pk=226672&T=3

As an alternative you can also use a QR Code:  

The GUIDs for individual cells are displayed in the table below:

Multiple Linear Regression - Regression Statistics
Multiple R0.464044
R-squared0.215337
Adjusted R-squared0.151283
F-TEST (value)3.3618
F-TEST (DF numerator)4
F-TEST (DF denominator)49
p-value0.0164969
Multiple Linear Regression - Residual Statistics
Residual Standard Deviation5.43474
Sum Squared Residuals1447.28


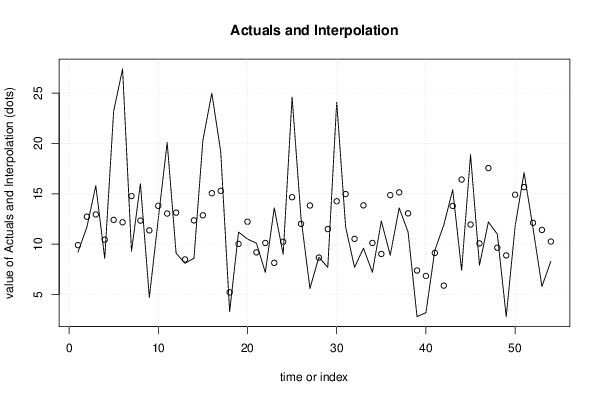
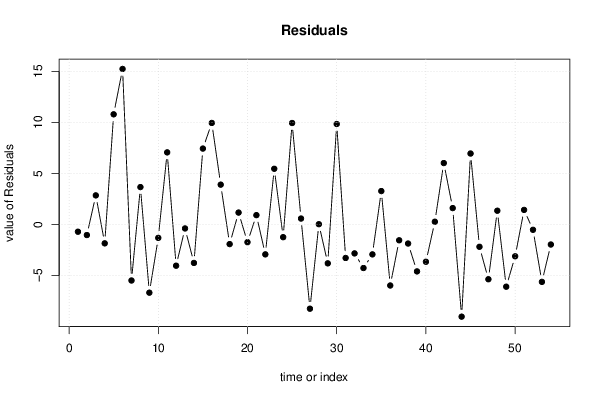
Multiple Linear Regression - Actuals, Interpolation, and Residuals
Time or IndexActualsInterpolationForecastResidualsPrediction Error
19.29.90294-0.702938
211.712.7286-1.02857
315.812.94812.85191
48.610.4423-1.84225
523.212.413610.7864
627.412.172915.2271
79.314.776-5.47602
81612.3353.66497
94.711.3683-6.66827
1012.513.8055-1.30553
1120.113.03817.06193
129.113.1285-4.02846
138.18.48311-0.38311
148.612.3589-3.75894
1520.312.86787.43215
162515.05799.94212
1719.215.29613.90392
183.35.21571-1.91571
1911.210.02831.1717
2010.512.2277-1.72767
2110.19.182080.917919
227.210.1199-2.91995
2313.68.142595.45741
24910.2374-1.23739
2524.614.66289.93719
2612.612.0140.585997
275.613.8368-8.23682
288.78.667850.0321478
297.711.4994-3.79939
3024.114.26069.83939
3111.714.9728-3.27281
327.710.5251-2.82505
339.613.8559-4.2559
347.210.1199-2.91995
3512.39.025093.27491
368.914.8662-5.9662
3713.615.1412-1.54122
3811.213.0592-1.85918
392.87.38662-4.58662
403.26.84347-3.64347
419.49.125690.27431
4211.95.882176.01783
4315.413.79081.60918
447.416.4156-9.01556
4518.911.94986.95015
467.910.0767-2.1767
4712.217.5547-5.35471
48119.646761.35324
492.88.88409-6.08409
5011.814.9084-3.10837
5117.115.6691.43104
5211.612.1153-0.515304
535.811.4121-5.61206
548.310.2547-1.95471

\begin{tabular}{lllllllll}
\hline
Multiple Linear Regression - Actuals, Interpolation, and Residuals \tabularnewline
Time or Index & Actuals & InterpolationForecast & ResidualsPrediction Error \tabularnewline
1 & 9.2 & 9.90294 & -0.702938 \tabularnewline
2 & 11.7 & 12.7286 & -1.02857 \tabularnewline
3 & 15.8 & 12.9481 & 2.85191 \tabularnewline
4 & 8.6 & 10.4423 & -1.84225 \tabularnewline
5 & 23.2 & 12.4136 & 10.7864 \tabularnewline
6 & 27.4 & 12.1729 & 15.2271 \tabularnewline
7 & 9.3 & 14.776 & -5.47602 \tabularnewline
8 & 16 & 12.335 & 3.66497 \tabularnewline
9 & 4.7 & 11.3683 & -6.66827 \tabularnewline
10 & 12.5 & 13.8055 & -1.30553 \tabularnewline
11 & 20.1 & 13.0381 & 7.06193 \tabularnewline
12 & 9.1 & 13.1285 & -4.02846 \tabularnewline
13 & 8.1 & 8.48311 & -0.38311 \tabularnewline
14 & 8.6 & 12.3589 & -3.75894 \tabularnewline
15 & 20.3 & 12.8678 & 7.43215 \tabularnewline
16 & 25 & 15.0579 & 9.94212 \tabularnewline
17 & 19.2 & 15.2961 & 3.90392 \tabularnewline
18 & 3.3 & 5.21571 & -1.91571 \tabularnewline
19 & 11.2 & 10.0283 & 1.1717 \tabularnewline
20 & 10.5 & 12.2277 & -1.72767 \tabularnewline
21 & 10.1 & 9.18208 & 0.917919 \tabularnewline
22 & 7.2 & 10.1199 & -2.91995 \tabularnewline
23 & 13.6 & 8.14259 & 5.45741 \tabularnewline
24 & 9 & 10.2374 & -1.23739 \tabularnewline
25 & 24.6 & 14.6628 & 9.93719 \tabularnewline
26 & 12.6 & 12.014 & 0.585997 \tabularnewline
27 & 5.6 & 13.8368 & -8.23682 \tabularnewline
28 & 8.7 & 8.66785 & 0.0321478 \tabularnewline
29 & 7.7 & 11.4994 & -3.79939 \tabularnewline
30 & 24.1 & 14.2606 & 9.83939 \tabularnewline
31 & 11.7 & 14.9728 & -3.27281 \tabularnewline
32 & 7.7 & 10.5251 & -2.82505 \tabularnewline
33 & 9.6 & 13.8559 & -4.2559 \tabularnewline
34 & 7.2 & 10.1199 & -2.91995 \tabularnewline
35 & 12.3 & 9.02509 & 3.27491 \tabularnewline
36 & 8.9 & 14.8662 & -5.9662 \tabularnewline
37 & 13.6 & 15.1412 & -1.54122 \tabularnewline
38 & 11.2 & 13.0592 & -1.85918 \tabularnewline
39 & 2.8 & 7.38662 & -4.58662 \tabularnewline
40 & 3.2 & 6.84347 & -3.64347 \tabularnewline
41 & 9.4 & 9.12569 & 0.27431 \tabularnewline
42 & 11.9 & 5.88217 & 6.01783 \tabularnewline
43 & 15.4 & 13.7908 & 1.60918 \tabularnewline
44 & 7.4 & 16.4156 & -9.01556 \tabularnewline
45 & 18.9 & 11.9498 & 6.95015 \tabularnewline
46 & 7.9 & 10.0767 & -2.1767 \tabularnewline
47 & 12.2 & 17.5547 & -5.35471 \tabularnewline
48 & 11 & 9.64676 & 1.35324 \tabularnewline
49 & 2.8 & 8.88409 & -6.08409 \tabularnewline
50 & 11.8 & 14.9084 & -3.10837 \tabularnewline
51 & 17.1 & 15.669 & 1.43104 \tabularnewline
52 & 11.6 & 12.1153 & -0.515304 \tabularnewline
53 & 5.8 & 11.4121 & -5.61206 \tabularnewline
54 & 8.3 & 10.2547 & -1.95471 \tabularnewline
\hline
\end{tabular}
%Source: https://freestatistics.org/blog/index.php?pk=226672&T=4

[TABLE]
[ROW][C]Multiple Linear Regression - Actuals, Interpolation, and Residuals[/C][/ROW]
[ROW][C]Time or Index[/C][C]Actuals[/C][C]InterpolationForecast[/C][C]ResidualsPrediction Error[/C][/ROW]
[ROW][C]1[/C][C]9.2[/C][C]9.90294[/C][C]-0.702938[/C][/ROW]
[ROW][C]2[/C][C]11.7[/C][C]12.7286[/C][C]-1.02857[/C][/ROW]
[ROW][C]3[/C][C]15.8[/C][C]12.9481[/C][C]2.85191[/C][/ROW]
[ROW][C]4[/C][C]8.6[/C][C]10.4423[/C][C]-1.84225[/C][/ROW]
[ROW][C]5[/C][C]23.2[/C][C]12.4136[/C][C]10.7864[/C][/ROW]
[ROW][C]6[/C][C]27.4[/C][C]12.1729[/C][C]15.2271[/C][/ROW]
[ROW][C]7[/C][C]9.3[/C][C]14.776[/C][C]-5.47602[/C][/ROW]
[ROW][C]8[/C][C]16[/C][C]12.335[/C][C]3.66497[/C][/ROW]
[ROW][C]9[/C][C]4.7[/C][C]11.3683[/C][C]-6.66827[/C][/ROW]
[ROW][C]10[/C][C]12.5[/C][C]13.8055[/C][C]-1.30553[/C][/ROW]
[ROW][C]11[/C][C]20.1[/C][C]13.0381[/C][C]7.06193[/C][/ROW]
[ROW][C]12[/C][C]9.1[/C][C]13.1285[/C][C]-4.02846[/C][/ROW]
[ROW][C]13[/C][C]8.1[/C][C]8.48311[/C][C]-0.38311[/C][/ROW]
[ROW][C]14[/C][C]8.6[/C][C]12.3589[/C][C]-3.75894[/C][/ROW]
[ROW][C]15[/C][C]20.3[/C][C]12.8678[/C][C]7.43215[/C][/ROW]
[ROW][C]16[/C][C]25[/C][C]15.0579[/C][C]9.94212[/C][/ROW]
[ROW][C]17[/C][C]19.2[/C][C]15.2961[/C][C]3.90392[/C][/ROW]
[ROW][C]18[/C][C]3.3[/C][C]5.21571[/C][C]-1.91571[/C][/ROW]
[ROW][C]19[/C][C]11.2[/C][C]10.0283[/C][C]1.1717[/C][/ROW]
[ROW][C]20[/C][C]10.5[/C][C]12.2277[/C][C]-1.72767[/C][/ROW]
[ROW][C]21[/C][C]10.1[/C][C]9.18208[/C][C]0.917919[/C][/ROW]
[ROW][C]22[/C][C]7.2[/C][C]10.1199[/C][C]-2.91995[/C][/ROW]
[ROW][C]23[/C][C]13.6[/C][C]8.14259[/C][C]5.45741[/C][/ROW]
[ROW][C]24[/C][C]9[/C][C]10.2374[/C][C]-1.23739[/C][/ROW]
[ROW][C]25[/C][C]24.6[/C][C]14.6628[/C][C]9.93719[/C][/ROW]
[ROW][C]26[/C][C]12.6[/C][C]12.014[/C][C]0.585997[/C][/ROW]
[ROW][C]27[/C][C]5.6[/C][C]13.8368[/C][C]-8.23682[/C][/ROW]
[ROW][C]28[/C][C]8.7[/C][C]8.66785[/C][C]0.0321478[/C][/ROW]
[ROW][C]29[/C][C]7.7[/C][C]11.4994[/C][C]-3.79939[/C][/ROW]
[ROW][C]30[/C][C]24.1[/C][C]14.2606[/C][C]9.83939[/C][/ROW]
[ROW][C]31[/C][C]11.7[/C][C]14.9728[/C][C]-3.27281[/C][/ROW]
[ROW][C]32[/C][C]7.7[/C][C]10.5251[/C][C]-2.82505[/C][/ROW]
[ROW][C]33[/C][C]9.6[/C][C]13.8559[/C][C]-4.2559[/C][/ROW]
[ROW][C]34[/C][C]7.2[/C][C]10.1199[/C][C]-2.91995[/C][/ROW]
[ROW][C]35[/C][C]12.3[/C][C]9.02509[/C][C]3.27491[/C][/ROW]
[ROW][C]36[/C][C]8.9[/C][C]14.8662[/C][C]-5.9662[/C][/ROW]
[ROW][C]37[/C][C]13.6[/C][C]15.1412[/C][C]-1.54122[/C][/ROW]
[ROW][C]38[/C][C]11.2[/C][C]13.0592[/C][C]-1.85918[/C][/ROW]
[ROW][C]39[/C][C]2.8[/C][C]7.38662[/C][C]-4.58662[/C][/ROW]
[ROW][C]40[/C][C]3.2[/C][C]6.84347[/C][C]-3.64347[/C][/ROW]
[ROW][C]41[/C][C]9.4[/C][C]9.12569[/C][C]0.27431[/C][/ROW]
[ROW][C]42[/C][C]11.9[/C][C]5.88217[/C][C]6.01783[/C][/ROW]
[ROW][C]43[/C][C]15.4[/C][C]13.7908[/C][C]1.60918[/C][/ROW]
[ROW][C]44[/C][C]7.4[/C][C]16.4156[/C][C]-9.01556[/C][/ROW]
[ROW][C]45[/C][C]18.9[/C][C]11.9498[/C][C]6.95015[/C][/ROW]
[ROW][C]46[/C][C]7.9[/C][C]10.0767[/C][C]-2.1767[/C][/ROW]
[ROW][C]47[/C][C]12.2[/C][C]17.5547[/C][C]-5.35471[/C][/ROW]
[ROW][C]48[/C][C]11[/C][C]9.64676[/C][C]1.35324[/C][/ROW]
[ROW][C]49[/C][C]2.8[/C][C]8.88409[/C][C]-6.08409[/C][/ROW]
[ROW][C]50[/C][C]11.8[/C][C]14.9084[/C][C]-3.10837[/C][/ROW]
[ROW][C]51[/C][C]17.1[/C][C]15.669[/C][C]1.43104[/C][/ROW]
[ROW][C]52[/C][C]11.6[/C][C]12.1153[/C][C]-0.515304[/C][/ROW]
[ROW][C]53[/C][C]5.8[/C][C]11.4121[/C][C]-5.61206[/C][/ROW]
[ROW][C]54[/C][C]8.3[/C][C]10.2547[/C][C]-1.95471[/C][/ROW]
[/TABLE]
Source: https://freestatistics.org/blog/index.php?pk=226672&T=4

Globally Unique Identifier (entire table): ba.freestatistics.org/blog/index.php?pk=226672&T=4

As an alternative you can also use a QR Code:  

The GUIDs for individual cells are displayed in the table below:

Multiple Linear Regression - Actuals, Interpolation, and Residuals
Time or IndexActualsInterpolationForecastResidualsPrediction Error
19.29.90294-0.702938
211.712.7286-1.02857
315.812.94812.85191
48.610.4423-1.84225
523.212.413610.7864
627.412.172915.2271
79.314.776-5.47602
81612.3353.66497
94.711.3683-6.66827
1012.513.8055-1.30553
1120.113.03817.06193
129.113.1285-4.02846
138.18.48311-0.38311
148.612.3589-3.75894
1520.312.86787.43215
162515.05799.94212
1719.215.29613.90392
183.35.21571-1.91571
1911.210.02831.1717
2010.512.2277-1.72767
2110.19.182080.917919
227.210.1199-2.91995
2313.68.142595.45741
24910.2374-1.23739
2524.614.66289.93719
2612.612.0140.585997
275.613.8368-8.23682
288.78.667850.0321478
297.711.4994-3.79939
3024.114.26069.83939
3111.714.9728-3.27281
327.710.5251-2.82505
339.613.8559-4.2559
347.210.1199-2.91995
3512.39.025093.27491
368.914.8662-5.9662
3713.615.1412-1.54122
3811.213.0592-1.85918
392.87.38662-4.58662
403.26.84347-3.64347
419.49.125690.27431
4211.95.882176.01783
4315.413.79081.60918
447.416.4156-9.01556
4518.911.94986.95015
467.910.0767-2.1767
4712.217.5547-5.35471
48119.646761.35324
492.88.88409-6.08409
5011.814.9084-3.10837
5117.115.6691.43104
5211.612.1153-0.515304
535.811.4121-5.61206
548.310.2547-1.95471


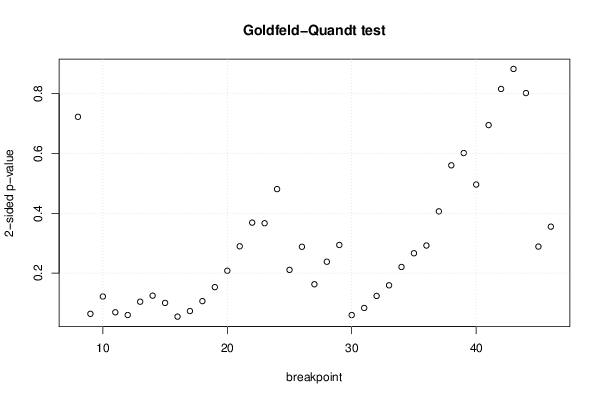
Goldfeld-Quandt test for Heteroskedasticity
p-valuesAlternative Hypothesis
breakpoint indexgreater2-sidedless
80.3613030.7226070.638697
90.9682220.0635570.0317785
100.9392440.1215110.0607555
110.9656520.06869540.0343477
120.9702220.05955570.0297778
130.9479830.1040350.0520174
140.9378270.1243450.0621725
150.949970.100060.0500298
160.9729540.05409140.0270457
170.9635540.0728910.0364455
180.9469940.1060120.0530059
190.9236060.1527880.0763941
200.8961940.2076120.103806
210.8552380.2895230.144762
220.8156550.368690.184345
230.8166710.3666580.183329
240.7595790.4808430.240421
250.8947420.2105170.105258
260.8560740.2878510.143926
270.9187710.1624580.081229
280.8811060.2377870.118894
290.8530920.2938150.146908
300.9703060.05938740.0296937
310.9584540.08309280.0415464
320.9382640.1234720.0617358
330.9205080.1589850.0794924
340.8898440.2203120.110156
350.866880.2662410.13312
360.8539790.2920420.146021
370.7968370.4063260.203163
380.7198220.5603570.280178
390.6992580.6014850.300742
400.7519880.4960250.248012
410.6525430.6949150.347457
420.5920740.8158510.407926
430.5586180.8827650.441382
440.5989310.8021370.401069
450.8557580.2884830.144242
460.8224540.3550930.177546

\begin{tabular}{lllllllll}
\hline
Goldfeld-Quandt test for Heteroskedasticity \tabularnewline
p-values & Alternative Hypothesis \tabularnewline
breakpoint index & greater & 2-sided & less \tabularnewline
8 & 0.361303 & 0.722607 & 0.638697 \tabularnewline
9 & 0.968222 & 0.063557 & 0.0317785 \tabularnewline
10 & 0.939244 & 0.121511 & 0.0607555 \tabularnewline
11 & 0.965652 & 0.0686954 & 0.0343477 \tabularnewline
12 & 0.970222 & 0.0595557 & 0.0297778 \tabularnewline
13 & 0.947983 & 0.104035 & 0.0520174 \tabularnewline
14 & 0.937827 & 0.124345 & 0.0621725 \tabularnewline
15 & 0.94997 & 0.10006 & 0.0500298 \tabularnewline
16 & 0.972954 & 0.0540914 & 0.0270457 \tabularnewline
17 & 0.963554 & 0.072891 & 0.0364455 \tabularnewline
18 & 0.946994 & 0.106012 & 0.0530059 \tabularnewline
19 & 0.923606 & 0.152788 & 0.0763941 \tabularnewline
20 & 0.896194 & 0.207612 & 0.103806 \tabularnewline
21 & 0.855238 & 0.289523 & 0.144762 \tabularnewline
22 & 0.815655 & 0.36869 & 0.184345 \tabularnewline
23 & 0.816671 & 0.366658 & 0.183329 \tabularnewline
24 & 0.759579 & 0.480843 & 0.240421 \tabularnewline
25 & 0.894742 & 0.210517 & 0.105258 \tabularnewline
26 & 0.856074 & 0.287851 & 0.143926 \tabularnewline
27 & 0.918771 & 0.162458 & 0.081229 \tabularnewline
28 & 0.881106 & 0.237787 & 0.118894 \tabularnewline
29 & 0.853092 & 0.293815 & 0.146908 \tabularnewline
30 & 0.970306 & 0.0593874 & 0.0296937 \tabularnewline
31 & 0.958454 & 0.0830928 & 0.0415464 \tabularnewline
32 & 0.938264 & 0.123472 & 0.0617358 \tabularnewline
33 & 0.920508 & 0.158985 & 0.0794924 \tabularnewline
34 & 0.889844 & 0.220312 & 0.110156 \tabularnewline
35 & 0.86688 & 0.266241 & 0.13312 \tabularnewline
36 & 0.853979 & 0.292042 & 0.146021 \tabularnewline
37 & 0.796837 & 0.406326 & 0.203163 \tabularnewline
38 & 0.719822 & 0.560357 & 0.280178 \tabularnewline
39 & 0.699258 & 0.601485 & 0.300742 \tabularnewline
40 & 0.751988 & 0.496025 & 0.248012 \tabularnewline
41 & 0.652543 & 0.694915 & 0.347457 \tabularnewline
42 & 0.592074 & 0.815851 & 0.407926 \tabularnewline
43 & 0.558618 & 0.882765 & 0.441382 \tabularnewline
44 & 0.598931 & 0.802137 & 0.401069 \tabularnewline
45 & 0.855758 & 0.288483 & 0.144242 \tabularnewline
46 & 0.822454 & 0.355093 & 0.177546 \tabularnewline
\hline
\end{tabular}
%Source: https://freestatistics.org/blog/index.php?pk=226672&T=5

[TABLE]
[ROW][C]Goldfeld-Quandt test for Heteroskedasticity[/C][/ROW]
[ROW][C]p-values[/C][C]Alternative Hypothesis[/C][/ROW]
[ROW][C]breakpoint index[/C][C]greater[/C][C]2-sided[/C][C]less[/C][/ROW]
[ROW][C]8[/C][C]0.361303[/C][C]0.722607[/C][C]0.638697[/C][/ROW]
[ROW][C]9[/C][C]0.968222[/C][C]0.063557[/C][C]0.0317785[/C][/ROW]
[ROW][C]10[/C][C]0.939244[/C][C]0.121511[/C][C]0.0607555[/C][/ROW]
[ROW][C]11[/C][C]0.965652[/C][C]0.0686954[/C][C]0.0343477[/C][/ROW]
[ROW][C]12[/C][C]0.970222[/C][C]0.0595557[/C][C]0.0297778[/C][/ROW]
[ROW][C]13[/C][C]0.947983[/C][C]0.104035[/C][C]0.0520174[/C][/ROW]
[ROW][C]14[/C][C]0.937827[/C][C]0.124345[/C][C]0.0621725[/C][/ROW]
[ROW][C]15[/C][C]0.94997[/C][C]0.10006[/C][C]0.0500298[/C][/ROW]
[ROW][C]16[/C][C]0.972954[/C][C]0.0540914[/C][C]0.0270457[/C][/ROW]
[ROW][C]17[/C][C]0.963554[/C][C]0.072891[/C][C]0.0364455[/C][/ROW]
[ROW][C]18[/C][C]0.946994[/C][C]0.106012[/C][C]0.0530059[/C][/ROW]
[ROW][C]19[/C][C]0.923606[/C][C]0.152788[/C][C]0.0763941[/C][/ROW]
[ROW][C]20[/C][C]0.896194[/C][C]0.207612[/C][C]0.103806[/C][/ROW]
[ROW][C]21[/C][C]0.855238[/C][C]0.289523[/C][C]0.144762[/C][/ROW]
[ROW][C]22[/C][C]0.815655[/C][C]0.36869[/C][C]0.184345[/C][/ROW]
[ROW][C]23[/C][C]0.816671[/C][C]0.366658[/C][C]0.183329[/C][/ROW]
[ROW][C]24[/C][C]0.759579[/C][C]0.480843[/C][C]0.240421[/C][/ROW]
[ROW][C]25[/C][C]0.894742[/C][C]0.210517[/C][C]0.105258[/C][/ROW]
[ROW][C]26[/C][C]0.856074[/C][C]0.287851[/C][C]0.143926[/C][/ROW]
[ROW][C]27[/C][C]0.918771[/C][C]0.162458[/C][C]0.081229[/C][/ROW]
[ROW][C]28[/C][C]0.881106[/C][C]0.237787[/C][C]0.118894[/C][/ROW]
[ROW][C]29[/C][C]0.853092[/C][C]0.293815[/C][C]0.146908[/C][/ROW]
[ROW][C]30[/C][C]0.970306[/C][C]0.0593874[/C][C]0.0296937[/C][/ROW]
[ROW][C]31[/C][C]0.958454[/C][C]0.0830928[/C][C]0.0415464[/C][/ROW]
[ROW][C]32[/C][C]0.938264[/C][C]0.123472[/C][C]0.0617358[/C][/ROW]
[ROW][C]33[/C][C]0.920508[/C][C]0.158985[/C][C]0.0794924[/C][/ROW]
[ROW][C]34[/C][C]0.889844[/C][C]0.220312[/C][C]0.110156[/C][/ROW]
[ROW][C]35[/C][C]0.86688[/C][C]0.266241[/C][C]0.13312[/C][/ROW]
[ROW][C]36[/C][C]0.853979[/C][C]0.292042[/C][C]0.146021[/C][/ROW]
[ROW][C]37[/C][C]0.796837[/C][C]0.406326[/C][C]0.203163[/C][/ROW]
[ROW][C]38[/C][C]0.719822[/C][C]0.560357[/C][C]0.280178[/C][/ROW]
[ROW][C]39[/C][C]0.699258[/C][C]0.601485[/C][C]0.300742[/C][/ROW]
[ROW][C]40[/C][C]0.751988[/C][C]0.496025[/C][C]0.248012[/C][/ROW]
[ROW][C]41[/C][C]0.652543[/C][C]0.694915[/C][C]0.347457[/C][/ROW]
[ROW][C]42[/C][C]0.592074[/C][C]0.815851[/C][C]0.407926[/C][/ROW]
[ROW][C]43[/C][C]0.558618[/C][C]0.882765[/C][C]0.441382[/C][/ROW]
[ROW][C]44[/C][C]0.598931[/C][C]0.802137[/C][C]0.401069[/C][/ROW]
[ROW][C]45[/C][C]0.855758[/C][C]0.288483[/C][C]0.144242[/C][/ROW]
[ROW][C]46[/C][C]0.822454[/C][C]0.355093[/C][C]0.177546[/C][/ROW]
[/TABLE]
Source: https://freestatistics.org/blog/index.php?pk=226672&T=5

Globally Unique Identifier (entire table): ba.freestatistics.org/blog/index.php?pk=226672&T=5

As an alternative you can also use a QR Code:  

The GUIDs for individual cells are displayed in the table below:

Goldfeld-Quandt test for Heteroskedasticity
p-valuesAlternative Hypothesis
breakpoint indexgreater2-sidedless
80.3613030.7226070.638697
90.9682220.0635570.0317785
100.9392440.1215110.0607555
110.9656520.06869540.0343477
120.9702220.05955570.0297778
130.9479830.1040350.0520174
140.9378270.1243450.0621725
150.949970.100060.0500298
160.9729540.05409140.0270457
170.9635540.0728910.0364455
180.9469940.1060120.0530059
190.9236060.1527880.0763941
200.8961940.2076120.103806
210.8552380.2895230.144762
220.8156550.368690.184345
230.8166710.3666580.183329
240.7595790.4808430.240421
250.8947420.2105170.105258
260.8560740.2878510.143926
270.9187710.1624580.081229
280.8811060.2377870.118894
290.8530920.2938150.146908
300.9703060.05938740.0296937
310.9584540.08309280.0415464
320.9382640.1234720.0617358
330.9205080.1589850.0794924
340.8898440.2203120.110156
350.866880.2662410.13312
360.8539790.2920420.146021
370.7968370.4063260.203163
380.7198220.5603570.280178
390.6992580.6014850.300742
400.7519880.4960250.248012
410.6525430.6949150.347457
420.5920740.8158510.407926
430.5586180.8827650.441382
440.5989310.8021370.401069
450.8557580.2884830.144242
460.8224540.3550930.177546


Meta Analysis of Goldfeld-Quandt test for Heteroskedasticity
Description# significant tests% significant testsOK/NOK
1% type I error level00OK
5% type I error level00OK
10% type I error level70.179487NOK

\begin{tabular}{lllllllll}
\hline
Meta Analysis of Goldfeld-Quandt test for Heteroskedasticity \tabularnewline
Description & # significant tests & % significant tests & OK/NOK \tabularnewline
1% type I error level & 0 & 0 & OK \tabularnewline
5% type I error level & 0 & 0 & OK \tabularnewline
10% type I error level & 7 & 0.179487 & NOK \tabularnewline
\hline
\end{tabular}
%Source: https://freestatistics.org/blog/index.php?pk=226672&T=6

[TABLE]
[ROW][C]Meta Analysis of Goldfeld-Quandt test for Heteroskedasticity[/C][/ROW]
[ROW][C]Description[/C][C]# significant tests[/C][C]% significant tests[/C][C]OK/NOK[/C][/ROW]
[ROW][C]1% type I error level[/C][C]0[/C][C]0[/C][C]OK[/C][/ROW]
[ROW][C]5% type I error level[/C][C]0[/C][C]0[/C][C]OK[/C][/ROW]
[ROW][C]10% type I error level[/C][C]7[/C][C]0.179487[/C][C]NOK[/C][/ROW]
[/TABLE]
Source: https://freestatistics.org/blog/index.php?pk=226672&T=6

Globally Unique Identifier (entire table): ba.freestatistics.org/blog/index.php?pk=226672&T=6

As an alternative you can also use a QR Code:  

The GUIDs for individual cells are displayed in the table below:

Meta Analysis of Goldfeld-Quandt test for Heteroskedasticity
Description# significant tests% significant testsOK/NOK
1% type I error level00OK
5% type I error level00OK
10% type I error level70.179487NOK


Parameters (Session):
par1 = 1 ; par2 = Do not include Seasonal Dummies ; par3 = No Linear Trend ;
Parameters (R input):
par1 = 1 ; par2 = Do not include Seasonal Dummies ; par3 = No Linear Trend ;
R code (references can be found in the software module):
par3 <- 'No Linear Trend'
par2 <- 'Do not include Seasonal Dummies'
par1 <- '1'
library(lattice)
library(lmtest)
n25 <- 25 #minimum number of obs. for Goldfeld-Quandt test
par1 <- as.numeric(par1)
x <- t(y)
k <- length(x[1,])
n <- length(x[,1])
x1 <- cbind(x[,par1], x[,1:k!=par1])
mycolnames <- c(colnames(x)[par1], colnames(x)[1:k!=par1])
colnames(x1) <- mycolnames #colnames(x)[par1]
x <- x1
if (par3 == 'First Differences'){
x2 <- array(0, dim=c(n-1,k), dimnames=list(1:(n-1), paste('(1-B)',colnames(x),sep='')))
for (i in 1:n-1) {
for (j in 1:k) {
x2[i,j] <- x[i+1,j] - x[i,j]
}
}
x <- x2
}
if (par2 == 'Include Monthly Dummies'){
x2 <- array(0, dim=c(n,11), dimnames=list(1:n, paste('M', seq(1:11), sep ='')))
for (i in 1:11){
x2[seq(i,n,12),i] <- 1
}
x <- cbind(x, x2)
}
if (par2 == 'Include Quarterly Dummies'){
x2 <- array(0, dim=c(n,3), dimnames=list(1:n, paste('Q', seq(1:3), sep ='')))
for (i in 1:3){
x2[seq(i,n,4),i] <- 1
}
x <- cbind(x, x2)
}
k <- length(x[1,])
if (par3 == 'Linear Trend'){
x <- cbind(x, c(1:n))
colnames(x)[k+1] <- 't'
}
x
k <- length(x[1,])
df <- as.data.frame(x)
(mylm <- lm(df))
(mysum <- summary(mylm))
if (n > n25) {
kp3 <- k + 3
nmkm3 <- n - k - 3
gqarr <- array(NA, dim=c(nmkm3-kp3+1,3))
numgqtests <- 0
numsignificant1 <- 0
numsignificant5 <- 0
numsignificant10 <- 0
for (mypoint in kp3:nmkm3) {
j <- 0
numgqtests <- numgqtests + 1
for (myalt in c('greater', 'two.sided', 'less')) {
j <- j + 1
gqarr[mypoint-kp3+1,j] <- gqtest(mylm, point=mypoint, alternative=myalt)$p.value
}
if (gqarr[mypoint-kp3+1,2] < 0.01) numsignificant1 <- numsignificant1 + 1
if (gqarr[mypoint-kp3+1,2] < 0.05) numsignificant5 <- numsignificant5 + 1
if (gqarr[mypoint-kp3+1,2] < 0.10) numsignificant10 <- numsignificant10 + 1
}
gqarr
}
bitmap(file='test0.png')
plot(x[,1], type='l', main='Actuals and Interpolation', ylab='value of Actuals and Interpolation (dots)', xlab='time or index')
points(x[,1]-mysum$resid)
grid()
dev.off()
bitmap(file='test1.png')
plot(mysum$resid, type='b', pch=19, main='Residuals', ylab='value of Residuals', xlab='time or index')
grid()
dev.off()
bitmap(file='test2.png')
hist(mysum$resid, main='Residual Histogram', xlab='values of Residuals')
grid()
dev.off()
bitmap(file='test3.png')
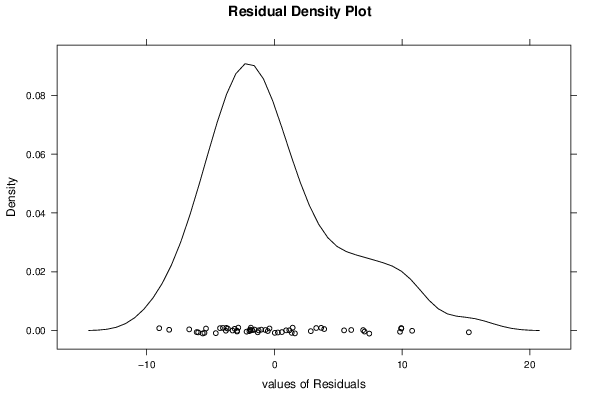
densityplot(~mysum$resid,col='black',main='Residual Density Plot', xlab='values of Residuals')
dev.off()
bitmap(file='test4.png')
qqnorm(mysum$resid, main='Residual Normal Q-Q Plot')
qqline(mysum$resid)
grid()
dev.off()
(myerror <- as.ts(mysum$resid))
bitmap(file='test5.png')
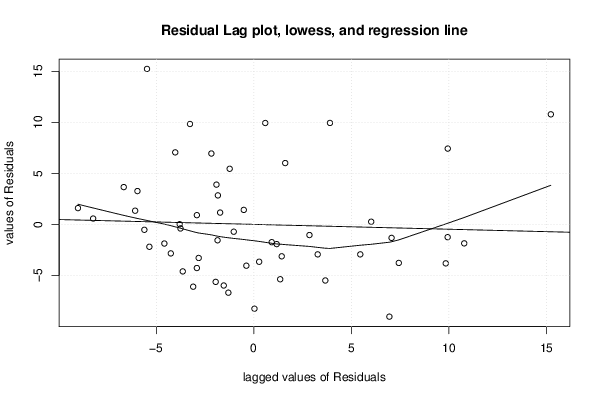
dum <- cbind(lag(myerror,k=1),myerror)
dum
dum1 <- dum[2:length(myerror),]
dum1
z <- as.data.frame(dum1)
z
plot(z,main=paste('Residual Lag plot, lowess, and regression line'), ylab='values of Residuals', xlab='lagged values of Residuals')
lines(lowess(z))
abline(lm(z))
grid()
dev.off()
bitmap(file='test6.png')
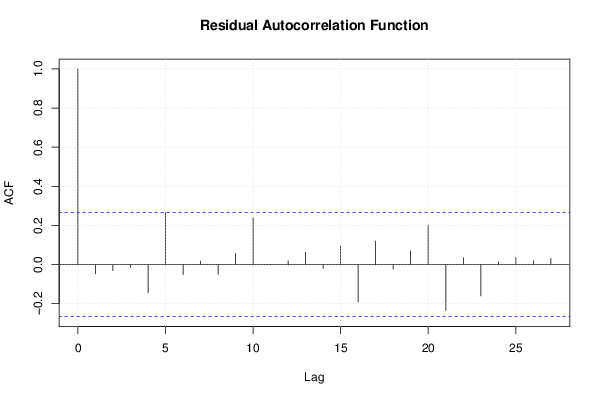
acf(mysum$resid, lag.max=length(mysum$resid)/2, main='Residual Autocorrelation Function')
grid()
dev.off()
bitmap(file='test7.png')
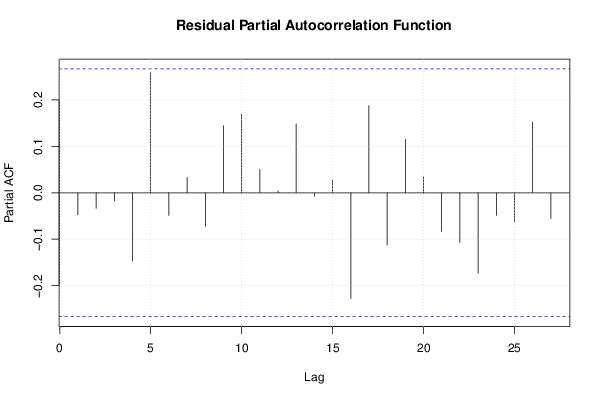
pacf(mysum$resid, lag.max=length(mysum$resid)/2, main='Residual Partial Autocorrelation Function')
grid()
dev.off()
bitmap(file='test8.png')
opar <- par(mfrow = c(2,2), oma = c(0, 0, 1.1, 0))
plot(mylm, las = 1, sub='Residual Diagnostics')
par(opar)
dev.off()
if (n > n25) {
bitmap(file='test9.png')
plot(kp3:nmkm3,gqarr[,2], main='Goldfeld-Quandt test',ylab='2-sided p-value',xlab='breakpoint')
grid()
dev.off()
}
load(file='createtable')
a<-table.start()
a<-table.row.start(a)
a<-table.element(a, 'Multiple Linear Regression - Estimated Regression Equation', 1, TRUE)
a<-table.row.end(a)
myeq <- colnames(x)[1]
myeq <- paste(myeq, '[t] = ', sep='')
for (i in 1:k){
if (mysum$coefficients[i,1] > 0) myeq <- paste(myeq, '+', '')
myeq <- paste(myeq, signif(mysum$coefficients[i,1],6), sep=' ')
if (rownames(mysum$coefficients)[i] != '(Intercept)') {
myeq <- paste(myeq, rownames(mysum$coefficients)[i], sep='')
if (rownames(mysum$coefficients)[i] != 't') myeq <- paste(myeq, '[t]', sep='')
}
}
myeq <- paste(myeq, ' + e[t]')
a<-table.row.start(a)
a<-table.element(a, myeq)
a<-table.row.end(a)
a<-table.end(a)
table.save(a,file='mytable1.tab')
a<-table.start()
a<-table.row.start(a)
a<-table.element(a,hyperlink('ols1.htm','Multiple Linear Regression - Ordinary Least Squares',''), 6, TRUE)
a<-table.row.end(a)
a<-table.row.start(a)
a<-table.element(a,'Variable',header=TRUE)
a<-table.element(a,'Parameter',header=TRUE)
a<-table.element(a,'S.D.',header=TRUE)
a<-table.element(a,'T-STAT
H0: parameter = 0',header=TRUE)
a<-table.element(a,'2-tail p-value',header=TRUE)
a<-table.element(a,'1-tail p-value',header=TRUE)
a<-table.row.end(a)
for (i in 1:k){
a<-table.row.start(a)
a<-table.element(a,rownames(mysum$coefficients)[i],header=TRUE)
a<-table.element(a,signif(mysum$coefficients[i,1],6))
a<-table.element(a, signif(mysum$coefficients[i,2],6))
a<-table.element(a, signif(mysum$coefficients[i,3],4))
a<-table.element(a, signif(mysum$coefficients[i,4],6))
a<-table.element(a, signif(mysum$coefficients[i,4]/2,6))
a<-table.row.end(a)
}
a<-table.end(a)
table.save(a,file='mytable2.tab')
a<-table.start()
a<-table.row.start(a)
a<-table.element(a, 'Multiple Linear Regression - Regression Statistics', 2, TRUE)
a<-table.row.end(a)
a<-table.row.start(a)
a<-table.element(a, 'Multiple R',1,TRUE)
a<-table.element(a, signif(sqrt(mysum$r.squared),6))
a<-table.row.end(a)
a<-table.row.start(a)
a<-table.element(a, 'R-squared',1,TRUE)
a<-table.element(a, signif(mysum$r.squared,6))
a<-table.row.end(a)
a<-table.row.start(a)
a<-table.element(a, 'Adjusted R-squared',1,TRUE)
a<-table.element(a, signif(mysum$adj.r.squared,6))
a<-table.row.end(a)
a<-table.row.start(a)
a<-table.element(a, 'F-TEST (value)',1,TRUE)
a<-table.element(a, signif(mysum$fstatistic[1],6))
a<-table.row.end(a)
a<-table.row.start(a)
a<-table.element(a, 'F-TEST (DF numerator)',1,TRUE)
a<-table.element(a, signif(mysum$fstatistic[2],6))
a<-table.row.end(a)
a<-table.row.start(a)
a<-table.element(a, 'F-TEST (DF denominator)',1,TRUE)
a<-table.element(a, signif(mysum$fstatistic[3],6))
a<-table.row.end(a)
a<-table.row.start(a)
a<-table.element(a, 'p-value',1,TRUE)
a<-table.element(a, signif(1-pf(mysum$fstatistic[1],mysum$fstatistic[2],mysum$fstatistic[3]),6))
a<-table.row.end(a)
a<-table.row.start(a)
a<-table.element(a, 'Multiple Linear Regression - Residual Statistics', 2, TRUE)
a<-table.row.end(a)
a<-table.row.start(a)
a<-table.element(a, 'Residual Standard Deviation',1,TRUE)
a<-table.element(a, signif(mysum$sigma,6))
a<-table.row.end(a)
a<-table.row.start(a)
a<-table.element(a, 'Sum Squared Residuals',1,TRUE)
a<-table.element(a, signif(sum(myerror*myerror),6))
a<-table.row.end(a)
a<-table.end(a)
table.save(a,file='mytable3.tab')
a<-table.start()
a<-table.row.start(a)
a<-table.element(a, 'Multiple Linear Regression - Actuals, Interpolation, and Residuals', 4, TRUE)
a<-table.row.end(a)
a<-table.row.start(a)
a<-table.element(a, 'Time or Index', 1, TRUE)
a<-table.element(a, 'Actuals', 1, TRUE)
a<-table.element(a, 'Interpolation
Forecast', 1, TRUE)
a<-table.element(a, 'Residuals
Prediction Error', 1, TRUE)
a<-table.row.end(a)
for (i in 1:n) {
a<-table.row.start(a)
a<-table.element(a,i, 1, TRUE)
a<-table.element(a,signif(x[i],6))
a<-table.element(a,signif(x[i]-mysum$resid[i],6))
a<-table.element(a,signif(mysum$resid[i],6))
a<-table.row.end(a)
}
a<-table.end(a)
table.save(a,file='mytable4.tab')
if (n > n25) {
a<-table.start()
a<-table.row.start(a)
a<-table.element(a,'Goldfeld-Quandt test for Heteroskedasticity',4,TRUE)
a<-table.row.end(a)
a<-table.row.start(a)
a<-table.element(a,'p-values',header=TRUE)
a<-table.element(a,'Alternative Hypothesis',3,header=TRUE)
a<-table.row.end(a)
a<-table.row.start(a)
a<-table.element(a,'breakpoint index',header=TRUE)
a<-table.element(a,'greater',header=TRUE)
a<-table.element(a,'2-sided',header=TRUE)
a<-table.element(a,'less',header=TRUE)
a<-table.row.end(a)
for (mypoint in kp3:nmkm3) {
a<-table.row.start(a)
a<-table.element(a,mypoint,header=TRUE)
a<-table.element(a,signif(gqarr[mypoint-kp3+1,1],6))
a<-table.element(a,signif(gqarr[mypoint-kp3+1,2],6))
a<-table.element(a,signif(gqarr[mypoint-kp3+1,3],6))
a<-table.row.end(a)
}
a<-table.end(a)
table.save(a,file='mytable5.tab')
a<-table.start()
a<-table.row.start(a)
a<-table.element(a,'Meta Analysis of Goldfeld-Quandt test for Heteroskedasticity',4,TRUE)
a<-table.row.end(a)
a<-table.row.start(a)
a<-table.element(a,'Description',header=TRUE)
a<-table.element(a,'# significant tests',header=TRUE)
a<-table.element(a,'% significant tests',header=TRUE)
a<-table.element(a,'OK/NOK',header=TRUE)
a<-table.row.end(a)
a<-table.row.start(a)
a<-table.element(a,'1% type I error level',header=TRUE)
a<-table.element(a,signif(numsignificant1,6))
a<-table.element(a,signif(numsignificant1/numgqtests,6))
if (numsignificant1/numgqtests < 0.01) dum <- 'OK' else dum <- 'NOK'
a<-table.element(a,dum)
a<-table.row.end(a)
a<-table.row.start(a)
a<-table.element(a,'5% type I error level',header=TRUE)
a<-table.element(a,signif(numsignificant5,6))
a<-table.element(a,signif(numsignificant5/numgqtests,6))
if (numsignificant5/numgqtests < 0.05) dum <- 'OK' else dum <- 'NOK'
a<-table.element(a,dum)
a<-table.row.end(a)
a<-table.row.start(a)
a<-table.element(a,'10% type I error level',header=TRUE)
a<-table.element(a,signif(numsignificant10,6))
a<-table.element(a,signif(numsignificant10/numgqtests,6))
if (numsignificant10/numgqtests < 0.1) dum <- 'OK' else dum <- 'NOK'
a<-table.element(a,dum)
a<-table.row.end(a)
a<-table.end(a)
table.save(a,file='mytable6.tab')
}