Free Statistics

of Irreproducible Research!

Author's title

Author*Unverified author*
R Software Modulerwasp_logisticregression.wasp
Title produced by softwareBias-Reduced Logistic Regression
Date of computationMon, 02 Sep 2013 06:42:30 -0400
Cite this page as followsStatistical Computations at FreeStatistics.org, Office for Research Development and Education, URL https://freestatistics.org/blog/index.php?v=date/2013/Sep/02/t1378118675wp0n7gymn96qo4d.htm/, Retrieved Mon, 29 Apr 2024 22:30:15 +0000
Statistical Computations at FreeStatistics.org, Office for Research Development and Education, URL https://freestatistics.org/blog/index.php?pk=211375, Retrieved Mon, 29 Apr 2024 22:30:15 +0000
QR Codes:

Original text written by user:
IsPrivate?No (this computation is public)
User-defined keywords
Estimated Impact178
Family? (F = Feedback message, R = changed R code, M = changed R Module, P = changed Parameters, D = changed Data)
-       [Bias-Reduced Logistic Regression] [] [2013-09-02 10:42:30] [d41d8cd98f00b204e9800998ecf8427e] [Current]
Feedback Forum

Post a new message
Dataseries X:
1	0	4	3	6	8	4	15	14	1	2	2	2	3	4	4	5	2	1	10	10	4	3
1	0	5	5	4	2	0	10	13	6	4	8	5	2	5	4	2	2	2	4	2	17	15
0	0	4	6	7	1	2	5	9	2	2	7	3	1	3	0	2	8	8	3	3	0	2
1	0	4	2	3	6	5	1	2	3	5	7	5	5	2	2	2	0	1	3	2	4	4
1	0	5	1	2	1	0	6	2	4	3	17	10	1	4	1	2	1	3	2	2	9	9
1	0	0	3	2	0	1	1	2	2	5	3	4	6	10	3	6	9	5	2	5	4	0
1	1	2	1	2	2	1	6	2	3	2	12	8	2	3	3	3	11	14	10	7	6	3
0	1	2	3	5	1	2	2	3	2	2	3	4	6	2	3	5	8	6	5	11	6	5
1	4	5	2	4	1	1	1	1	2	1	12	5	2	2	2	4	5	8	10	10	7	8
1	3	4	2	4	2	2	1	3	5	2	4	2	3	4	6	1	3	3	6	0	2	4
1	2	2	1	3	2	3	2	1	3	5	6	7	2	4	2	1	8	5	2	6	12	11
1	2	3	1	1	2	2	6	3	2	6	5	2	1	1	3	3	1	3	5	8	3	6
1	0	2	1	2	5	4	1	1	1	1	28	10	10	7	1	2	19	14	5	8	2	5
1	1	0	0	2	3	5	1	2	4	6	2	0	1	3	3	3	1	4	2	4	4	8
1	1	5	1	2	2	3	1	1	2	2	1	11	1	2	1	1	0	3	1	2	10	13
1	2	0	0	1	1	3	3	3	2	0	5	4	4	2	4	4	5	3	9	14	27	13
0	0	0	1	3	2	2	3	2	3	2	23	13	1	1	1	1	0	3	3	2	0	2
1	1	1	1	1	3	4	1	6	0	1	1	1	2	1	1	5	3	3	11	12	9	5
1	7	7	3	4	2	5	3	5	2	1	6	2	1	1	2	1	9	5	11	7	1	1
1	3	2	1	0	4	2	3	7	1	1	6	3	1	0	1	1	8	10	1	4	4	3
0	3	1	3	0	2	2	2	0	1	0	1	2	13	9	5	2	2	3	4	2	2	2
0	1	1	1	2	2	3	1	0	4	5	1	0	0	1	7	2	7	8	7	2	6	0
1	1	2	1	1	2	2	1	0	1	0	3	4	5	1	0	1	16	17	6	5	6	7
1	1	1	1	1	2	1	5	3	3	2	5	1	2	7	4	4	3	4	6	2	6	6
0	1	0	0	3	1	2	4	1	1	1	0	0	2	1	4	4	1	0	1	0	4	5
0	1	0	1	0	1	3	0	1	1	1	0	0	5	5	0	5	0	0	0	2	2	3
1	2	1	0	0	1	2	2	1	1	0	3	1	2	0	6	2	2	2	1	1	7	7
1	2	0	0	0	1	1	1	1	1	0	2	2	1	0	0	0	3	3	3	5	6	6
1	1	2	1	1	0	0	1	1	1	1	1	1	2	1	1	2	3	5	5	1	1	1
1	2	4	0	2	5	4	1	3	0	0	2	1	0	3	1	3	5	5	1	2	0	3
1	1	0	0	3	1	2	4	1	1	1	0	0	2	1	4	4	1	0	1	0	4	5
1	1	0	1	0	1	3	0	1	1	1	0	0	5	5	0	5	0	0	0	2	2	3
1	2	1	0	0	1	2	2	1	1	0	3	1	2	0	6	2	2	2	1	1	7	7
0	2	0	0	0	1	1	1	1	1	0	2	2	1	0	0	0	3	3	3	5	6	6
1	1	2	1	1	0	0	1	1	1	1	1	1	2	1	1	2	3	5	5	1	1	1
1	2	4	0	2	5	4	1	3	0	0	2	1	0	3	1	3	5	5	1	2	0	3
1	3	3	4	5	1	3	4	4	1	2	4	6	6	6	2	4	4	5	7	5	6	4
1	2	0	1	1	2	4	4	5	7	5	6	4	7	7	3	4	6	9	4	13	3	3
1	4	0	1	0	2	2	9	5	11	7	1	2	0	0	0	5	4	10	5	10	5	3
1	3	4	2	4	1	2	3	1	1	2	2	2	11	7	2	7	10	7	9	4	10	8
1	3	5	2	3	2	3	5	4	3	3	7	5	3	6	2	4	2	2	4	5	4	7
1	6	6	2	2	1	2	7	5	2	4	1	1	2	1	1	1	6	14	8	5	7	4


Summary of computational transaction
Raw Inputview raw input (R code)
Raw Outputview raw output of R engine
Computing time6 seconds
R Server'Herman Ole Andreas Wold' @ wold.wessa.net

\begin{tabular}{lllllllll}
\hline
Summary of computational transaction \tabularnewline
Raw Input & view raw input (R code)  \tabularnewline
Raw Output & view raw output of R engine  \tabularnewline
Computing time & 6 seconds \tabularnewline
R Server & 'Herman Ole Andreas Wold' @ wold.wessa.net \tabularnewline
\hline
\end{tabular}
%Source: https://freestatistics.org/blog/index.php?pk=211375&T=0

[TABLE]
[ROW][C]Summary of computational transaction[/C][/ROW]
[ROW][C]Raw Input[/C][C]view raw input (R code) [/C][/ROW]
[ROW][C]Raw Output[/C][C]view raw output of R engine [/C][/ROW]
[ROW][C]Computing time[/C][C]6 seconds[/C][/ROW]
[ROW][C]R Server[/C][C]'Herman Ole Andreas Wold' @ wold.wessa.net[/C][/ROW]
[/TABLE]
Source: https://freestatistics.org/blog/index.php?pk=211375&T=0

Globally Unique Identifier (entire table): ba.freestatistics.org/blog/index.php?pk=211375&T=0

As an alternative you can also use a QR Code:  

The GUIDs for individual cells are displayed in the table below:

Summary of computational transaction
Raw Inputview raw input (R code)
Raw Outputview raw output of R engine
Computing time6 seconds
R Server'Herman Ole Andreas Wold' @ wold.wessa.net


Coefficients of Bias-Reduced Logistic Regression
VariableParameterS.E.t-stat2-sided p-value
(Intercept)-0.7131551974798981.85432939002791-0.3845892759479830.704812593171576
X10.101743306362460.4770048494371620.2132961677067040.833367971199853
X20.3163025199879140.4244332642111010.745234991361550.4652493886963
X3-0.7632629443373190.841613393656208-0.9069044647940880.375816044195348
X4-0.2350883101454270.468710426647715-0.5015640719298960.621736209428919
X5-0.06065070493640820.524856261994412-0.1155567901694460.909216377880584
X6-0.1074924986790970.560175362173804-0.1918908005199730.849863684221065
X7-0.134156527268730.29631127944917-0.4527553845338640.655852287140947
X80.3306978217891450.4165563814559050.793884901326740.437065906700159
X9-0.06738091946651640.334511326195192-0.2014309058916550.842502486157058
X100.2024660572639740.3886543857219790.5209411361404430.608426348722676
X11-0.05967564845679540.147127302201151-0.4056055372727990.689563588015639
X120.1590892023634820.3234673389035520.4918246240957190.62847735017023
X130.02383314257165180.3067284638734190.07770111149999850.938878253758898
X140.08218147822846090.2757000879224840.2980828872697610.768875060758327
X15-0.007037609981878370.259494292866019-0.02712048077878920.97864647209318
X160.2573700340060390.3920312009405580.6565039552682510.51937276927589
X170.09755365706364590.2461929294836630.3962488170080420.69633630969842
X18-0.03188089376634840.257707578769453-0.1237095700428320.902844571198251
X190.1436539096448080.2593831233491970.5538290532935450.586155393472378
X20-0.1288061783593860.232391976989494-0.5542625869791070.585864558483042
X21-0.06697586349303520.199131141441964-0.3363404789830680.740300338033705
X220.1460964070749660.2745019285585820.5322236089273480.600740224853034

\begin{tabular}{lllllllll}
\hline
Coefficients of Bias-Reduced Logistic Regression \tabularnewline
Variable & Parameter & S.E. & t-stat & 2-sided p-value \tabularnewline
(Intercept) & -0.713155197479898 & 1.85432939002791 & -0.384589275947983 & 0.704812593171576 \tabularnewline
X1 & 0.10174330636246 & 0.477004849437162 & 0.213296167706704 & 0.833367971199853 \tabularnewline
X2 & 0.316302519987914 & 0.424433264211101 & 0.74523499136155 & 0.4652493886963 \tabularnewline
X3 & -0.763262944337319 & 0.841613393656208 & -0.906904464794088 & 0.375816044195348 \tabularnewline
X4 & -0.235088310145427 & 0.468710426647715 & -0.501564071929896 & 0.621736209428919 \tabularnewline
X5 & -0.0606507049364082 & 0.524856261994412 & -0.115556790169446 & 0.909216377880584 \tabularnewline
X6 & -0.107492498679097 & 0.560175362173804 & -0.191890800519973 & 0.849863684221065 \tabularnewline
X7 & -0.13415652726873 & 0.29631127944917 & -0.452755384533864 & 0.655852287140947 \tabularnewline
X8 & 0.330697821789145 & 0.416556381455905 & 0.79388490132674 & 0.437065906700159 \tabularnewline
X9 & -0.0673809194665164 & 0.334511326195192 & -0.201430905891655 & 0.842502486157058 \tabularnewline
X10 & 0.202466057263974 & 0.388654385721979 & 0.520941136140443 & 0.608426348722676 \tabularnewline
X11 & -0.0596756484567954 & 0.147127302201151 & -0.405605537272799 & 0.689563588015639 \tabularnewline
X12 & 0.159089202363482 & 0.323467338903552 & 0.491824624095719 & 0.62847735017023 \tabularnewline
X13 & 0.0238331425716518 & 0.306728463873419 & 0.0777011114999985 & 0.938878253758898 \tabularnewline
X14 & 0.0821814782284609 & 0.275700087922484 & 0.298082887269761 & 0.768875060758327 \tabularnewline
X15 & -0.00703760998187837 & 0.259494292866019 & -0.0271204807787892 & 0.97864647209318 \tabularnewline
X16 & 0.257370034006039 & 0.392031200940558 & 0.656503955268251 & 0.51937276927589 \tabularnewline
X17 & 0.0975536570636459 & 0.246192929483663 & 0.396248817008042 & 0.69633630969842 \tabularnewline
X18 & -0.0318808937663484 & 0.257707578769453 & -0.123709570042832 & 0.902844571198251 \tabularnewline
X19 & 0.143653909644808 & 0.259383123349197 & 0.553829053293545 & 0.586155393472378 \tabularnewline
X20 & -0.128806178359386 & 0.232391976989494 & -0.554262586979107 & 0.585864558483042 \tabularnewline
X21 & -0.0669758634930352 & 0.199131141441964 & -0.336340478983068 & 0.740300338033705 \tabularnewline
X22 & 0.146096407074966 & 0.274501928558582 & 0.532223608927348 & 0.600740224853034 \tabularnewline
\hline
\end{tabular}
%Source: https://freestatistics.org/blog/index.php?pk=211375&T=1

[TABLE]
[ROW][C]Coefficients of Bias-Reduced Logistic Regression[/C][/ROW]
[ROW][C]Variable[/C][C]Parameter[/C][C]S.E.[/C][C]t-stat[/C][C]2-sided p-value[/C][/ROW]
[ROW][C](Intercept)[/C][C]-0.713155197479898[/C][C]1.85432939002791[/C][C]-0.384589275947983[/C][C]0.704812593171576[/C][/ROW]
[ROW][C]X1[/C][C]0.10174330636246[/C][C]0.477004849437162[/C][C]0.213296167706704[/C][C]0.833367971199853[/C][/ROW]
[ROW][C]X2[/C][C]0.316302519987914[/C][C]0.424433264211101[/C][C]0.74523499136155[/C][C]0.4652493886963[/C][/ROW]
[ROW][C]X3[/C][C]-0.763262944337319[/C][C]0.841613393656208[/C][C]-0.906904464794088[/C][C]0.375816044195348[/C][/ROW]
[ROW][C]X4[/C][C]-0.235088310145427[/C][C]0.468710426647715[/C][C]-0.501564071929896[/C][C]0.621736209428919[/C][/ROW]
[ROW][C]X5[/C][C]-0.0606507049364082[/C][C]0.524856261994412[/C][C]-0.115556790169446[/C][C]0.909216377880584[/C][/ROW]
[ROW][C]X6[/C][C]-0.107492498679097[/C][C]0.560175362173804[/C][C]-0.191890800519973[/C][C]0.849863684221065[/C][/ROW]
[ROW][C]X7[/C][C]-0.13415652726873[/C][C]0.29631127944917[/C][C]-0.452755384533864[/C][C]0.655852287140947[/C][/ROW]
[ROW][C]X8[/C][C]0.330697821789145[/C][C]0.416556381455905[/C][C]0.79388490132674[/C][C]0.437065906700159[/C][/ROW]
[ROW][C]X9[/C][C]-0.0673809194665164[/C][C]0.334511326195192[/C][C]-0.201430905891655[/C][C]0.842502486157058[/C][/ROW]
[ROW][C]X10[/C][C]0.202466057263974[/C][C]0.388654385721979[/C][C]0.520941136140443[/C][C]0.608426348722676[/C][/ROW]
[ROW][C]X11[/C][C]-0.0596756484567954[/C][C]0.147127302201151[/C][C]-0.405605537272799[/C][C]0.689563588015639[/C][/ROW]
[ROW][C]X12[/C][C]0.159089202363482[/C][C]0.323467338903552[/C][C]0.491824624095719[/C][C]0.62847735017023[/C][/ROW]
[ROW][C]X13[/C][C]0.0238331425716518[/C][C]0.306728463873419[/C][C]0.0777011114999985[/C][C]0.938878253758898[/C][/ROW]
[ROW][C]X14[/C][C]0.0821814782284609[/C][C]0.275700087922484[/C][C]0.298082887269761[/C][C]0.768875060758327[/C][/ROW]
[ROW][C]X15[/C][C]-0.00703760998187837[/C][C]0.259494292866019[/C][C]-0.0271204807787892[/C][C]0.97864647209318[/C][/ROW]
[ROW][C]X16[/C][C]0.257370034006039[/C][C]0.392031200940558[/C][C]0.656503955268251[/C][C]0.51937276927589[/C][/ROW]
[ROW][C]X17[/C][C]0.0975536570636459[/C][C]0.246192929483663[/C][C]0.396248817008042[/C][C]0.69633630969842[/C][/ROW]
[ROW][C]X18[/C][C]-0.0318808937663484[/C][C]0.257707578769453[/C][C]-0.123709570042832[/C][C]0.902844571198251[/C][/ROW]
[ROW][C]X19[/C][C]0.143653909644808[/C][C]0.259383123349197[/C][C]0.553829053293545[/C][C]0.586155393472378[/C][/ROW]
[ROW][C]X20[/C][C]-0.128806178359386[/C][C]0.232391976989494[/C][C]-0.554262586979107[/C][C]0.585864558483042[/C][/ROW]
[ROW][C]X21[/C][C]-0.0669758634930352[/C][C]0.199131141441964[/C][C]-0.336340478983068[/C][C]0.740300338033705[/C][/ROW]
[ROW][C]X22[/C][C]0.146096407074966[/C][C]0.274501928558582[/C][C]0.532223608927348[/C][C]0.600740224853034[/C][/ROW]
[/TABLE]
Source: https://freestatistics.org/blog/index.php?pk=211375&T=1

Globally Unique Identifier (entire table): ba.freestatistics.org/blog/index.php?pk=211375&T=1

As an alternative you can also use a QR Code:  

The GUIDs for individual cells are displayed in the table below:

Coefficients of Bias-Reduced Logistic Regression
VariableParameterS.E.t-stat2-sided p-value
(Intercept)-0.7131551974798981.85432939002791-0.3845892759479830.704812593171576
X10.101743306362460.4770048494371620.2132961677067040.833367971199853
X20.3163025199879140.4244332642111010.745234991361550.4652493886963
X3-0.7632629443373190.841613393656208-0.9069044647940880.375816044195348
X4-0.2350883101454270.468710426647715-0.5015640719298960.621736209428919
X5-0.06065070493640820.524856261994412-0.1155567901694460.909216377880584
X6-0.1074924986790970.560175362173804-0.1918908005199730.849863684221065
X7-0.134156527268730.29631127944917-0.4527553845338640.655852287140947
X80.3306978217891450.4165563814559050.793884901326740.437065906700159
X9-0.06738091946651640.334511326195192-0.2014309058916550.842502486157058
X100.2024660572639740.3886543857219790.5209411361404430.608426348722676
X11-0.05967564845679540.147127302201151-0.4056055372727990.689563588015639
X120.1590892023634820.3234673389035520.4918246240957190.62847735017023
X130.02383314257165180.3067284638734190.07770111149999850.938878253758898
X140.08218147822846090.2757000879224840.2980828872697610.768875060758327
X15-0.007037609981878370.259494292866019-0.02712048077878920.97864647209318
X160.2573700340060390.3920312009405580.6565039552682510.51937276927589
X170.09755365706364590.2461929294836630.3962488170080420.69633630969842
X18-0.03188089376634840.257707578769453-0.1237095700428320.902844571198251
X190.1436539096448080.2593831233491970.5538290532935450.586155393472378
X20-0.1288061783593860.232391976989494-0.5542625869791070.585864558483042
X21-0.06697586349303520.199131141441964-0.3363404789830680.740300338033705
X220.1460964070749660.2745019285585820.5322236089273480.600740224853034


Summary of Bias-Reduced Logistic Regression
Deviance27.8300899341374
Penalized deviance-41.2790513004221
Residual Degrees of Freedom19
ROC Area0.976102941176471
Hosmer–Lemeshow test
Chi-square10.2922665394073
Degrees of Freedom8
P(>Chi)0.245108903816807

\begin{tabular}{lllllllll}
\hline
Summary of Bias-Reduced Logistic Regression \tabularnewline
Deviance & 27.8300899341374 \tabularnewline
Penalized deviance & -41.2790513004221 \tabularnewline
Residual Degrees of Freedom & 19 \tabularnewline
ROC Area & 0.976102941176471 \tabularnewline
Hosmer–Lemeshow test \tabularnewline
Chi-square & 10.2922665394073 \tabularnewline
Degrees of Freedom & 8 \tabularnewline
P(>Chi) & 0.245108903816807 \tabularnewline
\hline
\end{tabular}
%Source: https://freestatistics.org/blog/index.php?pk=211375&T=2

[TABLE]
[ROW][C]Summary of Bias-Reduced Logistic Regression[/C][/ROW]
[ROW][C]Deviance[/C][C]27.8300899341374[/C][/ROW]
[ROW][C]Penalized deviance[/C][C]-41.2790513004221[/C][/ROW]
[ROW][C]Residual Degrees of Freedom[/C][C]19[/C][/ROW]
[ROW][C]ROC Area[/C][C]0.976102941176471[/C][/ROW]
[ROW][C]Hosmer–Lemeshow test[/C][/ROW]
[ROW][C]Chi-square[/C][C]10.2922665394073[/C][/ROW]
[ROW][C]Degrees of Freedom[/C][C]8[/C][/ROW]
[ROW][C]P(>Chi)[/C][C]0.245108903816807[/C][/ROW]
[/TABLE]
Source: https://freestatistics.org/blog/index.php?pk=211375&T=2

Globally Unique Identifier (entire table): ba.freestatistics.org/blog/index.php?pk=211375&T=2

As an alternative you can also use a QR Code:  

The GUIDs for individual cells are displayed in the table below:

Summary of Bias-Reduced Logistic Regression
Deviance27.8300899341374
Penalized deviance-41.2790513004221
Residual Degrees of Freedom19
ROC Area0.976102941176471
Hosmer–Lemeshow test
Chi-square10.2922665394073
Degrees of Freedom8
P(>Chi)0.245108903816807


Fit of Logistic Regression
IndexActualFittedError
110.7740591450968960.225940854903104
210.8926291536205210.107370846379479
300.158913457955538-0.158913457955538
410.5929525528524050.407047447147595
510.8753328633640280.124667136635972
610.7033699395263840.296630060473616
710.8050414734420750.194958526557925
800.38316853561194-0.38316853561194
910.7845640994333950.215435900566605
1010.7657209523303570.234279047669643
1110.8017559099420820.198244090057918
1210.8339637951579280.166036204842072
1310.7715754827016590.228424517298341
1410.7714493563083860.228550643691614
1510.9482562655998270.0517437344001728
1610.7106637755633630.289336224436637
1700.346516285347282-0.346516285347282
1810.8824070136548340.117592986345166
1910.8066933858609880.193306614139012
2010.8462053609698030.153794639030197
2100.3337741770362-0.3337741770362
2200.474582714710305-0.474582714710305
2310.7787954656961450.221204534303855
2410.849539608900830.15046039109917
2500.542846639902698-0.542846639902698
2600.639138819923992-0.639138819923992
2710.6739888740429060.326011125957094
2810.533121730220740.46687826977926
2910.7095650434207280.290434956579272
3010.8922687538350510.107731246164949
3110.5428466399026980.457153360097302
3210.6391388199239920.360861180076008
3310.6739888740429060.326011125957094
3400.53312173022074-0.53312173022074
3510.7095650434207280.290434956579272
3610.8922687538350510.107731246164949
3710.5486677913087560.451332208691244
3810.7432441629723720.256755837027628
3910.7040789110265090.295921088973491
4010.9620709122266740.037929087773326
4110.9113065272541520.0886934727458484
4210.8958196425678560.104180357432144

\begin{tabular}{lllllllll}
\hline
Fit of Logistic Regression \tabularnewline
Index & Actual & Fitted & Error \tabularnewline
1 & 1 & 0.774059145096896 & 0.225940854903104 \tabularnewline
2 & 1 & 0.892629153620521 & 0.107370846379479 \tabularnewline
3 & 0 & 0.158913457955538 & -0.158913457955538 \tabularnewline
4 & 1 & 0.592952552852405 & 0.407047447147595 \tabularnewline
5 & 1 & 0.875332863364028 & 0.124667136635972 \tabularnewline
6 & 1 & 0.703369939526384 & 0.296630060473616 \tabularnewline
7 & 1 & 0.805041473442075 & 0.194958526557925 \tabularnewline
8 & 0 & 0.38316853561194 & -0.38316853561194 \tabularnewline
9 & 1 & 0.784564099433395 & 0.215435900566605 \tabularnewline
10 & 1 & 0.765720952330357 & 0.234279047669643 \tabularnewline
11 & 1 & 0.801755909942082 & 0.198244090057918 \tabularnewline
12 & 1 & 0.833963795157928 & 0.166036204842072 \tabularnewline
13 & 1 & 0.771575482701659 & 0.228424517298341 \tabularnewline
14 & 1 & 0.771449356308386 & 0.228550643691614 \tabularnewline
15 & 1 & 0.948256265599827 & 0.0517437344001728 \tabularnewline
16 & 1 & 0.710663775563363 & 0.289336224436637 \tabularnewline
17 & 0 & 0.346516285347282 & -0.346516285347282 \tabularnewline
18 & 1 & 0.882407013654834 & 0.117592986345166 \tabularnewline
19 & 1 & 0.806693385860988 & 0.193306614139012 \tabularnewline
20 & 1 & 0.846205360969803 & 0.153794639030197 \tabularnewline
21 & 0 & 0.3337741770362 & -0.3337741770362 \tabularnewline
22 & 0 & 0.474582714710305 & -0.474582714710305 \tabularnewline
23 & 1 & 0.778795465696145 & 0.221204534303855 \tabularnewline
24 & 1 & 0.84953960890083 & 0.15046039109917 \tabularnewline
25 & 0 & 0.542846639902698 & -0.542846639902698 \tabularnewline
26 & 0 & 0.639138819923992 & -0.639138819923992 \tabularnewline
27 & 1 & 0.673988874042906 & 0.326011125957094 \tabularnewline
28 & 1 & 0.53312173022074 & 0.46687826977926 \tabularnewline
29 & 1 & 0.709565043420728 & 0.290434956579272 \tabularnewline
30 & 1 & 0.892268753835051 & 0.107731246164949 \tabularnewline
31 & 1 & 0.542846639902698 & 0.457153360097302 \tabularnewline
32 & 1 & 0.639138819923992 & 0.360861180076008 \tabularnewline
33 & 1 & 0.673988874042906 & 0.326011125957094 \tabularnewline
34 & 0 & 0.53312173022074 & -0.53312173022074 \tabularnewline
35 & 1 & 0.709565043420728 & 0.290434956579272 \tabularnewline
36 & 1 & 0.892268753835051 & 0.107731246164949 \tabularnewline
37 & 1 & 0.548667791308756 & 0.451332208691244 \tabularnewline
38 & 1 & 0.743244162972372 & 0.256755837027628 \tabularnewline
39 & 1 & 0.704078911026509 & 0.295921088973491 \tabularnewline
40 & 1 & 0.962070912226674 & 0.037929087773326 \tabularnewline
41 & 1 & 0.911306527254152 & 0.0886934727458484 \tabularnewline
42 & 1 & 0.895819642567856 & 0.104180357432144 \tabularnewline
\hline
\end{tabular}
%Source: https://freestatistics.org/blog/index.php?pk=211375&T=3

[TABLE]
[ROW][C]Fit of Logistic Regression[/C][/ROW]
[ROW][C]Index[/C][C]Actual[/C][C]Fitted[/C][C]Error[/C][/ROW]
[ROW][C]1[/C][C]1[/C][C]0.774059145096896[/C][C]0.225940854903104[/C][/ROW]
[ROW][C]2[/C][C]1[/C][C]0.892629153620521[/C][C]0.107370846379479[/C][/ROW]
[ROW][C]3[/C][C]0[/C][C]0.158913457955538[/C][C]-0.158913457955538[/C][/ROW]
[ROW][C]4[/C][C]1[/C][C]0.592952552852405[/C][C]0.407047447147595[/C][/ROW]
[ROW][C]5[/C][C]1[/C][C]0.875332863364028[/C][C]0.124667136635972[/C][/ROW]
[ROW][C]6[/C][C]1[/C][C]0.703369939526384[/C][C]0.296630060473616[/C][/ROW]
[ROW][C]7[/C][C]1[/C][C]0.805041473442075[/C][C]0.194958526557925[/C][/ROW]
[ROW][C]8[/C][C]0[/C][C]0.38316853561194[/C][C]-0.38316853561194[/C][/ROW]
[ROW][C]9[/C][C]1[/C][C]0.784564099433395[/C][C]0.215435900566605[/C][/ROW]
[ROW][C]10[/C][C]1[/C][C]0.765720952330357[/C][C]0.234279047669643[/C][/ROW]
[ROW][C]11[/C][C]1[/C][C]0.801755909942082[/C][C]0.198244090057918[/C][/ROW]
[ROW][C]12[/C][C]1[/C][C]0.833963795157928[/C][C]0.166036204842072[/C][/ROW]
[ROW][C]13[/C][C]1[/C][C]0.771575482701659[/C][C]0.228424517298341[/C][/ROW]
[ROW][C]14[/C][C]1[/C][C]0.771449356308386[/C][C]0.228550643691614[/C][/ROW]
[ROW][C]15[/C][C]1[/C][C]0.948256265599827[/C][C]0.0517437344001728[/C][/ROW]
[ROW][C]16[/C][C]1[/C][C]0.710663775563363[/C][C]0.289336224436637[/C][/ROW]
[ROW][C]17[/C][C]0[/C][C]0.346516285347282[/C][C]-0.346516285347282[/C][/ROW]
[ROW][C]18[/C][C]1[/C][C]0.882407013654834[/C][C]0.117592986345166[/C][/ROW]
[ROW][C]19[/C][C]1[/C][C]0.806693385860988[/C][C]0.193306614139012[/C][/ROW]
[ROW][C]20[/C][C]1[/C][C]0.846205360969803[/C][C]0.153794639030197[/C][/ROW]
[ROW][C]21[/C][C]0[/C][C]0.3337741770362[/C][C]-0.3337741770362[/C][/ROW]
[ROW][C]22[/C][C]0[/C][C]0.474582714710305[/C][C]-0.474582714710305[/C][/ROW]
[ROW][C]23[/C][C]1[/C][C]0.778795465696145[/C][C]0.221204534303855[/C][/ROW]
[ROW][C]24[/C][C]1[/C][C]0.84953960890083[/C][C]0.15046039109917[/C][/ROW]
[ROW][C]25[/C][C]0[/C][C]0.542846639902698[/C][C]-0.542846639902698[/C][/ROW]
[ROW][C]26[/C][C]0[/C][C]0.639138819923992[/C][C]-0.639138819923992[/C][/ROW]
[ROW][C]27[/C][C]1[/C][C]0.673988874042906[/C][C]0.326011125957094[/C][/ROW]
[ROW][C]28[/C][C]1[/C][C]0.53312173022074[/C][C]0.46687826977926[/C][/ROW]
[ROW][C]29[/C][C]1[/C][C]0.709565043420728[/C][C]0.290434956579272[/C][/ROW]
[ROW][C]30[/C][C]1[/C][C]0.892268753835051[/C][C]0.107731246164949[/C][/ROW]
[ROW][C]31[/C][C]1[/C][C]0.542846639902698[/C][C]0.457153360097302[/C][/ROW]
[ROW][C]32[/C][C]1[/C][C]0.639138819923992[/C][C]0.360861180076008[/C][/ROW]
[ROW][C]33[/C][C]1[/C][C]0.673988874042906[/C][C]0.326011125957094[/C][/ROW]
[ROW][C]34[/C][C]0[/C][C]0.53312173022074[/C][C]-0.53312173022074[/C][/ROW]
[ROW][C]35[/C][C]1[/C][C]0.709565043420728[/C][C]0.290434956579272[/C][/ROW]
[ROW][C]36[/C][C]1[/C][C]0.892268753835051[/C][C]0.107731246164949[/C][/ROW]
[ROW][C]37[/C][C]1[/C][C]0.548667791308756[/C][C]0.451332208691244[/C][/ROW]
[ROW][C]38[/C][C]1[/C][C]0.743244162972372[/C][C]0.256755837027628[/C][/ROW]
[ROW][C]39[/C][C]1[/C][C]0.704078911026509[/C][C]0.295921088973491[/C][/ROW]
[ROW][C]40[/C][C]1[/C][C]0.962070912226674[/C][C]0.037929087773326[/C][/ROW]
[ROW][C]41[/C][C]1[/C][C]0.911306527254152[/C][C]0.0886934727458484[/C][/ROW]
[ROW][C]42[/C][C]1[/C][C]0.895819642567856[/C][C]0.104180357432144[/C][/ROW]
[/TABLE]
Source: https://freestatistics.org/blog/index.php?pk=211375&T=3

Globally Unique Identifier (entire table): ba.freestatistics.org/blog/index.php?pk=211375&T=3

As an alternative you can also use a QR Code:  

The GUIDs for individual cells are displayed in the table below:

Fit of Logistic Regression
IndexActualFittedError
110.7740591450968960.225940854903104
210.8926291536205210.107370846379479
300.158913457955538-0.158913457955538
410.5929525528524050.407047447147595
510.8753328633640280.124667136635972
610.7033699395263840.296630060473616
710.8050414734420750.194958526557925
800.38316853561194-0.38316853561194
910.7845640994333950.215435900566605
1010.7657209523303570.234279047669643
1110.8017559099420820.198244090057918
1210.8339637951579280.166036204842072
1310.7715754827016590.228424517298341
1410.7714493563083860.228550643691614
1510.9482562655998270.0517437344001728
1610.7106637755633630.289336224436637
1700.346516285347282-0.346516285347282
1810.8824070136548340.117592986345166
1910.8066933858609880.193306614139012
2010.8462053609698030.153794639030197
2100.3337741770362-0.3337741770362
2200.474582714710305-0.474582714710305
2310.7787954656961450.221204534303855
2410.849539608900830.15046039109917
2500.542846639902698-0.542846639902698
2600.639138819923992-0.639138819923992
2710.6739888740429060.326011125957094
2810.533121730220740.46687826977926
2910.7095650434207280.290434956579272
3010.8922687538350510.107731246164949
3110.5428466399026980.457153360097302
3210.6391388199239920.360861180076008
3310.6739888740429060.326011125957094
3400.53312173022074-0.53312173022074
3510.7095650434207280.290434956579272
3610.8922687538350510.107731246164949
3710.5486677913087560.451332208691244
3810.7432441629723720.256755837027628
3910.7040789110265090.295921088973491
4010.9620709122266740.037929087773326
4110.9113065272541520.0886934727458484
4210.8958196425678560.104180357432144


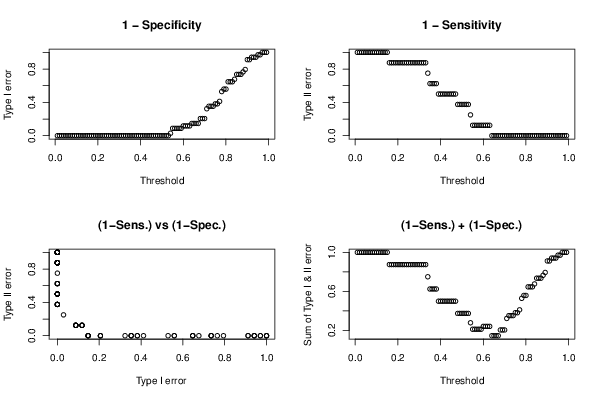
Type I & II errors for various threshold values
ThresholdType IType II
0.0101
0.0201
0.0301
0.0401
0.0501
0.0601
0.0701
0.0801
0.0901
0.101
0.1101
0.1201
0.1301
0.1401
0.1501
0.1600.875
0.1700.875
0.1800.875
0.1900.875
0.200.875
0.2100.875
0.2200.875
0.2300.875
0.2400.875
0.2500.875
0.2600.875
0.2700.875
0.2800.875
0.2900.875
0.300.875
0.3100.875
0.3200.875
0.3300.875
0.3400.75
0.3500.625
0.3600.625
0.3700.625
0.3800.625
0.3900.5
0.400.5
0.4100.5
0.4200.5
0.4300.5
0.4400.5
0.4500.5
0.4600.5
0.4700.5
0.4800.375
0.4900.375
0.500.375
0.5100.375
0.5200.375
0.5300.375
0.540.02941176470588240.25
0.550.08823529411764710.125
0.560.08823529411764710.125
0.570.08823529411764710.125
0.580.08823529411764710.125
0.590.08823529411764710.125
0.60.1176470588235290.125
0.610.1176470588235290.125
0.620.1176470588235290.125
0.630.1176470588235290.125
0.640.1470588235294120
0.650.1470588235294120
0.660.1470588235294120
0.670.1470588235294120
0.680.2058823529411760
0.690.2058823529411760
0.70.2058823529411760
0.710.3235294117647060
0.720.3529411764705880
0.730.3529411764705880
0.740.3529411764705880
0.750.3823529411764710
0.760.3823529411764710
0.770.4117647058823530
0.780.5294117647058820
0.790.5588235294117650
0.80.5588235294117650
0.810.6470588235294120
0.820.6470588235294120
0.830.6470588235294120
0.840.6764705882352940
0.850.7352941176470590
0.860.7352941176470590
0.870.7352941176470590
0.880.7647058823529410
0.890.7941176470588230
0.90.9117647058823530
0.910.9117647058823530
0.920.9411764705882350
0.930.9411764705882350
0.940.9411764705882350
0.950.9705882352941180
0.960.9705882352941180
0.9710
0.9810
0.9910

\begin{tabular}{lllllllll}
\hline
Type I & II errors for various threshold values \tabularnewline
Threshold & Type I & Type II \tabularnewline
0.01 & 0 & 1 \tabularnewline
0.02 & 0 & 1 \tabularnewline
0.03 & 0 & 1 \tabularnewline
0.04 & 0 & 1 \tabularnewline
0.05 & 0 & 1 \tabularnewline
0.06 & 0 & 1 \tabularnewline
0.07 & 0 & 1 \tabularnewline
0.08 & 0 & 1 \tabularnewline
0.09 & 0 & 1 \tabularnewline
0.1 & 0 & 1 \tabularnewline
0.11 & 0 & 1 \tabularnewline
0.12 & 0 & 1 \tabularnewline
0.13 & 0 & 1 \tabularnewline
0.14 & 0 & 1 \tabularnewline
0.15 & 0 & 1 \tabularnewline
0.16 & 0 & 0.875 \tabularnewline
0.17 & 0 & 0.875 \tabularnewline
0.18 & 0 & 0.875 \tabularnewline
0.19 & 0 & 0.875 \tabularnewline
0.2 & 0 & 0.875 \tabularnewline
0.21 & 0 & 0.875 \tabularnewline
0.22 & 0 & 0.875 \tabularnewline
0.23 & 0 & 0.875 \tabularnewline
0.24 & 0 & 0.875 \tabularnewline
0.25 & 0 & 0.875 \tabularnewline
0.26 & 0 & 0.875 \tabularnewline
0.27 & 0 & 0.875 \tabularnewline
0.28 & 0 & 0.875 \tabularnewline
0.29 & 0 & 0.875 \tabularnewline
0.3 & 0 & 0.875 \tabularnewline
0.31 & 0 & 0.875 \tabularnewline
0.32 & 0 & 0.875 \tabularnewline
0.33 & 0 & 0.875 \tabularnewline
0.34 & 0 & 0.75 \tabularnewline
0.35 & 0 & 0.625 \tabularnewline
0.36 & 0 & 0.625 \tabularnewline
0.37 & 0 & 0.625 \tabularnewline
0.38 & 0 & 0.625 \tabularnewline
0.39 & 0 & 0.5 \tabularnewline
0.4 & 0 & 0.5 \tabularnewline
0.41 & 0 & 0.5 \tabularnewline
0.42 & 0 & 0.5 \tabularnewline
0.43 & 0 & 0.5 \tabularnewline
0.44 & 0 & 0.5 \tabularnewline
0.45 & 0 & 0.5 \tabularnewline
0.46 & 0 & 0.5 \tabularnewline
0.47 & 0 & 0.5 \tabularnewline
0.48 & 0 & 0.375 \tabularnewline
0.49 & 0 & 0.375 \tabularnewline
0.5 & 0 & 0.375 \tabularnewline
0.51 & 0 & 0.375 \tabularnewline
0.52 & 0 & 0.375 \tabularnewline
0.53 & 0 & 0.375 \tabularnewline
0.54 & 0.0294117647058824 & 0.25 \tabularnewline
0.55 & 0.0882352941176471 & 0.125 \tabularnewline
0.56 & 0.0882352941176471 & 0.125 \tabularnewline
0.57 & 0.0882352941176471 & 0.125 \tabularnewline
0.58 & 0.0882352941176471 & 0.125 \tabularnewline
0.59 & 0.0882352941176471 & 0.125 \tabularnewline
0.6 & 0.117647058823529 & 0.125 \tabularnewline
0.61 & 0.117647058823529 & 0.125 \tabularnewline
0.62 & 0.117647058823529 & 0.125 \tabularnewline
0.63 & 0.117647058823529 & 0.125 \tabularnewline
0.64 & 0.147058823529412 & 0 \tabularnewline
0.65 & 0.147058823529412 & 0 \tabularnewline
0.66 & 0.147058823529412 & 0 \tabularnewline
0.67 & 0.147058823529412 & 0 \tabularnewline
0.68 & 0.205882352941176 & 0 \tabularnewline
0.69 & 0.205882352941176 & 0 \tabularnewline
0.7 & 0.205882352941176 & 0 \tabularnewline
0.71 & 0.323529411764706 & 0 \tabularnewline
0.72 & 0.352941176470588 & 0 \tabularnewline
0.73 & 0.352941176470588 & 0 \tabularnewline
0.74 & 0.352941176470588 & 0 \tabularnewline
0.75 & 0.382352941176471 & 0 \tabularnewline
0.76 & 0.382352941176471 & 0 \tabularnewline
0.77 & 0.411764705882353 & 0 \tabularnewline
0.78 & 0.529411764705882 & 0 \tabularnewline
0.79 & 0.558823529411765 & 0 \tabularnewline
0.8 & 0.558823529411765 & 0 \tabularnewline
0.81 & 0.647058823529412 & 0 \tabularnewline
0.82 & 0.647058823529412 & 0 \tabularnewline
0.83 & 0.647058823529412 & 0 \tabularnewline
0.84 & 0.676470588235294 & 0 \tabularnewline
0.85 & 0.735294117647059 & 0 \tabularnewline
0.86 & 0.735294117647059 & 0 \tabularnewline
0.87 & 0.735294117647059 & 0 \tabularnewline
0.88 & 0.764705882352941 & 0 \tabularnewline
0.89 & 0.794117647058823 & 0 \tabularnewline
0.9 & 0.911764705882353 & 0 \tabularnewline
0.91 & 0.911764705882353 & 0 \tabularnewline
0.92 & 0.941176470588235 & 0 \tabularnewline
0.93 & 0.941176470588235 & 0 \tabularnewline
0.94 & 0.941176470588235 & 0 \tabularnewline
0.95 & 0.970588235294118 & 0 \tabularnewline
0.96 & 0.970588235294118 & 0 \tabularnewline
0.97 & 1 & 0 \tabularnewline
0.98 & 1 & 0 \tabularnewline
0.99 & 1 & 0 \tabularnewline
\hline
\end{tabular}
%Source: https://freestatistics.org/blog/index.php?pk=211375&T=4

[TABLE]
[ROW][C]Type I & II errors for various threshold values[/C][/ROW]
[ROW][C]Threshold[/C][C]Type I[/C][C]Type II[/C][/ROW]
[ROW][C]0.01[/C][C]0[/C][C]1[/C][/ROW]
[ROW][C]0.02[/C][C]0[/C][C]1[/C][/ROW]
[ROW][C]0.03[/C][C]0[/C][C]1[/C][/ROW]
[ROW][C]0.04[/C][C]0[/C][C]1[/C][/ROW]
[ROW][C]0.05[/C][C]0[/C][C]1[/C][/ROW]
[ROW][C]0.06[/C][C]0[/C][C]1[/C][/ROW]
[ROW][C]0.07[/C][C]0[/C][C]1[/C][/ROW]
[ROW][C]0.08[/C][C]0[/C][C]1[/C][/ROW]
[ROW][C]0.09[/C][C]0[/C][C]1[/C][/ROW]
[ROW][C]0.1[/C][C]0[/C][C]1[/C][/ROW]
[ROW][C]0.11[/C][C]0[/C][C]1[/C][/ROW]
[ROW][C]0.12[/C][C]0[/C][C]1[/C][/ROW]
[ROW][C]0.13[/C][C]0[/C][C]1[/C][/ROW]
[ROW][C]0.14[/C][C]0[/C][C]1[/C][/ROW]
[ROW][C]0.15[/C][C]0[/C][C]1[/C][/ROW]
[ROW][C]0.16[/C][C]0[/C][C]0.875[/C][/ROW]
[ROW][C]0.17[/C][C]0[/C][C]0.875[/C][/ROW]
[ROW][C]0.18[/C][C]0[/C][C]0.875[/C][/ROW]
[ROW][C]0.19[/C][C]0[/C][C]0.875[/C][/ROW]
[ROW][C]0.2[/C][C]0[/C][C]0.875[/C][/ROW]
[ROW][C]0.21[/C][C]0[/C][C]0.875[/C][/ROW]
[ROW][C]0.22[/C][C]0[/C][C]0.875[/C][/ROW]
[ROW][C]0.23[/C][C]0[/C][C]0.875[/C][/ROW]
[ROW][C]0.24[/C][C]0[/C][C]0.875[/C][/ROW]
[ROW][C]0.25[/C][C]0[/C][C]0.875[/C][/ROW]
[ROW][C]0.26[/C][C]0[/C][C]0.875[/C][/ROW]
[ROW][C]0.27[/C][C]0[/C][C]0.875[/C][/ROW]
[ROW][C]0.28[/C][C]0[/C][C]0.875[/C][/ROW]
[ROW][C]0.29[/C][C]0[/C][C]0.875[/C][/ROW]
[ROW][C]0.3[/C][C]0[/C][C]0.875[/C][/ROW]
[ROW][C]0.31[/C][C]0[/C][C]0.875[/C][/ROW]
[ROW][C]0.32[/C][C]0[/C][C]0.875[/C][/ROW]
[ROW][C]0.33[/C][C]0[/C][C]0.875[/C][/ROW]
[ROW][C]0.34[/C][C]0[/C][C]0.75[/C][/ROW]
[ROW][C]0.35[/C][C]0[/C][C]0.625[/C][/ROW]
[ROW][C]0.36[/C][C]0[/C][C]0.625[/C][/ROW]
[ROW][C]0.37[/C][C]0[/C][C]0.625[/C][/ROW]
[ROW][C]0.38[/C][C]0[/C][C]0.625[/C][/ROW]
[ROW][C]0.39[/C][C]0[/C][C]0.5[/C][/ROW]
[ROW][C]0.4[/C][C]0[/C][C]0.5[/C][/ROW]
[ROW][C]0.41[/C][C]0[/C][C]0.5[/C][/ROW]
[ROW][C]0.42[/C][C]0[/C][C]0.5[/C][/ROW]
[ROW][C]0.43[/C][C]0[/C][C]0.5[/C][/ROW]
[ROW][C]0.44[/C][C]0[/C][C]0.5[/C][/ROW]
[ROW][C]0.45[/C][C]0[/C][C]0.5[/C][/ROW]
[ROW][C]0.46[/C][C]0[/C][C]0.5[/C][/ROW]
[ROW][C]0.47[/C][C]0[/C][C]0.5[/C][/ROW]
[ROW][C]0.48[/C][C]0[/C][C]0.375[/C][/ROW]
[ROW][C]0.49[/C][C]0[/C][C]0.375[/C][/ROW]
[ROW][C]0.5[/C][C]0[/C][C]0.375[/C][/ROW]
[ROW][C]0.51[/C][C]0[/C][C]0.375[/C][/ROW]
[ROW][C]0.52[/C][C]0[/C][C]0.375[/C][/ROW]
[ROW][C]0.53[/C][C]0[/C][C]0.375[/C][/ROW]
[ROW][C]0.54[/C][C]0.0294117647058824[/C][C]0.25[/C][/ROW]
[ROW][C]0.55[/C][C]0.0882352941176471[/C][C]0.125[/C][/ROW]
[ROW][C]0.56[/C][C]0.0882352941176471[/C][C]0.125[/C][/ROW]
[ROW][C]0.57[/C][C]0.0882352941176471[/C][C]0.125[/C][/ROW]
[ROW][C]0.58[/C][C]0.0882352941176471[/C][C]0.125[/C][/ROW]
[ROW][C]0.59[/C][C]0.0882352941176471[/C][C]0.125[/C][/ROW]
[ROW][C]0.6[/C][C]0.117647058823529[/C][C]0.125[/C][/ROW]
[ROW][C]0.61[/C][C]0.117647058823529[/C][C]0.125[/C][/ROW]
[ROW][C]0.62[/C][C]0.117647058823529[/C][C]0.125[/C][/ROW]
[ROW][C]0.63[/C][C]0.117647058823529[/C][C]0.125[/C][/ROW]
[ROW][C]0.64[/C][C]0.147058823529412[/C][C]0[/C][/ROW]
[ROW][C]0.65[/C][C]0.147058823529412[/C][C]0[/C][/ROW]
[ROW][C]0.66[/C][C]0.147058823529412[/C][C]0[/C][/ROW]
[ROW][C]0.67[/C][C]0.147058823529412[/C][C]0[/C][/ROW]
[ROW][C]0.68[/C][C]0.205882352941176[/C][C]0[/C][/ROW]
[ROW][C]0.69[/C][C]0.205882352941176[/C][C]0[/C][/ROW]
[ROW][C]0.7[/C][C]0.205882352941176[/C][C]0[/C][/ROW]
[ROW][C]0.71[/C][C]0.323529411764706[/C][C]0[/C][/ROW]
[ROW][C]0.72[/C][C]0.352941176470588[/C][C]0[/C][/ROW]
[ROW][C]0.73[/C][C]0.352941176470588[/C][C]0[/C][/ROW]
[ROW][C]0.74[/C][C]0.352941176470588[/C][C]0[/C][/ROW]
[ROW][C]0.75[/C][C]0.382352941176471[/C][C]0[/C][/ROW]
[ROW][C]0.76[/C][C]0.382352941176471[/C][C]0[/C][/ROW]
[ROW][C]0.77[/C][C]0.411764705882353[/C][C]0[/C][/ROW]
[ROW][C]0.78[/C][C]0.529411764705882[/C][C]0[/C][/ROW]
[ROW][C]0.79[/C][C]0.558823529411765[/C][C]0[/C][/ROW]
[ROW][C]0.8[/C][C]0.558823529411765[/C][C]0[/C][/ROW]
[ROW][C]0.81[/C][C]0.647058823529412[/C][C]0[/C][/ROW]
[ROW][C]0.82[/C][C]0.647058823529412[/C][C]0[/C][/ROW]
[ROW][C]0.83[/C][C]0.647058823529412[/C][C]0[/C][/ROW]
[ROW][C]0.84[/C][C]0.676470588235294[/C][C]0[/C][/ROW]
[ROW][C]0.85[/C][C]0.735294117647059[/C][C]0[/C][/ROW]
[ROW][C]0.86[/C][C]0.735294117647059[/C][C]0[/C][/ROW]
[ROW][C]0.87[/C][C]0.735294117647059[/C][C]0[/C][/ROW]
[ROW][C]0.88[/C][C]0.764705882352941[/C][C]0[/C][/ROW]
[ROW][C]0.89[/C][C]0.794117647058823[/C][C]0[/C][/ROW]
[ROW][C]0.9[/C][C]0.911764705882353[/C][C]0[/C][/ROW]
[ROW][C]0.91[/C][C]0.911764705882353[/C][C]0[/C][/ROW]
[ROW][C]0.92[/C][C]0.941176470588235[/C][C]0[/C][/ROW]
[ROW][C]0.93[/C][C]0.941176470588235[/C][C]0[/C][/ROW]
[ROW][C]0.94[/C][C]0.941176470588235[/C][C]0[/C][/ROW]
[ROW][C]0.95[/C][C]0.970588235294118[/C][C]0[/C][/ROW]
[ROW][C]0.96[/C][C]0.970588235294118[/C][C]0[/C][/ROW]
[ROW][C]0.97[/C][C]1[/C][C]0[/C][/ROW]
[ROW][C]0.98[/C][C]1[/C][C]0[/C][/ROW]
[ROW][C]0.99[/C][C]1[/C][C]0[/C][/ROW]
[/TABLE]
Source: https://freestatistics.org/blog/index.php?pk=211375&T=4

Globally Unique Identifier (entire table): ba.freestatistics.org/blog/index.php?pk=211375&T=4

As an alternative you can also use a QR Code:  

The GUIDs for individual cells are displayed in the table below:

Type I & II errors for various threshold values
ThresholdType IType II
0.0101
0.0201
0.0301
0.0401
0.0501
0.0601
0.0701
0.0801
0.0901
0.101
0.1101
0.1201
0.1301
0.1401
0.1501
0.1600.875
0.1700.875
0.1800.875
0.1900.875
0.200.875
0.2100.875
0.2200.875
0.2300.875
0.2400.875
0.2500.875
0.2600.875
0.2700.875
0.2800.875
0.2900.875
0.300.875
0.3100.875
0.3200.875
0.3300.875
0.3400.75
0.3500.625
0.3600.625
0.3700.625
0.3800.625
0.3900.5
0.400.5
0.4100.5
0.4200.5
0.4300.5
0.4400.5
0.4500.5
0.4600.5
0.4700.5
0.4800.375
0.4900.375
0.500.375
0.5100.375
0.5200.375
0.5300.375
0.540.02941176470588240.25
0.550.08823529411764710.125
0.560.08823529411764710.125
0.570.08823529411764710.125
0.580.08823529411764710.125
0.590.08823529411764710.125
0.60.1176470588235290.125
0.610.1176470588235290.125
0.620.1176470588235290.125
0.630.1176470588235290.125
0.640.1470588235294120
0.650.1470588235294120
0.660.1470588235294120
0.670.1470588235294120
0.680.2058823529411760
0.690.2058823529411760
0.70.2058823529411760
0.710.3235294117647060
0.720.3529411764705880
0.730.3529411764705880
0.740.3529411764705880
0.750.3823529411764710
0.760.3823529411764710
0.770.4117647058823530
0.780.5294117647058820
0.790.5588235294117650
0.80.5588235294117650
0.810.6470588235294120
0.820.6470588235294120
0.830.6470588235294120
0.840.6764705882352940
0.850.7352941176470590
0.860.7352941176470590
0.870.7352941176470590
0.880.7647058823529410
0.890.7941176470588230
0.90.9117647058823530
0.910.9117647058823530
0.920.9411764705882350
0.930.9411764705882350
0.940.9411764705882350
0.950.9705882352941180
0.960.9705882352941180
0.9710
0.9810
0.9910


Parameters (Session):
Parameters (R input):
R code (references can be found in the software module):
library(brglm)
roc.plot <- function (sd, sdc, newplot = TRUE, ...)
{
sall <- sort(c(sd, sdc))
sens <- 0
specc <- 0
for (i in length(sall):1) {
sens <- c(sens, mean(sd >= sall[i], na.rm = T))
specc <- c(specc, mean(sdc >= sall[i], na.rm = T))
}
if (newplot) {
plot(specc, sens, xlim = c(0, 1), ylim = c(0, 1), type = 'l',
xlab = '1-specificity', ylab = 'sensitivity', main = 'ROC plot', ...)
abline(0, 1)
}
else lines(specc, sens, ...)
npoints <- length(sens)
area <- sum(0.5 * (sens[-1] + sens[-npoints]) * (specc[-1] -
specc[-npoints]))
lift <- (sens - specc)[-1]
cutoff <- sall[lift == max(lift)][1]
sensopt <- sens[-1][lift == max(lift)][1]
specopt <- 1 - specc[-1][lift == max(lift)][1]
list(area = area, cutoff = cutoff, sensopt = sensopt, specopt = specopt)
}
roc.analysis <- function (object, newdata = NULL, newplot = TRUE, ...)
{
if (is.null(newdata)) {
sd <- object$fitted[object$y == 1]
sdc <- object$fitted[object$y == 0]
}
else {
sd <- predict(object, newdata, type = 'response')[newdata$y ==
1]
sdc <- predict(object, newdata, type = 'response')[newdata$y ==
0]
}
roc.plot(sd, sdc, newplot, ...)
}
hosmerlem <- function (y, yhat, g = 10)
{
cutyhat <- cut(yhat, breaks = quantile(yhat, probs = seq(0,
1, 1/g)), include.lowest = T)
obs <- xtabs(cbind(1 - y, y) ~ cutyhat)
expect <- xtabs(cbind(1 - yhat, yhat) ~ cutyhat)
chisq <- sum((obs - expect)^2/expect)
P <- 1 - pchisq(chisq, g - 2)
c('X^2' = chisq, Df = g - 2, 'P(>Chi)' = P)
}
x <- as.data.frame(t(y))
r <- brglm(x)
summary(r)
rc <- summary(r)$coeff
try(hm <- hosmerlem(y[1,],r$fitted.values),silent=T)
try(hm,silent=T)
bitmap(file='test0.png')
ra <- roc.analysis(r)
dev.off()
te <- array(0,dim=c(2,99))
for (i in 1:99) {
threshold <- i / 100
numcorr1 <- 0
numfaul1 <- 0
numcorr0 <- 0
numfaul0 <- 0
for (j in 1:length(r$fitted.values)) {
if (y[1,j] > 0.99) {
if (r$fitted.values[j] >= threshold) numcorr1 = numcorr1 + 1 else numfaul1 = numfaul1 + 1
} else {
if (r$fitted.values[j] < threshold) numcorr0 = numcorr0 + 1 else numfaul0 = numfaul0 + 1
}
}
te[1,i] <- numfaul1 / (numfaul1 + numcorr1)
te[2,i] <- numfaul0 / (numfaul0 + numcorr0)
}
bitmap(file='test1.png')
op <- par(mfrow=c(2,2))
plot((1:99)/100,te[1,],xlab='Threshold',ylab='Type I error', main='1 - Specificity')
plot((1:99)/100,te[2,],xlab='Threshold',ylab='Type II error', main='1 - Sensitivity')
plot(te[1,],te[2,],xlab='Type I error',ylab='Type II error', main='(1-Sens.) vs (1-Spec.)')
plot((1:99)/100,te[1,]+te[2,],xlab='Threshold',ylab='Sum of Type I & II error', main='(1-Sens.) + (1-Spec.)')
par(op)
dev.off()
load(file='createtable')
a<-table.start()
a<-table.row.start(a)
a<-table.element(a,'Coefficients of Bias-Reduced Logistic Regression',5,TRUE)
a<-table.row.end(a)
a<-table.row.start(a)
a<-table.element(a,'Variable',header=TRUE)
a<-table.element(a,'Parameter',header=TRUE)
a<-table.element(a,'S.E.',header=TRUE)
a<-table.element(a,'t-stat',header=TRUE)
a<-table.element(a,'2-sided p-value',header=TRUE)
a<-table.row.end(a)
for (i in 1:length(rc[,1])) {
a<-table.row.start(a)
a<-table.element(a,labels(rc)[[1]][i],header=TRUE)
a<-table.element(a,rc[i,1])
a<-table.element(a,rc[i,2])
a<-table.element(a,rc[i,3])
a<-table.element(a,2*(1-pt(abs(rc[i,3]),r$df.residual)))
a<-table.row.end(a)
}
a<-table.end(a)
table.save(a,file='mytable.tab')
a<-table.start()
a<-table.row.start(a)
a<-table.element(a,'Summary of Bias-Reduced Logistic Regression',2,TRUE)
a<-table.row.end(a)
a<-table.row.start(a)
a<-table.element(a,'Deviance',1,TRUE)
a<-table.element(a,r$deviance)
a<-table.row.end(a)
a<-table.row.start(a)
a<-table.element(a,'Penalized deviance',1,TRUE)
a<-table.element(a,r$penalized.deviance)
a<-table.row.end(a)
a<-table.row.start(a)
a<-table.element(a,'Residual Degrees of Freedom',1,TRUE)
a<-table.element(a,r$df.residual)
a<-table.row.end(a)
a<-table.row.start(a)
a<-table.element(a,'ROC Area',1,TRUE)
a<-table.element(a,ra$area)
a<-table.row.end(a)
a<-table.row.start(a)
a<-table.element(a,'Hosmer–Lemeshow test',2,TRUE)
a<-table.row.end(a)
a<-table.row.start(a)
a<-table.element(a,'Chi-square',1,TRUE)
phm <- array('NA',dim=3)
for (i in 1:3) { try(phm[i] <- hm[i],silent=T) }
a<-table.element(a,phm[1])
a<-table.row.end(a)
a<-table.row.start(a)
a<-table.element(a,'Degrees of Freedom',1,TRUE)
a<-table.element(a,phm[2])
a<-table.row.end(a)
a<-table.row.start(a)
a<-table.element(a,'P(>Chi)',1,TRUE)
a<-table.element(a,phm[3])
a<-table.row.end(a)
a<-table.end(a)
table.save(a,file='mytable1.tab')
a<-table.start()
a<-table.row.start(a)
a<-table.element(a,'Fit of Logistic Regression',4,TRUE)
a<-table.row.end(a)
a<-table.row.start(a)
a<-table.element(a,'Index',1,TRUE)
a<-table.element(a,'Actual',1,TRUE)
a<-table.element(a,'Fitted',1,TRUE)
a<-table.element(a,'Error',1,TRUE)
a<-table.row.end(a)
for (i in 1:length(r$fitted.values)) {
a<-table.row.start(a)
a<-table.element(a,i,1,TRUE)
a<-table.element(a,y[1,i])
a<-table.element(a,r$fitted.values[i])
a<-table.element(a,y[1,i]-r$fitted.values[i])
a<-table.row.end(a)
}
a<-table.end(a)
table.save(a,file='mytable2.tab')
a<-table.start()
a<-table.row.start(a)
a<-table.element(a,'Type I & II errors for various threshold values',3,TRUE)
a<-table.row.end(a)
a<-table.row.start(a)
a<-table.element(a,'Threshold',1,TRUE)
a<-table.element(a,'Type I',1,TRUE)
a<-table.element(a,'Type II',1,TRUE)
a<-table.row.end(a)
for (i in 1:99) {
a<-table.row.start(a)
a<-table.element(a,i/100,1,TRUE)
a<-table.element(a,te[1,i])
a<-table.element(a,te[2,i])
a<-table.row.end(a)
}
a<-table.end(a)
table.save(a,file='mytable3.tab')