Free Statistics

of Irreproducible Research!

Author's title

Author*Unverified author*
R Software Modulerwasp_centraltendency.wasp
Title produced by softwareCentral Tendency
Date of computationThu, 20 Feb 2014 12:09:45 -0500
Cite this page as followsStatistical Computations at FreeStatistics.org, Office for Research Development and Education, URL https://freestatistics.org/blog/index.php?v=date/2014/Feb/20/t1392916222cxtvjvtko2luzjw.htm/, Retrieved Thu, 16 May 2024 13:23:59 +0000
Statistical Computations at FreeStatistics.org, Office for Research Development and Education, URL https://freestatistics.org/blog/index.php?pk=233944, Retrieved Thu, 16 May 2024 13:23:59 +0000
QR Codes:

Original text written by user:
IsPrivate?No (this computation is public)
User-defined keywords
Estimated Impact106
Family? (F = Feedback message, R = changed R code, M = changed R Module, P = changed Parameters, D = changed Data)
-       [Central Tendency] [] [2014-02-20 17:09:45] [7373f181761c5c20212e36e73239e9d6] [Current]
Feedback Forum

Post a new message
Dataseries X:
449
446
447
451
465
460
433
431
437
442
449
450
435
431
434
439
455
452
426
428
433
438
442
446
442
436
444
454
469
471
443
437
444
451
457
460
454
439
441
446
459
456
433
424
430
428
424
419
409
397
397
401
413
413
390
385
397
398
406
412
409
404
412
418
434
431
406
416
424
427
438
444
442
443
453
471
476
476
461
462
460
463
467
468


Summary of computational transaction
Raw Inputview raw input (R code)
Raw Outputview raw output of R engine
Computing time2 seconds
R Server'Herman Ole Andreas Wold' @ wold.wessa.net

\begin{tabular}{lllllllll}
\hline
Summary of computational transaction \tabularnewline
Raw Input & view raw input (R code)  \tabularnewline
Raw Output & view raw output of R engine  \tabularnewline
Computing time & 2 seconds \tabularnewline
R Server & 'Herman Ole Andreas Wold' @ wold.wessa.net \tabularnewline
\hline
\end{tabular}
%Source: https://freestatistics.org/blog/index.php?pk=233944&T=0

[TABLE]
[ROW][C]Summary of computational transaction[/C][/ROW]
[ROW][C]Raw Input[/C][C]view raw input (R code) [/C][/ROW]
[ROW][C]Raw Output[/C][C]view raw output of R engine [/C][/ROW]
[ROW][C]Computing time[/C][C]2 seconds[/C][/ROW]
[ROW][C]R Server[/C][C]'Herman Ole Andreas Wold' @ wold.wessa.net[/C][/ROW]
[/TABLE]
Source: https://freestatistics.org/blog/index.php?pk=233944&T=0

Globally Unique Identifier (entire table): ba.freestatistics.org/blog/index.php?pk=233944&T=0

As an alternative you can also use a QR Code:  

The GUIDs for individual cells are displayed in the table below:

Summary of computational transaction
Raw Inputview raw input (R code)
Raw Outputview raw output of R engine
Computing time2 seconds
R Server'Herman Ole Andreas Wold' @ wold.wessa.net


Central Tendency - Ungrouped Data
MeasureValueS.E.Value/S.E.
Arithmetic Mean436.9404761904762.34706339818247186.1647523151
Geometric Mean436.409517321811
Harmonic Mean435.870769770154
Quadratic Mean437.463372616442
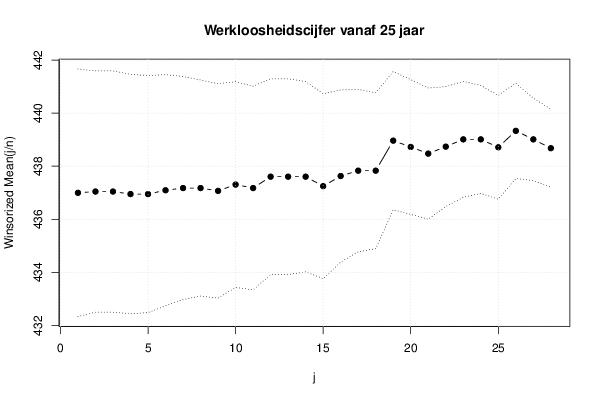
Winsorized Mean ( 1 / 28 )4372.33189858356149187.400945770366
Winsorized Mean ( 2 / 28 )437.0476190476192.27119359726443192.430808000703
Winsorized Mean ( 3 / 28 )437.0476190476192.27119359726443192.430808000703
Winsorized Mean ( 4 / 28 )436.9523809523812.25445977095106193.816889785551
Winsorized Mean ( 5 / 28 )436.9523809523812.23176005514656195.788243429102
Winsorized Mean ( 6 / 28 )437.0952380952382.17590064493842200.880145475396
Winsorized Mean ( 7 / 28 )437.1785714285712.09999321873381208.180944361415
Winsorized Mean ( 8 / 28 )437.1785714285712.03449601698092214.882982212627
Winsorized Mean ( 9 / 28 )437.0714285714292.01833148786775216.550864512929
Winsorized Mean ( 10 / 28 )437.3095238095241.93608249577057225.873393703439
Winsorized Mean ( 11 / 28 )437.1785714285711.91703723482144228.049076714617
Winsorized Mean ( 12 / 28 )437.6071428571431.84317894471592237.419781791501
Winsorized Mean ( 13 / 28 )437.6071428571431.84317894471592237.419781791501
Winsorized Mean ( 14 / 28 )437.6071428571431.79124359096237244.303535859147
Winsorized Mean ( 15 / 28 )437.251.74112576595557251.130623961577
Winsorized Mean ( 16 / 28 )437.6309523809521.6211613172694269.949046846291
Winsorized Mean ( 17 / 28 )437.8333333333331.52948017948259286.262835705035
Winsorized Mean ( 18 / 28 )437.8333333333331.46745467278422298.362424034964
Winsorized Mean ( 19 / 28 )438.9642857142861.30111457897099337.375579990387
Winsorized Mean ( 20 / 28 )438.726190476191.26839321181599345.891310667024
Winsorized Mean ( 21 / 28 )438.476190476191.23494678896104355.056747704152
Winsorized Mean ( 22 / 28 )438.7380952380951.12782049668979389.01411751765
Winsorized Mean ( 23 / 28 )439.0119047619051.09102293839294402.385586327419
Winsorized Mean ( 24 / 28 )439.0119047619051.01586582562836432.155402501463
Winsorized Mean ( 25 / 28 )438.7142857142860.977599280088794448.766989348067
Winsorized Mean ( 26 / 28 )439.3333333333330.897873648855795489.304184272695
Winsorized Mean ( 27 / 28 )439.0119047619050.776057021215311565.695422836854
Winsorized Mean ( 28 / 28 )438.6785714285710.735377772858299596.534988708587
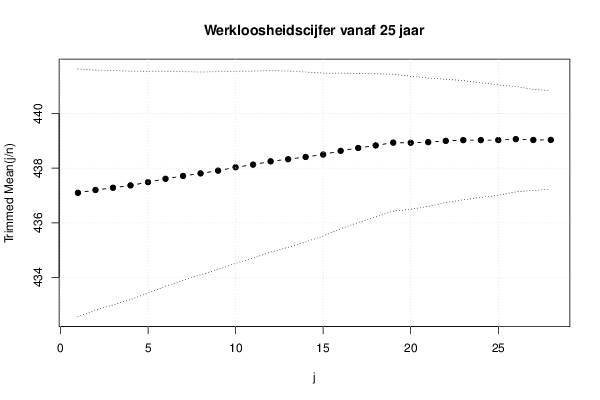
Trimmed Mean ( 1 / 28 )437.097560975612.26852902901076192.678848445777
Trimmed Mean ( 2 / 28 )437.22.1949597037909199.183611090862
Trimmed Mean ( 3 / 28 )437.2820512820512.14717383006344203.654704225382
Trimmed Mean ( 4 / 28 )437.3684210526322.09132226327371209.1348754486
Trimmed Mean ( 5 / 28 )437.4864864864872.03170384823477215.329850788339
Trimmed Mean ( 6 / 28 )437.6111111111111.96840811292873222.317266544895
Trimmed Mean ( 7 / 28 )437.7142857142861.90902215081855229.287169625875
Trimmed Mean ( 8 / 28 )437.8088235294121.85755432130606235.690993532607
Trimmed Mean ( 9 / 28 )437.9090909090911.81122211091599241.775477601489
Trimmed Mean ( 10 / 28 )438.031251.75890150349812249.036827320256
Trimmed Mean ( 11 / 28 )438.1290322580651.71340005601903255.707375938826
Trimmed Mean ( 12 / 28 )438.251.66173705997585263.730051255142
Trimmed Mean ( 13 / 28 )438.3275862068971.61406175860077271.56803875143
Trimmed Mean ( 14 / 28 )438.4107142857141.55521259784307281.897609943327
Trimmed Mean ( 15 / 28 )438.51.49299552558372293.704831987731
Trimmed Mean ( 16 / 28 )438.6346153846151.42511115868049307.789755706317
Trimmed Mean ( 17 / 28 )438.741.36600415333877321.184967796501
Trimmed Mean ( 18 / 28 )438.8333333333331.31087017460052334.764907949076
Trimmed Mean ( 19 / 28 )438.9347826086961.25355616810044350.151667534635
Trimmed Mean ( 20 / 28 )438.9318181818181.21712486885163360.63006304025
Trimmed Mean ( 21 / 28 )438.9523809523811.17610371764081373.225910579462
Trimmed Mean ( 22 / 28 )4391.1288750924522388.882705389823
Trimmed Mean ( 23 / 28 )439.0263157894741.09146882001801402.23440902529
Trimmed Mean ( 24 / 28 )439.0277777777781.04917663190631418.449824773625
Trimmed Mean ( 25 / 28 )439.0294117647061.01018458463806434.603159106814
Trimmed Mean ( 26 / 28 )439.06250.96505212545163454.962471373787
Trimmed Mean ( 27 / 28 )439.0333333333330.924112912110583475.086244959639
Trimmed Mean ( 28 / 28 )439.0357142857140.90191175974892486.783445874944
Median439
Midrange430.5
Midmean - Weighted Average at Xnp438.272727272727
Midmean - Weighted Average at X(n+1)p438.272727272727
Midmean - Empirical Distribution Function438.272727272727
Midmean - Empirical Distribution Function - Averaging438.272727272727
Midmean - Empirical Distribution Function - Interpolation438.272727272727
Midmean - Closest Observation438.272727272727
Midmean - True Basic - Statistics Graphics Toolkit438.272727272727
Midmean - MS Excel (old versions)438.6
Number of observations84

\begin{tabular}{lllllllll}
\hline
Central Tendency - Ungrouped Data \tabularnewline
Measure & Value & S.E. & Value/S.E. \tabularnewline
Arithmetic Mean & 436.940476190476 & 2.34706339818247 & 186.1647523151 \tabularnewline
Geometric Mean & 436.409517321811 &  &  \tabularnewline
Harmonic Mean & 435.870769770154 &  &  \tabularnewline
Quadratic Mean & 437.463372616442 &  &  \tabularnewline
Winsorized Mean ( 1 / 28 ) & 437 & 2.33189858356149 & 187.400945770366 \tabularnewline
Winsorized Mean ( 2 / 28 ) & 437.047619047619 & 2.27119359726443 & 192.430808000703 \tabularnewline
Winsorized Mean ( 3 / 28 ) & 437.047619047619 & 2.27119359726443 & 192.430808000703 \tabularnewline
Winsorized Mean ( 4 / 28 ) & 436.952380952381 & 2.25445977095106 & 193.816889785551 \tabularnewline
Winsorized Mean ( 5 / 28 ) & 436.952380952381 & 2.23176005514656 & 195.788243429102 \tabularnewline
Winsorized Mean ( 6 / 28 ) & 437.095238095238 & 2.17590064493842 & 200.880145475396 \tabularnewline
Winsorized Mean ( 7 / 28 ) & 437.178571428571 & 2.09999321873381 & 208.180944361415 \tabularnewline
Winsorized Mean ( 8 / 28 ) & 437.178571428571 & 2.03449601698092 & 214.882982212627 \tabularnewline
Winsorized Mean ( 9 / 28 ) & 437.071428571429 & 2.01833148786775 & 216.550864512929 \tabularnewline
Winsorized Mean ( 10 / 28 ) & 437.309523809524 & 1.93608249577057 & 225.873393703439 \tabularnewline
Winsorized Mean ( 11 / 28 ) & 437.178571428571 & 1.91703723482144 & 228.049076714617 \tabularnewline
Winsorized Mean ( 12 / 28 ) & 437.607142857143 & 1.84317894471592 & 237.419781791501 \tabularnewline
Winsorized Mean ( 13 / 28 ) & 437.607142857143 & 1.84317894471592 & 237.419781791501 \tabularnewline
Winsorized Mean ( 14 / 28 ) & 437.607142857143 & 1.79124359096237 & 244.303535859147 \tabularnewline
Winsorized Mean ( 15 / 28 ) & 437.25 & 1.74112576595557 & 251.130623961577 \tabularnewline
Winsorized Mean ( 16 / 28 ) & 437.630952380952 & 1.6211613172694 & 269.949046846291 \tabularnewline
Winsorized Mean ( 17 / 28 ) & 437.833333333333 & 1.52948017948259 & 286.262835705035 \tabularnewline
Winsorized Mean ( 18 / 28 ) & 437.833333333333 & 1.46745467278422 & 298.362424034964 \tabularnewline
Winsorized Mean ( 19 / 28 ) & 438.964285714286 & 1.30111457897099 & 337.375579990387 \tabularnewline
Winsorized Mean ( 20 / 28 ) & 438.72619047619 & 1.26839321181599 & 345.891310667024 \tabularnewline
Winsorized Mean ( 21 / 28 ) & 438.47619047619 & 1.23494678896104 & 355.056747704152 \tabularnewline
Winsorized Mean ( 22 / 28 ) & 438.738095238095 & 1.12782049668979 & 389.01411751765 \tabularnewline
Winsorized Mean ( 23 / 28 ) & 439.011904761905 & 1.09102293839294 & 402.385586327419 \tabularnewline
Winsorized Mean ( 24 / 28 ) & 439.011904761905 & 1.01586582562836 & 432.155402501463 \tabularnewline
Winsorized Mean ( 25 / 28 ) & 438.714285714286 & 0.977599280088794 & 448.766989348067 \tabularnewline
Winsorized Mean ( 26 / 28 ) & 439.333333333333 & 0.897873648855795 & 489.304184272695 \tabularnewline
Winsorized Mean ( 27 / 28 ) & 439.011904761905 & 0.776057021215311 & 565.695422836854 \tabularnewline
Winsorized Mean ( 28 / 28 ) & 438.678571428571 & 0.735377772858299 & 596.534988708587 \tabularnewline
Trimmed Mean ( 1 / 28 ) & 437.09756097561 & 2.26852902901076 & 192.678848445777 \tabularnewline
Trimmed Mean ( 2 / 28 ) & 437.2 & 2.1949597037909 & 199.183611090862 \tabularnewline
Trimmed Mean ( 3 / 28 ) & 437.282051282051 & 2.14717383006344 & 203.654704225382 \tabularnewline
Trimmed Mean ( 4 / 28 ) & 437.368421052632 & 2.09132226327371 & 209.1348754486 \tabularnewline
Trimmed Mean ( 5 / 28 ) & 437.486486486487 & 2.03170384823477 & 215.329850788339 \tabularnewline
Trimmed Mean ( 6 / 28 ) & 437.611111111111 & 1.96840811292873 & 222.317266544895 \tabularnewline
Trimmed Mean ( 7 / 28 ) & 437.714285714286 & 1.90902215081855 & 229.287169625875 \tabularnewline
Trimmed Mean ( 8 / 28 ) & 437.808823529412 & 1.85755432130606 & 235.690993532607 \tabularnewline
Trimmed Mean ( 9 / 28 ) & 437.909090909091 & 1.81122211091599 & 241.775477601489 \tabularnewline
Trimmed Mean ( 10 / 28 ) & 438.03125 & 1.75890150349812 & 249.036827320256 \tabularnewline
Trimmed Mean ( 11 / 28 ) & 438.129032258065 & 1.71340005601903 & 255.707375938826 \tabularnewline
Trimmed Mean ( 12 / 28 ) & 438.25 & 1.66173705997585 & 263.730051255142 \tabularnewline
Trimmed Mean ( 13 / 28 ) & 438.327586206897 & 1.61406175860077 & 271.56803875143 \tabularnewline
Trimmed Mean ( 14 / 28 ) & 438.410714285714 & 1.55521259784307 & 281.897609943327 \tabularnewline
Trimmed Mean ( 15 / 28 ) & 438.5 & 1.49299552558372 & 293.704831987731 \tabularnewline
Trimmed Mean ( 16 / 28 ) & 438.634615384615 & 1.42511115868049 & 307.789755706317 \tabularnewline
Trimmed Mean ( 17 / 28 ) & 438.74 & 1.36600415333877 & 321.184967796501 \tabularnewline
Trimmed Mean ( 18 / 28 ) & 438.833333333333 & 1.31087017460052 & 334.764907949076 \tabularnewline
Trimmed Mean ( 19 / 28 ) & 438.934782608696 & 1.25355616810044 & 350.151667534635 \tabularnewline
Trimmed Mean ( 20 / 28 ) & 438.931818181818 & 1.21712486885163 & 360.63006304025 \tabularnewline
Trimmed Mean ( 21 / 28 ) & 438.952380952381 & 1.17610371764081 & 373.225910579462 \tabularnewline
Trimmed Mean ( 22 / 28 ) & 439 & 1.1288750924522 & 388.882705389823 \tabularnewline
Trimmed Mean ( 23 / 28 ) & 439.026315789474 & 1.09146882001801 & 402.23440902529 \tabularnewline
Trimmed Mean ( 24 / 28 ) & 439.027777777778 & 1.04917663190631 & 418.449824773625 \tabularnewline
Trimmed Mean ( 25 / 28 ) & 439.029411764706 & 1.01018458463806 & 434.603159106814 \tabularnewline
Trimmed Mean ( 26 / 28 ) & 439.0625 & 0.96505212545163 & 454.962471373787 \tabularnewline
Trimmed Mean ( 27 / 28 ) & 439.033333333333 & 0.924112912110583 & 475.086244959639 \tabularnewline
Trimmed Mean ( 28 / 28 ) & 439.035714285714 & 0.90191175974892 & 486.783445874944 \tabularnewline
Median & 439 &  &  \tabularnewline
Midrange & 430.5 &  &  \tabularnewline
Midmean - Weighted Average at Xnp & 438.272727272727 &  &  \tabularnewline
Midmean - Weighted Average at X(n+1)p & 438.272727272727 &  &  \tabularnewline
Midmean - Empirical Distribution Function & 438.272727272727 &  &  \tabularnewline
Midmean - Empirical Distribution Function - Averaging & 438.272727272727 &  &  \tabularnewline
Midmean - Empirical Distribution Function - Interpolation & 438.272727272727 &  &  \tabularnewline
Midmean - Closest Observation & 438.272727272727 &  &  \tabularnewline
Midmean - True Basic - Statistics Graphics Toolkit & 438.272727272727 &  &  \tabularnewline
Midmean - MS Excel (old versions) & 438.6 &  &  \tabularnewline
Number of observations & 84 &  &  \tabularnewline
\hline
\end{tabular}
%Source: https://freestatistics.org/blog/index.php?pk=233944&T=1

[TABLE]
[ROW][C]Central Tendency - Ungrouped Data[/C][/ROW]
[ROW][C]Measure[/C][C]Value[/C][C]S.E.[/C][C]Value/S.E.[/C][/ROW]
[ROW][C]Arithmetic Mean[/C][C]436.940476190476[/C][C]2.34706339818247[/C][C]186.1647523151[/C][/ROW]
[ROW][C]Geometric Mean[/C][C]436.409517321811[/C][C][/C][C][/C][/ROW]
[ROW][C]Harmonic Mean[/C][C]435.870769770154[/C][C][/C][C][/C][/ROW]
[ROW][C]Quadratic Mean[/C][C]437.463372616442[/C][C][/C][C][/C][/ROW]
[ROW][C]Winsorized Mean ( 1 / 28 )[/C][C]437[/C][C]2.33189858356149[/C][C]187.400945770366[/C][/ROW]
[ROW][C]Winsorized Mean ( 2 / 28 )[/C][C]437.047619047619[/C][C]2.27119359726443[/C][C]192.430808000703[/C][/ROW]
[ROW][C]Winsorized Mean ( 3 / 28 )[/C][C]437.047619047619[/C][C]2.27119359726443[/C][C]192.430808000703[/C][/ROW]
[ROW][C]Winsorized Mean ( 4 / 28 )[/C][C]436.952380952381[/C][C]2.25445977095106[/C][C]193.816889785551[/C][/ROW]
[ROW][C]Winsorized Mean ( 5 / 28 )[/C][C]436.952380952381[/C][C]2.23176005514656[/C][C]195.788243429102[/C][/ROW]
[ROW][C]Winsorized Mean ( 6 / 28 )[/C][C]437.095238095238[/C][C]2.17590064493842[/C][C]200.880145475396[/C][/ROW]
[ROW][C]Winsorized Mean ( 7 / 28 )[/C][C]437.178571428571[/C][C]2.09999321873381[/C][C]208.180944361415[/C][/ROW]
[ROW][C]Winsorized Mean ( 8 / 28 )[/C][C]437.178571428571[/C][C]2.03449601698092[/C][C]214.882982212627[/C][/ROW]
[ROW][C]Winsorized Mean ( 9 / 28 )[/C][C]437.071428571429[/C][C]2.01833148786775[/C][C]216.550864512929[/C][/ROW]
[ROW][C]Winsorized Mean ( 10 / 28 )[/C][C]437.309523809524[/C][C]1.93608249577057[/C][C]225.873393703439[/C][/ROW]
[ROW][C]Winsorized Mean ( 11 / 28 )[/C][C]437.178571428571[/C][C]1.91703723482144[/C][C]228.049076714617[/C][/ROW]
[ROW][C]Winsorized Mean ( 12 / 28 )[/C][C]437.607142857143[/C][C]1.84317894471592[/C][C]237.419781791501[/C][/ROW]
[ROW][C]Winsorized Mean ( 13 / 28 )[/C][C]437.607142857143[/C][C]1.84317894471592[/C][C]237.419781791501[/C][/ROW]
[ROW][C]Winsorized Mean ( 14 / 28 )[/C][C]437.607142857143[/C][C]1.79124359096237[/C][C]244.303535859147[/C][/ROW]
[ROW][C]Winsorized Mean ( 15 / 28 )[/C][C]437.25[/C][C]1.74112576595557[/C][C]251.130623961577[/C][/ROW]
[ROW][C]Winsorized Mean ( 16 / 28 )[/C][C]437.630952380952[/C][C]1.6211613172694[/C][C]269.949046846291[/C][/ROW]
[ROW][C]Winsorized Mean ( 17 / 28 )[/C][C]437.833333333333[/C][C]1.52948017948259[/C][C]286.262835705035[/C][/ROW]
[ROW][C]Winsorized Mean ( 18 / 28 )[/C][C]437.833333333333[/C][C]1.46745467278422[/C][C]298.362424034964[/C][/ROW]
[ROW][C]Winsorized Mean ( 19 / 28 )[/C][C]438.964285714286[/C][C]1.30111457897099[/C][C]337.375579990387[/C][/ROW]
[ROW][C]Winsorized Mean ( 20 / 28 )[/C][C]438.72619047619[/C][C]1.26839321181599[/C][C]345.891310667024[/C][/ROW]
[ROW][C]Winsorized Mean ( 21 / 28 )[/C][C]438.47619047619[/C][C]1.23494678896104[/C][C]355.056747704152[/C][/ROW]
[ROW][C]Winsorized Mean ( 22 / 28 )[/C][C]438.738095238095[/C][C]1.12782049668979[/C][C]389.01411751765[/C][/ROW]
[ROW][C]Winsorized Mean ( 23 / 28 )[/C][C]439.011904761905[/C][C]1.09102293839294[/C][C]402.385586327419[/C][/ROW]
[ROW][C]Winsorized Mean ( 24 / 28 )[/C][C]439.011904761905[/C][C]1.01586582562836[/C][C]432.155402501463[/C][/ROW]
[ROW][C]Winsorized Mean ( 25 / 28 )[/C][C]438.714285714286[/C][C]0.977599280088794[/C][C]448.766989348067[/C][/ROW]
[ROW][C]Winsorized Mean ( 26 / 28 )[/C][C]439.333333333333[/C][C]0.897873648855795[/C][C]489.304184272695[/C][/ROW]
[ROW][C]Winsorized Mean ( 27 / 28 )[/C][C]439.011904761905[/C][C]0.776057021215311[/C][C]565.695422836854[/C][/ROW]
[ROW][C]Winsorized Mean ( 28 / 28 )[/C][C]438.678571428571[/C][C]0.735377772858299[/C][C]596.534988708587[/C][/ROW]
[ROW][C]Trimmed Mean ( 1 / 28 )[/C][C]437.09756097561[/C][C]2.26852902901076[/C][C]192.678848445777[/C][/ROW]
[ROW][C]Trimmed Mean ( 2 / 28 )[/C][C]437.2[/C][C]2.1949597037909[/C][C]199.183611090862[/C][/ROW]
[ROW][C]Trimmed Mean ( 3 / 28 )[/C][C]437.282051282051[/C][C]2.14717383006344[/C][C]203.654704225382[/C][/ROW]
[ROW][C]Trimmed Mean ( 4 / 28 )[/C][C]437.368421052632[/C][C]2.09132226327371[/C][C]209.1348754486[/C][/ROW]
[ROW][C]Trimmed Mean ( 5 / 28 )[/C][C]437.486486486487[/C][C]2.03170384823477[/C][C]215.329850788339[/C][/ROW]
[ROW][C]Trimmed Mean ( 6 / 28 )[/C][C]437.611111111111[/C][C]1.96840811292873[/C][C]222.317266544895[/C][/ROW]
[ROW][C]Trimmed Mean ( 7 / 28 )[/C][C]437.714285714286[/C][C]1.90902215081855[/C][C]229.287169625875[/C][/ROW]
[ROW][C]Trimmed Mean ( 8 / 28 )[/C][C]437.808823529412[/C][C]1.85755432130606[/C][C]235.690993532607[/C][/ROW]
[ROW][C]Trimmed Mean ( 9 / 28 )[/C][C]437.909090909091[/C][C]1.81122211091599[/C][C]241.775477601489[/C][/ROW]
[ROW][C]Trimmed Mean ( 10 / 28 )[/C][C]438.03125[/C][C]1.75890150349812[/C][C]249.036827320256[/C][/ROW]
[ROW][C]Trimmed Mean ( 11 / 28 )[/C][C]438.129032258065[/C][C]1.71340005601903[/C][C]255.707375938826[/C][/ROW]
[ROW][C]Trimmed Mean ( 12 / 28 )[/C][C]438.25[/C][C]1.66173705997585[/C][C]263.730051255142[/C][/ROW]
[ROW][C]Trimmed Mean ( 13 / 28 )[/C][C]438.327586206897[/C][C]1.61406175860077[/C][C]271.56803875143[/C][/ROW]
[ROW][C]Trimmed Mean ( 14 / 28 )[/C][C]438.410714285714[/C][C]1.55521259784307[/C][C]281.897609943327[/C][/ROW]
[ROW][C]Trimmed Mean ( 15 / 28 )[/C][C]438.5[/C][C]1.49299552558372[/C][C]293.704831987731[/C][/ROW]
[ROW][C]Trimmed Mean ( 16 / 28 )[/C][C]438.634615384615[/C][C]1.42511115868049[/C][C]307.789755706317[/C][/ROW]
[ROW][C]Trimmed Mean ( 17 / 28 )[/C][C]438.74[/C][C]1.36600415333877[/C][C]321.184967796501[/C][/ROW]
[ROW][C]Trimmed Mean ( 18 / 28 )[/C][C]438.833333333333[/C][C]1.31087017460052[/C][C]334.764907949076[/C][/ROW]
[ROW][C]Trimmed Mean ( 19 / 28 )[/C][C]438.934782608696[/C][C]1.25355616810044[/C][C]350.151667534635[/C][/ROW]
[ROW][C]Trimmed Mean ( 20 / 28 )[/C][C]438.931818181818[/C][C]1.21712486885163[/C][C]360.63006304025[/C][/ROW]
[ROW][C]Trimmed Mean ( 21 / 28 )[/C][C]438.952380952381[/C][C]1.17610371764081[/C][C]373.225910579462[/C][/ROW]
[ROW][C]Trimmed Mean ( 22 / 28 )[/C][C]439[/C][C]1.1288750924522[/C][C]388.882705389823[/C][/ROW]
[ROW][C]Trimmed Mean ( 23 / 28 )[/C][C]439.026315789474[/C][C]1.09146882001801[/C][C]402.23440902529[/C][/ROW]
[ROW][C]Trimmed Mean ( 24 / 28 )[/C][C]439.027777777778[/C][C]1.04917663190631[/C][C]418.449824773625[/C][/ROW]
[ROW][C]Trimmed Mean ( 25 / 28 )[/C][C]439.029411764706[/C][C]1.01018458463806[/C][C]434.603159106814[/C][/ROW]
[ROW][C]Trimmed Mean ( 26 / 28 )[/C][C]439.0625[/C][C]0.96505212545163[/C][C]454.962471373787[/C][/ROW]
[ROW][C]Trimmed Mean ( 27 / 28 )[/C][C]439.033333333333[/C][C]0.924112912110583[/C][C]475.086244959639[/C][/ROW]
[ROW][C]Trimmed Mean ( 28 / 28 )[/C][C]439.035714285714[/C][C]0.90191175974892[/C][C]486.783445874944[/C][/ROW]
[ROW][C]Median[/C][C]439[/C][C][/C][C][/C][/ROW]
[ROW][C]Midrange[/C][C]430.5[/C][C][/C][C][/C][/ROW]
[ROW][C]Midmean - Weighted Average at Xnp[/C][C]438.272727272727[/C][C][/C][C][/C][/ROW]
[ROW][C]Midmean - Weighted Average at X(n+1)p[/C][C]438.272727272727[/C][C][/C][C][/C][/ROW]
[ROW][C]Midmean - Empirical Distribution Function[/C][C]438.272727272727[/C][C][/C][C][/C][/ROW]
[ROW][C]Midmean - Empirical Distribution Function - Averaging[/C][C]438.272727272727[/C][C][/C][C][/C][/ROW]
[ROW][C]Midmean - Empirical Distribution Function - Interpolation[/C][C]438.272727272727[/C][C][/C][C][/C][/ROW]
[ROW][C]Midmean - Closest Observation[/C][C]438.272727272727[/C][C][/C][C][/C][/ROW]
[ROW][C]Midmean - True Basic - Statistics Graphics Toolkit[/C][C]438.272727272727[/C][C][/C][C][/C][/ROW]
[ROW][C]Midmean - MS Excel (old versions)[/C][C]438.6[/C][C][/C][C][/C][/ROW]
[ROW][C]Number of observations[/C][C]84[/C][C][/C][C][/C][/ROW]
[/TABLE]
Source: https://freestatistics.org/blog/index.php?pk=233944&T=1

Globally Unique Identifier (entire table): ba.freestatistics.org/blog/index.php?pk=233944&T=1

As an alternative you can also use a QR Code:  

The GUIDs for individual cells are displayed in the table below:

Central Tendency - Ungrouped Data
MeasureValueS.E.Value/S.E.
Arithmetic Mean436.9404761904762.34706339818247186.1647523151
Geometric Mean436.409517321811
Harmonic Mean435.870769770154
Quadratic Mean437.463372616442
Winsorized Mean ( 1 / 28 )4372.33189858356149187.400945770366
Winsorized Mean ( 2 / 28 )437.0476190476192.27119359726443192.430808000703
Winsorized Mean ( 3 / 28 )437.0476190476192.27119359726443192.430808000703
Winsorized Mean ( 4 / 28 )436.9523809523812.25445977095106193.816889785551
Winsorized Mean ( 5 / 28 )436.9523809523812.23176005514656195.788243429102
Winsorized Mean ( 6 / 28 )437.0952380952382.17590064493842200.880145475396
Winsorized Mean ( 7 / 28 )437.1785714285712.09999321873381208.180944361415
Winsorized Mean ( 8 / 28 )437.1785714285712.03449601698092214.882982212627
Winsorized Mean ( 9 / 28 )437.0714285714292.01833148786775216.550864512929
Winsorized Mean ( 10 / 28 )437.3095238095241.93608249577057225.873393703439
Winsorized Mean ( 11 / 28 )437.1785714285711.91703723482144228.049076714617
Winsorized Mean ( 12 / 28 )437.6071428571431.84317894471592237.419781791501
Winsorized Mean ( 13 / 28 )437.6071428571431.84317894471592237.419781791501
Winsorized Mean ( 14 / 28 )437.6071428571431.79124359096237244.303535859147
Winsorized Mean ( 15 / 28 )437.251.74112576595557251.130623961577
Winsorized Mean ( 16 / 28 )437.6309523809521.6211613172694269.949046846291
Winsorized Mean ( 17 / 28 )437.8333333333331.52948017948259286.262835705035
Winsorized Mean ( 18 / 28 )437.8333333333331.46745467278422298.362424034964
Winsorized Mean ( 19 / 28 )438.9642857142861.30111457897099337.375579990387
Winsorized Mean ( 20 / 28 )438.726190476191.26839321181599345.891310667024
Winsorized Mean ( 21 / 28 )438.476190476191.23494678896104355.056747704152
Winsorized Mean ( 22 / 28 )438.7380952380951.12782049668979389.01411751765
Winsorized Mean ( 23 / 28 )439.0119047619051.09102293839294402.385586327419
Winsorized Mean ( 24 / 28 )439.0119047619051.01586582562836432.155402501463
Winsorized Mean ( 25 / 28 )438.7142857142860.977599280088794448.766989348067
Winsorized Mean ( 26 / 28 )439.3333333333330.897873648855795489.304184272695
Winsorized Mean ( 27 / 28 )439.0119047619050.776057021215311565.695422836854
Winsorized Mean ( 28 / 28 )438.6785714285710.735377772858299596.534988708587
Trimmed Mean ( 1 / 28 )437.097560975612.26852902901076192.678848445777
Trimmed Mean ( 2 / 28 )437.22.1949597037909199.183611090862
Trimmed Mean ( 3 / 28 )437.2820512820512.14717383006344203.654704225382
Trimmed Mean ( 4 / 28 )437.3684210526322.09132226327371209.1348754486
Trimmed Mean ( 5 / 28 )437.4864864864872.03170384823477215.329850788339
Trimmed Mean ( 6 / 28 )437.6111111111111.96840811292873222.317266544895
Trimmed Mean ( 7 / 28 )437.7142857142861.90902215081855229.287169625875
Trimmed Mean ( 8 / 28 )437.8088235294121.85755432130606235.690993532607
Trimmed Mean ( 9 / 28 )437.9090909090911.81122211091599241.775477601489
Trimmed Mean ( 10 / 28 )438.031251.75890150349812249.036827320256
Trimmed Mean ( 11 / 28 )438.1290322580651.71340005601903255.707375938826
Trimmed Mean ( 12 / 28 )438.251.66173705997585263.730051255142
Trimmed Mean ( 13 / 28 )438.3275862068971.61406175860077271.56803875143
Trimmed Mean ( 14 / 28 )438.4107142857141.55521259784307281.897609943327
Trimmed Mean ( 15 / 28 )438.51.49299552558372293.704831987731
Trimmed Mean ( 16 / 28 )438.6346153846151.42511115868049307.789755706317
Trimmed Mean ( 17 / 28 )438.741.36600415333877321.184967796501
Trimmed Mean ( 18 / 28 )438.8333333333331.31087017460052334.764907949076
Trimmed Mean ( 19 / 28 )438.9347826086961.25355616810044350.151667534635
Trimmed Mean ( 20 / 28 )438.9318181818181.21712486885163360.63006304025
Trimmed Mean ( 21 / 28 )438.9523809523811.17610371764081373.225910579462
Trimmed Mean ( 22 / 28 )4391.1288750924522388.882705389823
Trimmed Mean ( 23 / 28 )439.0263157894741.09146882001801402.23440902529
Trimmed Mean ( 24 / 28 )439.0277777777781.04917663190631418.449824773625
Trimmed Mean ( 25 / 28 )439.0294117647061.01018458463806434.603159106814
Trimmed Mean ( 26 / 28 )439.06250.96505212545163454.962471373787
Trimmed Mean ( 27 / 28 )439.0333333333330.924112912110583475.086244959639
Trimmed Mean ( 28 / 28 )439.0357142857140.90191175974892486.783445874944
Median439
Midrange430.5
Midmean - Weighted Average at Xnp438.272727272727
Midmean - Weighted Average at X(n+1)p438.272727272727
Midmean - Empirical Distribution Function438.272727272727
Midmean - Empirical Distribution Function - Averaging438.272727272727
Midmean - Empirical Distribution Function - Interpolation438.272727272727
Midmean - Closest Observation438.272727272727
Midmean - True Basic - Statistics Graphics Toolkit438.272727272727
Midmean - MS Excel (old versions)438.6
Number of observations84


Parameters (Session):
Parameters (R input):
R code (references can be found in the software module):
geomean <- function(x) {
return(exp(mean(log(x))))
}
harmean <- function(x) {
return(1/mean(1/x))
}
quamean <- function(x) {
return(sqrt(mean(x*x)))
}
winmean <- function(x) {
x <-sort(x[!is.na(x)])
n<-length(x)
denom <- 3
nodenom <- n/denom
if (nodenom>40) denom <- n/40
sqrtn = sqrt(n)
roundnodenom = floor(nodenom)
win <- array(NA,dim=c(roundnodenom,2))
for (j in 1:roundnodenom) {
win[j,1] <- (j*x[j+1]+sum(x[(j+1):(n-j)])+j*x[n-j])/n
win[j,2] <- sd(c(rep(x[j+1],j),x[(j+1):(n-j)],rep(x[n-j],j)))/sqrtn
}
return(win)
}
trimean <- function(x) {
x <-sort(x[!is.na(x)])
n<-length(x)
denom <- 3
nodenom <- n/denom
if (nodenom>40) denom <- n/40
sqrtn = sqrt(n)
roundnodenom = floor(nodenom)
tri <- array(NA,dim=c(roundnodenom,2))
for (j in 1:roundnodenom) {
tri[j,1] <- mean(x,trim=j/n)
tri[j,2] <- sd(x[(j+1):(n-j)]) / sqrt(n-j*2)
}
return(tri)
}
midrange <- function(x) {
return((max(x)+min(x))/2)
}
q1 <- function(data,n,p,i,f) {
np <- n*p;
i <<- floor(np)
f <<- np - i
qvalue <- (1-f)*data[i] + f*data[i+1]
}
q2 <- function(data,n,p,i,f) {
np <- (n+1)*p
i <<- floor(np)
f <<- np - i
qvalue <- (1-f)*data[i] + f*data[i+1]
}
q3 <- function(data,n,p,i,f) {
np <- n*p
i <<- floor(np)
f <<- np - i
if (f==0) {
qvalue <- data[i]
} else {
qvalue <- data[i+1]
}
}
q4 <- function(data,n,p,i,f) {
np <- n*p
i <<- floor(np)
f <<- np - i
if (f==0) {
qvalue <- (data[i]+data[i+1])/2
} else {
qvalue <- data[i+1]
}
}
q5 <- function(data,n,p,i,f) {
np <- (n-1)*p
i <<- floor(np)
f <<- np - i
if (f==0) {
qvalue <- data[i+1]
} else {
qvalue <- data[i+1] + f*(data[i+2]-data[i+1])
}
}
q6 <- function(data,n,p,i,f) {
np <- n*p+0.5
i <<- floor(np)
f <<- np - i
qvalue <- data[i]
}
q7 <- function(data,n,p,i,f) {
np <- (n+1)*p
i <<- floor(np)
f <<- np - i
if (f==0) {
qvalue <- data[i]
} else {
qvalue <- f*data[i] + (1-f)*data[i+1]
}
}
q8 <- function(data,n,p,i,f) {
np <- (n+1)*p
i <<- floor(np)
f <<- np - i
if (f==0) {
qvalue <- data[i]
} else {
if (f == 0.5) {
qvalue <- (data[i]+data[i+1])/2
} else {
if (f < 0.5) {
qvalue <- data[i]
} else {
qvalue <- data[i+1]
}
}
}
}
midmean <- function(x,def) {
x <-sort(x[!is.na(x)])
n<-length(x)
if (def==1) {
qvalue1 <- q1(x,n,0.25,i,f)
qvalue3 <- q1(x,n,0.75,i,f)
}
if (def==2) {
qvalue1 <- q2(x,n,0.25,i,f)
qvalue3 <- q2(x,n,0.75,i,f)
}
if (def==3) {
qvalue1 <- q3(x,n,0.25,i,f)
qvalue3 <- q3(x,n,0.75,i,f)
}
if (def==4) {
qvalue1 <- q4(x,n,0.25,i,f)
qvalue3 <- q4(x,n,0.75,i,f)
}
if (def==5) {
qvalue1 <- q5(x,n,0.25,i,f)
qvalue3 <- q5(x,n,0.75,i,f)
}
if (def==6) {
qvalue1 <- q6(x,n,0.25,i,f)
qvalue3 <- q6(x,n,0.75,i,f)
}
if (def==7) {
qvalue1 <- q7(x,n,0.25,i,f)
qvalue3 <- q7(x,n,0.75,i,f)
}
if (def==8) {
qvalue1 <- q8(x,n,0.25,i,f)
qvalue3 <- q8(x,n,0.75,i,f)
}
midm <- 0
myn <- 0
roundno4 <- round(n/4)
round3no4 <- round(3*n/4)
for (i in 1:n) {
if ((x[i]>=qvalue1) & (x[i]<=qvalue3)){
midm = midm + x[i]
myn = myn + 1
}
}
midm = midm / myn
return(midm)
}
(arm <- mean(x))
sqrtn <- sqrt(length(x))
(armse <- sd(x) / sqrtn)
(armose <- arm / armse)
(geo <- geomean(x))
(har <- harmean(x))
(qua <- quamean(x))
(win <- winmean(x))
(tri <- trimean(x))
(midr <- midrange(x))
midm <- array(NA,dim=8)
for (j in 1:8) midm[j] <- midmean(x,j)
midm
bitmap(file='test1.png')
lb <- win[,1] - 2*win[,2]
ub <- win[,1] + 2*win[,2]
if ((ylimmin == '') | (ylimmax == '')) plot(win[,1],type='b',main=main, xlab='j', pch=19, ylab='Winsorized Mean(j/n)', ylim=c(min(lb),max(ub))) else plot(win[,1],type='l',main=main, xlab='j', pch=19, ylab='Winsorized Mean(j/n)', ylim=c(ylimmin,ylimmax))
lines(ub,lty=3)
lines(lb,lty=3)
grid()
dev.off()
bitmap(file='test2.png')
lb <- tri[,1] - 2*tri[,2]
ub <- tri[,1] + 2*tri[,2]
if ((ylimmin == '') | (ylimmax == '')) plot(tri[,1],type='b',main=main, xlab='j', pch=19, ylab='Trimmed Mean(j/n)', ylim=c(min(lb),max(ub))) else plot(tri[,1],type='l',main=main, xlab='j', pch=19, ylab='Trimmed Mean(j/n)', ylim=c(ylimmin,ylimmax))
lines(ub,lty=3)
lines(lb,lty=3)
grid()
dev.off()
load(file='createtable')
a<-table.start()
a<-table.row.start(a)
a<-table.element(a,'Central Tendency - Ungrouped Data',4,TRUE)
a<-table.row.end(a)
a<-table.row.start(a)
a<-table.element(a,'Measure',header=TRUE)
a<-table.element(a,'Value',header=TRUE)
a<-table.element(a,'S.E.',header=TRUE)
a<-table.element(a,'Value/S.E.',header=TRUE)
a<-table.row.end(a)
a<-table.row.start(a)
a<-table.element(a,hyperlink('arithmetic_mean.htm', 'Arithmetic Mean', 'click to view the definition of the Arithmetic Mean'),header=TRUE)
a<-table.element(a,arm)
a<-table.element(a,hyperlink('arithmetic_mean_standard_error.htm', armse, 'click to view the definition of the Standard Error of the Arithmetic Mean'))
a<-table.element(a,armose)
a<-table.row.end(a)
a<-table.row.start(a)
a<-table.element(a,hyperlink('geometric_mean.htm', 'Geometric Mean', 'click to view the definition of the Geometric Mean'),header=TRUE)
a<-table.element(a,geo)
a<-table.element(a,'')
a<-table.row.end(a)
a<-table.row.start(a)
a<-table.element(a,hyperlink('harmonic_mean.htm', 'Harmonic Mean', 'click to view the definition of the Harmonic Mean'),header=TRUE)
a<-table.element(a,har)
a<-table.element(a,'')
a<-table.row.end(a)
a<-table.row.start(a)
a<-table.element(a,hyperlink('quadratic_mean.htm', 'Quadratic Mean', 'click to view the definition of the Quadratic Mean'),header=TRUE)
a<-table.element(a,qua)
a<-table.element(a,'')
a<-table.row.end(a)
for (j in 1:length(win[,1])) {
a<-table.row.start(a)
mylabel <- paste('Winsorized Mean (',j)
mylabel <- paste(mylabel,'/')
mylabel <- paste(mylabel,length(win[,1]))
mylabel <- paste(mylabel,')')
a<-table.element(a,hyperlink('winsorized_mean.htm', mylabel, 'click to view the definition of the Winsorized Mean'),header=TRUE)
a<-table.element(a,win[j,1])
a<-table.element(a,win[j,2])
a<-table.element(a,win[j,1]/win[j,2])
a<-table.row.end(a)
}
for (j in 1:length(tri[,1])) {
a<-table.row.start(a)
mylabel <- paste('Trimmed Mean (',j)
mylabel <- paste(mylabel,'/')
mylabel <- paste(mylabel,length(tri[,1]))
mylabel <- paste(mylabel,')')
a<-table.element(a,hyperlink('arithmetic_mean.htm', mylabel, 'click to view the definition of the Trimmed Mean'),header=TRUE)
a<-table.element(a,tri[j,1])
a<-table.element(a,tri[j,2])
a<-table.element(a,tri[j,1]/tri[j,2])
a<-table.row.end(a)
}
a<-table.row.start(a)
a<-table.element(a,hyperlink('median_1.htm', 'Median', 'click to view the definition of the Median'),header=TRUE)
a<-table.element(a,median(x))
a<-table.element(a,'')
a<-table.row.end(a)
a<-table.row.start(a)
a<-table.element(a,hyperlink('midrange.htm', 'Midrange', 'click to view the definition of the Midrange'),header=TRUE)
a<-table.element(a,midr)
a<-table.element(a,'')
a<-table.row.end(a)
a<-table.row.start(a)
mymid <- hyperlink('midmean.htm', 'Midmean', 'click to view the definition of the Midmean')
mylabel <- paste(mymid,hyperlink('method_1.htm','Weighted Average at Xnp',''),sep=' - ')
a<-table.element(a,mylabel,header=TRUE)
a<-table.element(a,midm[1])
a<-table.element(a,'')
a<-table.row.end(a)
a<-table.row.start(a)
mymid <- hyperlink('midmean.htm', 'Midmean', 'click to view the definition of the Midmean')
mylabel <- paste(mymid,hyperlink('method_2.htm','Weighted Average at X(n+1)p',''),sep=' - ')
a<-table.element(a,mylabel,header=TRUE)
a<-table.element(a,midm[2])
a<-table.element(a,'')
a<-table.row.end(a)
a<-table.row.start(a)
mymid <- hyperlink('midmean.htm', 'Midmean', 'click to view the definition of the Midmean')
mylabel <- paste(mymid,hyperlink('method_3.htm','Empirical Distribution Function',''),sep=' - ')
a<-table.element(a,mylabel,header=TRUE)
a<-table.element(a,midm[3])
a<-table.element(a,'')
a<-table.row.end(a)
a<-table.row.start(a)
mymid <- hyperlink('midmean.htm', 'Midmean', 'click to view the definition of the Midmean')
mylabel <- paste(mymid,hyperlink('method_4.htm','Empirical Distribution Function - Averaging',''),sep=' - ')
a<-table.element(a,mylabel,header=TRUE)
a<-table.element(a,midm[4])
a<-table.element(a,'')
a<-table.row.end(a)
a<-table.row.start(a)
mymid <- hyperlink('midmean.htm', 'Midmean', 'click to view the definition of the Midmean')
mylabel <- paste(mymid,hyperlink('method_5.htm','Empirical Distribution Function - Interpolation',''),sep=' - ')
a<-table.element(a,mylabel,header=TRUE)
a<-table.element(a,midm[5])
a<-table.element(a,'')
a<-table.row.end(a)
a<-table.row.start(a)
mymid <- hyperlink('midmean.htm', 'Midmean', 'click to view the definition of the Midmean')
mylabel <- paste(mymid,hyperlink('method_6.htm','Closest Observation',''),sep=' - ')
a<-table.element(a,mylabel,header=TRUE)
a<-table.element(a,midm[6])
a<-table.element(a,'')
a<-table.row.end(a)
a<-table.row.start(a)
mymid <- hyperlink('midmean.htm', 'Midmean', 'click to view the definition of the Midmean')
mylabel <- paste(mymid,hyperlink('method_7.htm','True Basic - Statistics Graphics Toolkit',''),sep=' - ')
a<-table.element(a,mylabel,header=TRUE)
a<-table.element(a,midm[7])
a<-table.element(a,'')
a<-table.row.end(a)
a<-table.row.start(a)
mymid <- hyperlink('midmean.htm', 'Midmean', 'click to view the definition of the Midmean')
mylabel <- paste(mymid,hyperlink('method_8.htm','MS Excel (old versions)',''),sep=' - ')
a<-table.element(a,mylabel,header=TRUE)
a<-table.element(a,midm[8])
a<-table.element(a,'')
a<-table.row.end(a)
a<-table.row.start(a)
a<-table.element(a,'Number of observations',header=TRUE)
a<-table.element(a,length(x))
a<-table.element(a,'')
a<-table.row.end(a)
a<-table.end(a)
table.save(a,file='mytable.tab')