Free Statistics

of Irreproducible Research!

Author's title

Author*Unverified author*
R Software Modulerwasp_autocorrelation.wasp
Title produced by software(Partial) Autocorrelation Function
Date of computationThu, 13 Mar 2014 11:21:47 -0400
Cite this page as followsStatistical Computations at FreeStatistics.org, Office for Research Development and Education, URL https://freestatistics.org/blog/index.php?v=date/2014/Mar/13/t13947242711tg8zw4eo65jvsx.htm/, Retrieved Mon, 13 May 2024 23:00:51 +0000
Statistical Computations at FreeStatistics.org, Office for Research Development and Education, URL https://freestatistics.org/blog/index.php?pk=234238, Retrieved Mon, 13 May 2024 23:00:51 +0000
QR Codes:

Original text written by user:
IsPrivate?No (this computation is public)
User-defined keywords
Estimated Impact151
Family? (F = Feedback message, R = changed R code, M = changed R Module, P = changed Parameters, D = changed Data)
-       [(Partial) Autocorrelation Function] [opgave 6 bis oefe...] [2014-03-13 15:21:47] [28ee828acec30dee1c1aebeda9b64e12] [Current]
Feedback Forum

Post a new message
Dataseries X:
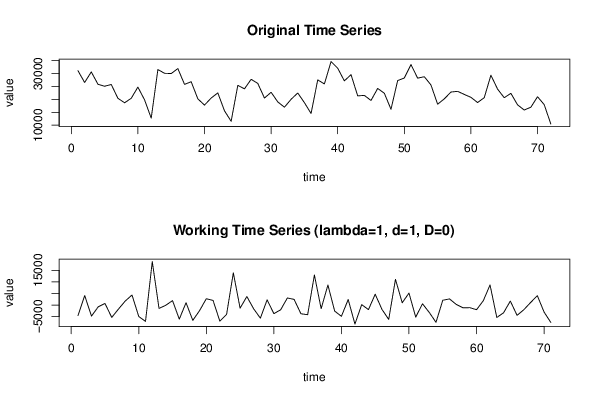
31124
26551
30651
25859
25100
25778
20418
18688
20424
24776
19814
12738
31566
30111
30019
31934
25826
26835
20205
17789
20520
22518
15572
11509
25447
24090
27786
26195
20516
22759
19028
16971
20036
22485
18730
14538
27561
25985
34670
32066
27186
29586
21359
21553
19573
24256
22380
16167
27297
28287
33474
28229
28785
25597
18130
20198
22849
23118
21925
20801
18785
20659
29367
23992
20645
22356
17902
15879
16963
21035
17988
10437


Summary of computational transaction
Raw Inputview raw input (R code)
Raw Outputview raw output of R engine
Computing time3 seconds
R Server'Gertrude Mary Cox' @ cox.wessa.net

\begin{tabular}{lllllllll}
\hline
Summary of computational transaction \tabularnewline
Raw Input & view raw input (R code)  \tabularnewline
Raw Output & view raw output of R engine  \tabularnewline
Computing time & 3 seconds \tabularnewline
R Server & 'Gertrude Mary Cox' @ cox.wessa.net \tabularnewline
\hline
\end{tabular}
%Source: https://freestatistics.org/blog/index.php?pk=234238&T=0

[TABLE]
[ROW][C]Summary of computational transaction[/C][/ROW]
[ROW][C]Raw Input[/C][C]view raw input (R code) [/C][/ROW]
[ROW][C]Raw Output[/C][C]view raw output of R engine [/C][/ROW]
[ROW][C]Computing time[/C][C]3 seconds[/C][/ROW]
[ROW][C]R Server[/C][C]'Gertrude Mary Cox' @ cox.wessa.net[/C][/ROW]
[/TABLE]
Source: https://freestatistics.org/blog/index.php?pk=234238&T=0

Globally Unique Identifier (entire table): ba.freestatistics.org/blog/index.php?pk=234238&T=0

As an alternative you can also use a QR Code:  

The GUIDs for individual cells are displayed in the table below:

Summary of computational transaction
Raw Inputview raw input (R code)
Raw Outputview raw output of R engine
Computing time3 seconds
R Server'Gertrude Mary Cox' @ cox.wessa.net


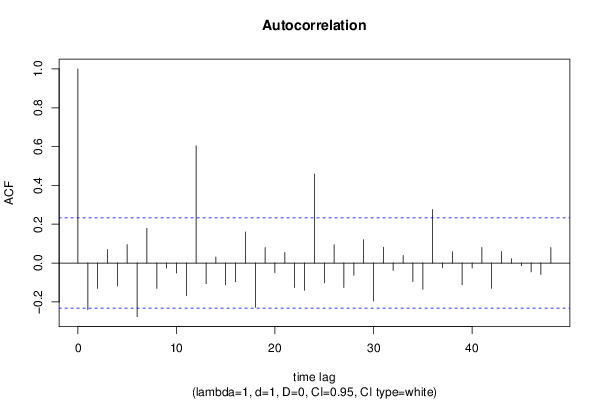
Autocorrelation Function
Time lag kACF(k)T-STATP-value
1-0.240896-2.02980.023061
2-0.130462-1.09930.137678
30.0698640.58870.278972
4-0.118671-0.99990.160368
50.0948410.79910.213436
6-0.276216-2.32740.011399
70.1794861.51240.067439
8-0.130641-1.10080.13735
9-0.026185-0.22060.413004
10-0.050967-0.42950.334447
11-0.168545-1.42020.079965
120.6039615.08911e-06
13-0.10615-0.89440.187054
140.0313340.2640.396264
15-0.111501-0.93950.175324
16-0.096206-0.81060.210138
170.160391.35150.090417
18-0.227856-1.920.029441
190.0802380.67610.250588
20-0.048956-0.41250.340605
210.0545890.460.323469
22-0.125642-1.05870.146667
23-0.140594-1.18470.12005
240.4581153.86010.000124
25-0.101739-0.85730.197091
260.0942250.7940.214933
27-0.125788-1.05990.14639
28-0.063072-0.53150.298381
290.1197231.00880.158248
30-0.19592-1.65090.051593
310.0810280.68280.248491
32-0.038711-0.32620.372622
330.0391090.32950.371358
34-0.094732-0.79820.213701
35-0.134802-1.13590.129916
360.2756732.32290.011528
37-0.024616-0.20740.418139
380.0586210.4940.311432
39-0.111295-0.93780.175767
40-0.025714-0.21670.414544
410.0797670.67210.251841
42-0.130727-1.10150.137194
430.0595450.50170.308703
440.0219770.18520.426808
45-0.014273-0.12030.452307
46-0.045531-0.38370.351192
47-0.058723-0.49480.31113
480.0797390.67190.251915

\begin{tabular}{lllllllll}
\hline
Autocorrelation Function \tabularnewline
Time lag k & ACF(k) & T-STAT & P-value \tabularnewline
1 & -0.240896 & -2.0298 & 0.023061 \tabularnewline
2 & -0.130462 & -1.0993 & 0.137678 \tabularnewline
3 & 0.069864 & 0.5887 & 0.278972 \tabularnewline
4 & -0.118671 & -0.9999 & 0.160368 \tabularnewline
5 & 0.094841 & 0.7991 & 0.213436 \tabularnewline
6 & -0.276216 & -2.3274 & 0.011399 \tabularnewline
7 & 0.179486 & 1.5124 & 0.067439 \tabularnewline
8 & -0.130641 & -1.1008 & 0.13735 \tabularnewline
9 & -0.026185 & -0.2206 & 0.413004 \tabularnewline
10 & -0.050967 & -0.4295 & 0.334447 \tabularnewline
11 & -0.168545 & -1.4202 & 0.079965 \tabularnewline
12 & 0.603961 & 5.0891 & 1e-06 \tabularnewline
13 & -0.10615 & -0.8944 & 0.187054 \tabularnewline
14 & 0.031334 & 0.264 & 0.396264 \tabularnewline
15 & -0.111501 & -0.9395 & 0.175324 \tabularnewline
16 & -0.096206 & -0.8106 & 0.210138 \tabularnewline
17 & 0.16039 & 1.3515 & 0.090417 \tabularnewline
18 & -0.227856 & -1.92 & 0.029441 \tabularnewline
19 & 0.080238 & 0.6761 & 0.250588 \tabularnewline
20 & -0.048956 & -0.4125 & 0.340605 \tabularnewline
21 & 0.054589 & 0.46 & 0.323469 \tabularnewline
22 & -0.125642 & -1.0587 & 0.146667 \tabularnewline
23 & -0.140594 & -1.1847 & 0.12005 \tabularnewline
24 & 0.458115 & 3.8601 & 0.000124 \tabularnewline
25 & -0.101739 & -0.8573 & 0.197091 \tabularnewline
26 & 0.094225 & 0.794 & 0.214933 \tabularnewline
27 & -0.125788 & -1.0599 & 0.14639 \tabularnewline
28 & -0.063072 & -0.5315 & 0.298381 \tabularnewline
29 & 0.119723 & 1.0088 & 0.158248 \tabularnewline
30 & -0.19592 & -1.6509 & 0.051593 \tabularnewline
31 & 0.081028 & 0.6828 & 0.248491 \tabularnewline
32 & -0.038711 & -0.3262 & 0.372622 \tabularnewline
33 & 0.039109 & 0.3295 & 0.371358 \tabularnewline
34 & -0.094732 & -0.7982 & 0.213701 \tabularnewline
35 & -0.134802 & -1.1359 & 0.129916 \tabularnewline
36 & 0.275673 & 2.3229 & 0.011528 \tabularnewline
37 & -0.024616 & -0.2074 & 0.418139 \tabularnewline
38 & 0.058621 & 0.494 & 0.311432 \tabularnewline
39 & -0.111295 & -0.9378 & 0.175767 \tabularnewline
40 & -0.025714 & -0.2167 & 0.414544 \tabularnewline
41 & 0.079767 & 0.6721 & 0.251841 \tabularnewline
42 & -0.130727 & -1.1015 & 0.137194 \tabularnewline
43 & 0.059545 & 0.5017 & 0.308703 \tabularnewline
44 & 0.021977 & 0.1852 & 0.426808 \tabularnewline
45 & -0.014273 & -0.1203 & 0.452307 \tabularnewline
46 & -0.045531 & -0.3837 & 0.351192 \tabularnewline
47 & -0.058723 & -0.4948 & 0.31113 \tabularnewline
48 & 0.079739 & 0.6719 & 0.251915 \tabularnewline
\hline
\end{tabular}
%Source: https://freestatistics.org/blog/index.php?pk=234238&T=1

[TABLE]
[ROW][C]Autocorrelation Function[/C][/ROW]
[ROW][C]Time lag k[/C][C]ACF(k)[/C][C]T-STAT[/C][C]P-value[/C][/ROW]
[ROW][C]1[/C][C]-0.240896[/C][C]-2.0298[/C][C]0.023061[/C][/ROW]
[ROW][C]2[/C][C]-0.130462[/C][C]-1.0993[/C][C]0.137678[/C][/ROW]
[ROW][C]3[/C][C]0.069864[/C][C]0.5887[/C][C]0.278972[/C][/ROW]
[ROW][C]4[/C][C]-0.118671[/C][C]-0.9999[/C][C]0.160368[/C][/ROW]
[ROW][C]5[/C][C]0.094841[/C][C]0.7991[/C][C]0.213436[/C][/ROW]
[ROW][C]6[/C][C]-0.276216[/C][C]-2.3274[/C][C]0.011399[/C][/ROW]
[ROW][C]7[/C][C]0.179486[/C][C]1.5124[/C][C]0.067439[/C][/ROW]
[ROW][C]8[/C][C]-0.130641[/C][C]-1.1008[/C][C]0.13735[/C][/ROW]
[ROW][C]9[/C][C]-0.026185[/C][C]-0.2206[/C][C]0.413004[/C][/ROW]
[ROW][C]10[/C][C]-0.050967[/C][C]-0.4295[/C][C]0.334447[/C][/ROW]
[ROW][C]11[/C][C]-0.168545[/C][C]-1.4202[/C][C]0.079965[/C][/ROW]
[ROW][C]12[/C][C]0.603961[/C][C]5.0891[/C][C]1e-06[/C][/ROW]
[ROW][C]13[/C][C]-0.10615[/C][C]-0.8944[/C][C]0.187054[/C][/ROW]
[ROW][C]14[/C][C]0.031334[/C][C]0.264[/C][C]0.396264[/C][/ROW]
[ROW][C]15[/C][C]-0.111501[/C][C]-0.9395[/C][C]0.175324[/C][/ROW]
[ROW][C]16[/C][C]-0.096206[/C][C]-0.8106[/C][C]0.210138[/C][/ROW]
[ROW][C]17[/C][C]0.16039[/C][C]1.3515[/C][C]0.090417[/C][/ROW]
[ROW][C]18[/C][C]-0.227856[/C][C]-1.92[/C][C]0.029441[/C][/ROW]
[ROW][C]19[/C][C]0.080238[/C][C]0.6761[/C][C]0.250588[/C][/ROW]
[ROW][C]20[/C][C]-0.048956[/C][C]-0.4125[/C][C]0.340605[/C][/ROW]
[ROW][C]21[/C][C]0.054589[/C][C]0.46[/C][C]0.323469[/C][/ROW]
[ROW][C]22[/C][C]-0.125642[/C][C]-1.0587[/C][C]0.146667[/C][/ROW]
[ROW][C]23[/C][C]-0.140594[/C][C]-1.1847[/C][C]0.12005[/C][/ROW]
[ROW][C]24[/C][C]0.458115[/C][C]3.8601[/C][C]0.000124[/C][/ROW]
[ROW][C]25[/C][C]-0.101739[/C][C]-0.8573[/C][C]0.197091[/C][/ROW]
[ROW][C]26[/C][C]0.094225[/C][C]0.794[/C][C]0.214933[/C][/ROW]
[ROW][C]27[/C][C]-0.125788[/C][C]-1.0599[/C][C]0.14639[/C][/ROW]
[ROW][C]28[/C][C]-0.063072[/C][C]-0.5315[/C][C]0.298381[/C][/ROW]
[ROW][C]29[/C][C]0.119723[/C][C]1.0088[/C][C]0.158248[/C][/ROW]
[ROW][C]30[/C][C]-0.19592[/C][C]-1.6509[/C][C]0.051593[/C][/ROW]
[ROW][C]31[/C][C]0.081028[/C][C]0.6828[/C][C]0.248491[/C][/ROW]
[ROW][C]32[/C][C]-0.038711[/C][C]-0.3262[/C][C]0.372622[/C][/ROW]
[ROW][C]33[/C][C]0.039109[/C][C]0.3295[/C][C]0.371358[/C][/ROW]
[ROW][C]34[/C][C]-0.094732[/C][C]-0.7982[/C][C]0.213701[/C][/ROW]
[ROW][C]35[/C][C]-0.134802[/C][C]-1.1359[/C][C]0.129916[/C][/ROW]
[ROW][C]36[/C][C]0.275673[/C][C]2.3229[/C][C]0.011528[/C][/ROW]
[ROW][C]37[/C][C]-0.024616[/C][C]-0.2074[/C][C]0.418139[/C][/ROW]
[ROW][C]38[/C][C]0.058621[/C][C]0.494[/C][C]0.311432[/C][/ROW]
[ROW][C]39[/C][C]-0.111295[/C][C]-0.9378[/C][C]0.175767[/C][/ROW]
[ROW][C]40[/C][C]-0.025714[/C][C]-0.2167[/C][C]0.414544[/C][/ROW]
[ROW][C]41[/C][C]0.079767[/C][C]0.6721[/C][C]0.251841[/C][/ROW]
[ROW][C]42[/C][C]-0.130727[/C][C]-1.1015[/C][C]0.137194[/C][/ROW]
[ROW][C]43[/C][C]0.059545[/C][C]0.5017[/C][C]0.308703[/C][/ROW]
[ROW][C]44[/C][C]0.021977[/C][C]0.1852[/C][C]0.426808[/C][/ROW]
[ROW][C]45[/C][C]-0.014273[/C][C]-0.1203[/C][C]0.452307[/C][/ROW]
[ROW][C]46[/C][C]-0.045531[/C][C]-0.3837[/C][C]0.351192[/C][/ROW]
[ROW][C]47[/C][C]-0.058723[/C][C]-0.4948[/C][C]0.31113[/C][/ROW]
[ROW][C]48[/C][C]0.079739[/C][C]0.6719[/C][C]0.251915[/C][/ROW]
[/TABLE]
Source: https://freestatistics.org/blog/index.php?pk=234238&T=1

Globally Unique Identifier (entire table): ba.freestatistics.org/blog/index.php?pk=234238&T=1

As an alternative you can also use a QR Code:  

The GUIDs for individual cells are displayed in the table below:

Autocorrelation Function
Time lag kACF(k)T-STATP-value
1-0.240896-2.02980.023061
2-0.130462-1.09930.137678
30.0698640.58870.278972
4-0.118671-0.99990.160368
50.0948410.79910.213436
6-0.276216-2.32740.011399
70.1794861.51240.067439
8-0.130641-1.10080.13735
9-0.026185-0.22060.413004
10-0.050967-0.42950.334447
11-0.168545-1.42020.079965
120.6039615.08911e-06
13-0.10615-0.89440.187054
140.0313340.2640.396264
15-0.111501-0.93950.175324
16-0.096206-0.81060.210138
170.160391.35150.090417
18-0.227856-1.920.029441
190.0802380.67610.250588
20-0.048956-0.41250.340605
210.0545890.460.323469
22-0.125642-1.05870.146667
23-0.140594-1.18470.12005
240.4581153.86010.000124
25-0.101739-0.85730.197091
260.0942250.7940.214933
27-0.125788-1.05990.14639
28-0.063072-0.53150.298381
290.1197231.00880.158248
30-0.19592-1.65090.051593
310.0810280.68280.248491
32-0.038711-0.32620.372622
330.0391090.32950.371358
34-0.094732-0.79820.213701
35-0.134802-1.13590.129916
360.2756732.32290.011528
37-0.024616-0.20740.418139
380.0586210.4940.311432
39-0.111295-0.93780.175767
40-0.025714-0.21670.414544
410.0797670.67210.251841
42-0.130727-1.10150.137194
430.0595450.50170.308703
440.0219770.18520.426808
45-0.014273-0.12030.452307
46-0.045531-0.38370.351192
47-0.058723-0.49480.31113
480.0797390.67190.251915


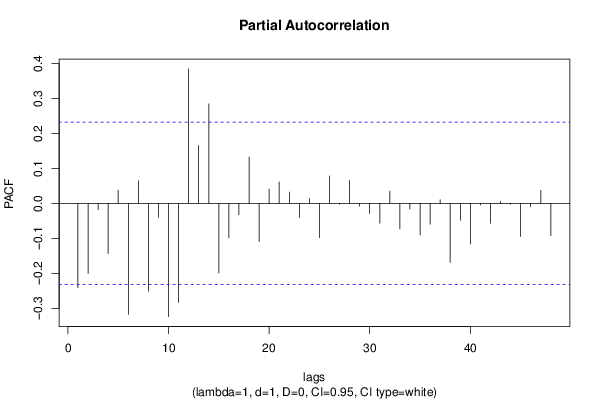
Partial Autocorrelation Function
Time lag kPACF(k)T-STATP-value
1-0.240896-2.02980.023061
2-0.200105-1.68610.048082
3-0.017758-0.14960.44074
4-0.143013-1.2050.116093
50.0383650.32330.373721
6-0.317483-2.67520.004633
70.0651410.54890.292402
8-0.251328-2.11770.018851
9-0.039763-0.3350.369289
10-0.324014-2.73020.003988
11-0.283458-2.38850.00979
120.3850983.24490.000897
130.166081.39940.083021
140.2851592.40280.009443
15-0.199153-1.67810.048863
16-0.098341-0.82860.205043
17-0.032252-0.27180.393298
180.132711.11820.133618
19-0.109149-0.91970.18042
200.0410.34550.365382
210.0615790.51890.302731
220.0324250.27320.39274
23-0.040246-0.33910.367761
240.0139850.11780.453263
25-0.097862-0.82460.206181
260.0785190.66160.255182
27-0.002461-0.02070.491757
280.0655840.55260.291131
29-0.007634-0.06430.474446
30-0.028705-0.24190.404787
31-0.05626-0.47410.318459
320.0354740.29890.382942
33-0.072448-0.61050.271755
34-0.015785-0.1330.447281
35-0.090103-0.75920.225117
36-0.059386-0.50040.309172
370.010710.09020.464173
38-0.168357-1.41860.080195
39-0.048058-0.40490.343367
40-0.115715-0.9750.166428
41-0.004616-0.03890.484542
42-0.056513-0.47620.317702
430.0064960.05470.478252
44-0.002026-0.01710.493214
45-0.094794-0.79870.213551
46-0.009683-0.08160.467602
470.0375860.31670.376199
48-0.091914-0.77450.22061

\begin{tabular}{lllllllll}
\hline
Partial Autocorrelation Function \tabularnewline
Time lag k & PACF(k) & T-STAT & P-value \tabularnewline
1 & -0.240896 & -2.0298 & 0.023061 \tabularnewline
2 & -0.200105 & -1.6861 & 0.048082 \tabularnewline
3 & -0.017758 & -0.1496 & 0.44074 \tabularnewline
4 & -0.143013 & -1.205 & 0.116093 \tabularnewline
5 & 0.038365 & 0.3233 & 0.373721 \tabularnewline
6 & -0.317483 & -2.6752 & 0.004633 \tabularnewline
7 & 0.065141 & 0.5489 & 0.292402 \tabularnewline
8 & -0.251328 & -2.1177 & 0.018851 \tabularnewline
9 & -0.039763 & -0.335 & 0.369289 \tabularnewline
10 & -0.324014 & -2.7302 & 0.003988 \tabularnewline
11 & -0.283458 & -2.3885 & 0.00979 \tabularnewline
12 & 0.385098 & 3.2449 & 0.000897 \tabularnewline
13 & 0.16608 & 1.3994 & 0.083021 \tabularnewline
14 & 0.285159 & 2.4028 & 0.009443 \tabularnewline
15 & -0.199153 & -1.6781 & 0.048863 \tabularnewline
16 & -0.098341 & -0.8286 & 0.205043 \tabularnewline
17 & -0.032252 & -0.2718 & 0.393298 \tabularnewline
18 & 0.13271 & 1.1182 & 0.133618 \tabularnewline
19 & -0.109149 & -0.9197 & 0.18042 \tabularnewline
20 & 0.041 & 0.3455 & 0.365382 \tabularnewline
21 & 0.061579 & 0.5189 & 0.302731 \tabularnewline
22 & 0.032425 & 0.2732 & 0.39274 \tabularnewline
23 & -0.040246 & -0.3391 & 0.367761 \tabularnewline
24 & 0.013985 & 0.1178 & 0.453263 \tabularnewline
25 & -0.097862 & -0.8246 & 0.206181 \tabularnewline
26 & 0.078519 & 0.6616 & 0.255182 \tabularnewline
27 & -0.002461 & -0.0207 & 0.491757 \tabularnewline
28 & 0.065584 & 0.5526 & 0.291131 \tabularnewline
29 & -0.007634 & -0.0643 & 0.474446 \tabularnewline
30 & -0.028705 & -0.2419 & 0.404787 \tabularnewline
31 & -0.05626 & -0.4741 & 0.318459 \tabularnewline
32 & 0.035474 & 0.2989 & 0.382942 \tabularnewline
33 & -0.072448 & -0.6105 & 0.271755 \tabularnewline
34 & -0.015785 & -0.133 & 0.447281 \tabularnewline
35 & -0.090103 & -0.7592 & 0.225117 \tabularnewline
36 & -0.059386 & -0.5004 & 0.309172 \tabularnewline
37 & 0.01071 & 0.0902 & 0.464173 \tabularnewline
38 & -0.168357 & -1.4186 & 0.080195 \tabularnewline
39 & -0.048058 & -0.4049 & 0.343367 \tabularnewline
40 & -0.115715 & -0.975 & 0.166428 \tabularnewline
41 & -0.004616 & -0.0389 & 0.484542 \tabularnewline
42 & -0.056513 & -0.4762 & 0.317702 \tabularnewline
43 & 0.006496 & 0.0547 & 0.478252 \tabularnewline
44 & -0.002026 & -0.0171 & 0.493214 \tabularnewline
45 & -0.094794 & -0.7987 & 0.213551 \tabularnewline
46 & -0.009683 & -0.0816 & 0.467602 \tabularnewline
47 & 0.037586 & 0.3167 & 0.376199 \tabularnewline
48 & -0.091914 & -0.7745 & 0.22061 \tabularnewline
\hline
\end{tabular}
%Source: https://freestatistics.org/blog/index.php?pk=234238&T=2

[TABLE]
[ROW][C]Partial Autocorrelation Function[/C][/ROW]
[ROW][C]Time lag k[/C][C]PACF(k)[/C][C]T-STAT[/C][C]P-value[/C][/ROW]
[ROW][C]1[/C][C]-0.240896[/C][C]-2.0298[/C][C]0.023061[/C][/ROW]
[ROW][C]2[/C][C]-0.200105[/C][C]-1.6861[/C][C]0.048082[/C][/ROW]
[ROW][C]3[/C][C]-0.017758[/C][C]-0.1496[/C][C]0.44074[/C][/ROW]
[ROW][C]4[/C][C]-0.143013[/C][C]-1.205[/C][C]0.116093[/C][/ROW]
[ROW][C]5[/C][C]0.038365[/C][C]0.3233[/C][C]0.373721[/C][/ROW]
[ROW][C]6[/C][C]-0.317483[/C][C]-2.6752[/C][C]0.004633[/C][/ROW]
[ROW][C]7[/C][C]0.065141[/C][C]0.5489[/C][C]0.292402[/C][/ROW]
[ROW][C]8[/C][C]-0.251328[/C][C]-2.1177[/C][C]0.018851[/C][/ROW]
[ROW][C]9[/C][C]-0.039763[/C][C]-0.335[/C][C]0.369289[/C][/ROW]
[ROW][C]10[/C][C]-0.324014[/C][C]-2.7302[/C][C]0.003988[/C][/ROW]
[ROW][C]11[/C][C]-0.283458[/C][C]-2.3885[/C][C]0.00979[/C][/ROW]
[ROW][C]12[/C][C]0.385098[/C][C]3.2449[/C][C]0.000897[/C][/ROW]
[ROW][C]13[/C][C]0.16608[/C][C]1.3994[/C][C]0.083021[/C][/ROW]
[ROW][C]14[/C][C]0.285159[/C][C]2.4028[/C][C]0.009443[/C][/ROW]
[ROW][C]15[/C][C]-0.199153[/C][C]-1.6781[/C][C]0.048863[/C][/ROW]
[ROW][C]16[/C][C]-0.098341[/C][C]-0.8286[/C][C]0.205043[/C][/ROW]
[ROW][C]17[/C][C]-0.032252[/C][C]-0.2718[/C][C]0.393298[/C][/ROW]
[ROW][C]18[/C][C]0.13271[/C][C]1.1182[/C][C]0.133618[/C][/ROW]
[ROW][C]19[/C][C]-0.109149[/C][C]-0.9197[/C][C]0.18042[/C][/ROW]
[ROW][C]20[/C][C]0.041[/C][C]0.3455[/C][C]0.365382[/C][/ROW]
[ROW][C]21[/C][C]0.061579[/C][C]0.5189[/C][C]0.302731[/C][/ROW]
[ROW][C]22[/C][C]0.032425[/C][C]0.2732[/C][C]0.39274[/C][/ROW]
[ROW][C]23[/C][C]-0.040246[/C][C]-0.3391[/C][C]0.367761[/C][/ROW]
[ROW][C]24[/C][C]0.013985[/C][C]0.1178[/C][C]0.453263[/C][/ROW]
[ROW][C]25[/C][C]-0.097862[/C][C]-0.8246[/C][C]0.206181[/C][/ROW]
[ROW][C]26[/C][C]0.078519[/C][C]0.6616[/C][C]0.255182[/C][/ROW]
[ROW][C]27[/C][C]-0.002461[/C][C]-0.0207[/C][C]0.491757[/C][/ROW]
[ROW][C]28[/C][C]0.065584[/C][C]0.5526[/C][C]0.291131[/C][/ROW]
[ROW][C]29[/C][C]-0.007634[/C][C]-0.0643[/C][C]0.474446[/C][/ROW]
[ROW][C]30[/C][C]-0.028705[/C][C]-0.2419[/C][C]0.404787[/C][/ROW]
[ROW][C]31[/C][C]-0.05626[/C][C]-0.4741[/C][C]0.318459[/C][/ROW]
[ROW][C]32[/C][C]0.035474[/C][C]0.2989[/C][C]0.382942[/C][/ROW]
[ROW][C]33[/C][C]-0.072448[/C][C]-0.6105[/C][C]0.271755[/C][/ROW]
[ROW][C]34[/C][C]-0.015785[/C][C]-0.133[/C][C]0.447281[/C][/ROW]
[ROW][C]35[/C][C]-0.090103[/C][C]-0.7592[/C][C]0.225117[/C][/ROW]
[ROW][C]36[/C][C]-0.059386[/C][C]-0.5004[/C][C]0.309172[/C][/ROW]
[ROW][C]37[/C][C]0.01071[/C][C]0.0902[/C][C]0.464173[/C][/ROW]
[ROW][C]38[/C][C]-0.168357[/C][C]-1.4186[/C][C]0.080195[/C][/ROW]
[ROW][C]39[/C][C]-0.048058[/C][C]-0.4049[/C][C]0.343367[/C][/ROW]
[ROW][C]40[/C][C]-0.115715[/C][C]-0.975[/C][C]0.166428[/C][/ROW]
[ROW][C]41[/C][C]-0.004616[/C][C]-0.0389[/C][C]0.484542[/C][/ROW]
[ROW][C]42[/C][C]-0.056513[/C][C]-0.4762[/C][C]0.317702[/C][/ROW]
[ROW][C]43[/C][C]0.006496[/C][C]0.0547[/C][C]0.478252[/C][/ROW]
[ROW][C]44[/C][C]-0.002026[/C][C]-0.0171[/C][C]0.493214[/C][/ROW]
[ROW][C]45[/C][C]-0.094794[/C][C]-0.7987[/C][C]0.213551[/C][/ROW]
[ROW][C]46[/C][C]-0.009683[/C][C]-0.0816[/C][C]0.467602[/C][/ROW]
[ROW][C]47[/C][C]0.037586[/C][C]0.3167[/C][C]0.376199[/C][/ROW]
[ROW][C]48[/C][C]-0.091914[/C][C]-0.7745[/C][C]0.22061[/C][/ROW]
[/TABLE]
Source: https://freestatistics.org/blog/index.php?pk=234238&T=2

Globally Unique Identifier (entire table): ba.freestatistics.org/blog/index.php?pk=234238&T=2

As an alternative you can also use a QR Code:  

The GUIDs for individual cells are displayed in the table below:

Partial Autocorrelation Function
Time lag kPACF(k)T-STATP-value
1-0.240896-2.02980.023061
2-0.200105-1.68610.048082
3-0.017758-0.14960.44074
4-0.143013-1.2050.116093
50.0383650.32330.373721
6-0.317483-2.67520.004633
70.0651410.54890.292402
8-0.251328-2.11770.018851
9-0.039763-0.3350.369289
10-0.324014-2.73020.003988
11-0.283458-2.38850.00979
120.3850983.24490.000897
130.166081.39940.083021
140.2851592.40280.009443
15-0.199153-1.67810.048863
16-0.098341-0.82860.205043
17-0.032252-0.27180.393298
180.132711.11820.133618
19-0.109149-0.91970.18042
200.0410.34550.365382
210.0615790.51890.302731
220.0324250.27320.39274
23-0.040246-0.33910.367761
240.0139850.11780.453263
25-0.097862-0.82460.206181
260.0785190.66160.255182
27-0.002461-0.02070.491757
280.0655840.55260.291131
29-0.007634-0.06430.474446
30-0.028705-0.24190.404787
31-0.05626-0.47410.318459
320.0354740.29890.382942
33-0.072448-0.61050.271755
34-0.015785-0.1330.447281
35-0.090103-0.75920.225117
36-0.059386-0.50040.309172
370.010710.09020.464173
38-0.168357-1.41860.080195
39-0.048058-0.40490.343367
40-0.115715-0.9750.166428
41-0.004616-0.03890.484542
42-0.056513-0.47620.317702
430.0064960.05470.478252
44-0.002026-0.01710.493214
45-0.094794-0.79870.213551
46-0.009683-0.08160.467602
470.0375860.31670.376199
48-0.091914-0.77450.22061


Parameters (Session):
par1 = 48 ; par2 = 1 ; par3 = 1 ; par4 = 0 ; par5 = 12 ; par6 = White Noise ; par7 = 0.95 ;
Parameters (R input):
par1 = 48 ; par2 = 1 ; par3 = 1 ; par4 = 0 ; par5 = 12 ; par6 = White Noise ; par7 = 0.95 ; par8 = ;
R code (references can be found in the software module):
par8 <- ''
par7 <- '0.95'
par6 <- 'White Noise'
par5 <- '12'
par4 <- '0'
par3 <- '0'
par2 <- '1'
par1 <- '48'
if (par1 == 'Default') {
par1 = 10*log10(length(x))
} else {
par1 <- as.numeric(par1)
}
par2 <- as.numeric(par2)
par3 <- as.numeric(par3)
par4 <- as.numeric(par4)
par5 <- as.numeric(par5)
if (par6 == 'White Noise') par6 <- 'white' else par6 <- 'ma'
par7 <- as.numeric(par7)
if (par8 != '') par8 <- as.numeric(par8)
ox <- x
if (par8 == '') {
if (par2 == 0) {
x <- log(x)
} else {
x <- (x ^ par2 - 1) / par2
}
} else {
x <- log(x,base=par8)
}
if (par3 > 0) x <- diff(x,lag=1,difference=par3)
if (par4 > 0) x <- diff(x,lag=par5,difference=par4)
bitmap(file='picts.png')
op <- par(mfrow=c(2,1))
plot(ox,type='l',main='Original Time Series',xlab='time',ylab='value')
if (par8=='') {
mytitle <- paste('Working Time Series (lambda=',par2,', d=',par3,', D=',par4,')',sep='')
mysub <- paste('(lambda=',par2,', d=',par3,', D=',par4,', CI=', par7, ', CI type=',par6,')',sep='')
} else {
mytitle <- paste('Working Time Series (base=',par8,', d=',par3,', D=',par4,')',sep='')
mysub <- paste('(base=',par8,', d=',par3,', D=',par4,', CI=', par7, ', CI type=',par6,')',sep='')
}
plot(x,type='l', main=mytitle,xlab='time',ylab='value')
par(op)
dev.off()
bitmap(file='pic1.png')
racf <- acf(x, par1, main='Autocorrelation', xlab='time lag', ylab='ACF', ci.type=par6, ci=par7, sub=mysub)
dev.off()
bitmap(file='pic2.png')
rpacf <- pacf(x,par1,main='Partial Autocorrelation',xlab='lags',ylab='PACF',sub=mysub)
dev.off()
(myacf <- c(racf$acf))
(mypacf <- c(rpacf$acf))
lengthx <- length(x)
sqrtn <- sqrt(lengthx)
load(file='createtable')
a<-table.start()
a<-table.row.start(a)
a<-table.element(a,'Autocorrelation Function',4,TRUE)
a<-table.row.end(a)
a<-table.row.start(a)
a<-table.element(a,'Time lag k',header=TRUE)
a<-table.element(a,hyperlink('basics.htm','ACF(k)','click here for more information about the Autocorrelation Function'),header=TRUE)
a<-table.element(a,'T-STAT',header=TRUE)
a<-table.element(a,'P-value',header=TRUE)
a<-table.row.end(a)
for (i in 2:(par1+1)) {
a<-table.row.start(a)
a<-table.element(a,i-1,header=TRUE)
a<-table.element(a,round(myacf[i],6))
mytstat <- myacf[i]*sqrtn
a<-table.element(a,round(mytstat,4))
a<-table.element(a,round(1-pt(abs(mytstat),lengthx),6))
a<-table.row.end(a)
}
a<-table.end(a)
table.save(a,file='mytable.tab')
a<-table.start()
a<-table.row.start(a)
a<-table.element(a,'Partial Autocorrelation Function',4,TRUE)
a<-table.row.end(a)
a<-table.row.start(a)
a<-table.element(a,'Time lag k',header=TRUE)
a<-table.element(a,hyperlink('basics.htm','PACF(k)','click here for more information about the Partial Autocorrelation Function'),header=TRUE)
a<-table.element(a,'T-STAT',header=TRUE)
a<-table.element(a,'P-value',header=TRUE)
a<-table.row.end(a)
for (i in 1:par1) {
a<-table.row.start(a)
a<-table.element(a,i,header=TRUE)
a<-table.element(a,round(mypacf[i],6))
mytstat <- mypacf[i]*sqrtn
a<-table.element(a,round(mytstat,4))
a<-table.element(a,round(1-pt(abs(mytstat),lengthx),6))
a<-table.row.end(a)
}
a<-table.end(a)
table.save(a,file='mytable1.tab')