Free Statistics

of Irreproducible Research!

Author's title

Author*Unverified author*
R Software Modulerwasp_multipleregression.wasp
Title produced by softwareMultiple Regression
Date of computationSun, 13 Dec 2015 18:27:55 +0000
Cite this page as followsStatistical Computations at FreeStatistics.org, Office for Research Development and Education, URL https://freestatistics.org/blog/index.php?v=date/2015/Dec/13/t1450034205gbt4q30kb62is8d.htm/, Retrieved Thu, 16 May 2024 10:46:05 +0000
Statistical Computations at FreeStatistics.org, Office for Research Development and Education, URL https://freestatistics.org/blog/index.php?pk=286229, Retrieved Thu, 16 May 2024 10:46:05 +0000
QR Codes:

Original text written by user:
IsPrivate?No (this computation is public)
User-defined keywords
Estimated Impact97
Family? (F = Feedback message, R = changed R code, M = changed R Module, P = changed Parameters, D = changed Data)
-     [Multiple Regression] [] [2015-11-25 14:21:14] [32b17a345b130fdf5cc88718ed94a974]
- RMPD  [Multiple Regression] [Computatie orkanen] [2015-12-13 14:12:23] [74be16979710d4c4e7c6647856088456]
- R P       [Multiple Regression] [Orkanen] [2015-12-13 18:27:55] [d41d8cd98f00b204e9800998ecf8427e] [Current]
Feedback Forum

Post a new message
Dataseries X:
14.15	0
13.95	0
13.96	0
13.99	0
14.08	1
14.03	0
13.93	1
13.95	2
13.94	3
14.01	1
13.98	1
13.84	0
14.16	0
13.92	0
13.97	0
14.00	0
14.00	0
13.87	0
13.94	0
13.98	3
13.95	7
14.01	2
13.96	1
13.88	0
13.76	0
13.79	0
13.97	0
13.84	0
13.94	0
13.97	0
13.92	0
13.87	4
13.90	3
13.85	6
13.70	0
13.87	0
13.74	0
13.64	0
13.83	0
13.88	0
14.01	1
13.98	0
14.02	0
14.10	3
14.11	4
14.14	2
14.04	0
14.19	0
14.17	0
14.14	1
13.94	0
14.09	0
14.06	0
14.07	0
14.07	0
14.07	2
14.05	2
13.99	2
13.85	0
13.95	0
14.13	0
14.20	0
14.20	0
14.18	0
14.13	1
14.07	0
14.06	0
14.07	3
14.10	3
14.10	4
14.00	1
14.16	1
13.85	0
13.97	0
13.91	0
13.90	0
13.83	0
13.90	1
13.79	1
13.88	2
13.94	4
13.95	1
14.08	1
13.87	1
14.16	0
13.90	0
13.74	0
13.82	0
13.82	0
13.88	0
13.90	1
14.04	4
13.92	5
13.96	2
13.80	0
13.74	0
13.84	0
13.71	0
13.78	0
13.78	0
13.76	0
13.81	1
13.87	1
13.76	1
13.82	3
13.82	1
13.83	0
13.91	0
13.92	0
14.00	0
13.99	0
14.01	0
14.09	0
14.13	2
14.03	0
14.10	1
14.05	3
14.02	1
14.11	0
14.21	0
14.38	0
14.23	0
14.10	0
14.04	0
14.12	0
14.00	1
14.11	0
14.03	4
14.03	4
14.04	1
14.06	0
14.10	0
14.11	0
14.12	0
14.24	0
14.17	0
14.08	1
14.07	2
14.09	1
14.02	1
14.01	3
13.98	2
13.92	0
14.03	0
14.01	0
14.19	0
13.73	0
13.92	0
13.94	0
14.03	1
14.04	2
14.03	2
14.07	2
14.04	0
13.93	0
14.17	0
14.06	0
14.20	0
14.16	0
14.11	0
14.16	0
14.13	0
14.01	1
14.05	0
14.04	6
14.10	2
14.05	3
14.02	1
14.11	0
14.21	0
14.38	0
14.23	0
14.10	0
14.04	0
14.12	0
14.00	1
14.11	0
14.03	4
14.03	4
14.04	1
14.06	0
14.10	0
14.11	0
14.12	0
14.24	0
14.17	0
14.08	1
14.07	2
14.09	1
14.02	1
14.01	3
13.98	2
13.92	0
14.03	0
14.01	0
14.19	0
13.73	0
13.92	0
13.94	0
14.03	1
14.04	2
14.03	2
14.07	2
14.04	0
13.93	0
14.17	0
14.06	0
14.20	0
14.16	0
14.11	0
14.16	0
14.13	0
14.01	1
14.05	0
14.04	6
14.03	2
14.04	2
13.90	0
14.09	0
14.16	0
14.09	0
14.08	0
13.95	0
14.01	0
14.00	0
13.99	2
14.00	2
14.02	1
14.06	0
14.02	0
13.97	0
14.19	0
13.97	0
13.98	0
14.03	0
14.04	0
14.13	1
14.22	1
14.21	5
14.15	2
14.17	0
14.03	0
14.02	0
13.91	0
13.81	0
13.78	0
13.83	0
13.96	1
13.90	1
14.10	1
13.99	0
13.90	0
13.88	0
13.89	0
14.03	0
14.19	0
14.16	0
14.10	0
14.03	1
14.06	5
14.07	6
14.11	5
14.17	1
14.23	0
14.11	0
14.25	0
14.03	0
14.07	0
13.99	1
14.01	0
13.98	2
13.93	2
14.06	3
13.98	2
14.00	0
13.86	0
13.98	0
13.80	0
13.80	0
13.89	0
13.88	0
13.78	0
13.89	1
13.93	4
13.95	6
13.92	1
13.96	1
13.91	0
13.76	0
13.79	0
13.99	0
13.99	0
13.99	1
14.04	1
14.01	0
14.13	2
14.01	2
14.07	0
14.04	1
14.18	0
14.26	0
14.31	0
14.26	0
14.20	0
14.18	0
14.14	0
14.08	2
14.00	2
14.04	2
14.08	2
14.00	0
13.94	0
13.83	0
13.75	0
13.92	0
13.91	0
13.91	0
13.90	1
13.95	1
14.02	4
13.89	4
13.89	1
13.89	0
13.87	0
14.03	0
13.96	0
14.06	0
13.98	0
14.08	0
13.95	1
13.95	1
13.84	2
13.94	3
13.88	1
13.83	0
13.80	1
13.92	0
13.90	0
13.73	0
13.87	0
13.76	1
13.86	0
13.90	1
13.85	6
13.90	2
13.75	1
13.87	0
13.97	0
13.97	0
14.14	0
14.18	0
14.17	0
14.20	0
14.17	0
14.15	0
14.10	1
14.04	3
14.01	2
14.15	0
14.03	0
14.04	1
14.05	0
14.12	0
14.09	0
13.98	0
13.94	0
14.04	1
13.86	4
14.03	3
13.99	3
14.08	0
14.01	0
14.04	0
13.90	0
14.09	0
14.04	0
13.97	0
14.08	1
13.99	2
14.11	3
14.16	2
14.18	1
14.18	0
14.38	0
14.18	0
14.22	0
14.13	0
14.20	0
14.25	0
14.14	0
14.15	1
14.13	2
14.10	5
14.09	1
14.23	2
14.11	0
14.40	0
14.30	0
14.37	0
14.24	0
14.14	1
14.17	1
14.19	0
14.24	3
14.11	4
14.07	1
14.15	2
14.28	0
14.03	0
14.06	0
13.94	0
14.05	0
14.12	0
14.00	2
14.12	0
13.99	1
14.04	3
14.05	0
14.06	0
14.33	0
14.45	0
14.39	0
14.39	0
14.23	0
14.25	0
14.15	0
14.12	0
14.26	2
14.28	2
14.12	0
14.29	0
14.12	0
14.22	0
14.09	0
14.17	0
14.01	0
14.22	0
13.98	0
14.12	0
14.09	4
14.11	6
14.05	1
13.96	1
13.81	1
14.09	0
13.87	0
14.10	0
14.08	0
14.09	0
14.08	0
13.95	2
14.08	3
14.00	3
14.05	2
13.98	1
14.04	0
14.24	0
14.28	0
14.23	0
14.16	0
14.11	0
14.07	2
14.07	0
14.08	1
14.02	2
14.08	0
14.01	1
14.08	0
14.23	0
14.39	0
14.13	0
14.21	0
14.21	0
14.26	0
14.36	0
14.18	3
14.34	3
14.26	1
14.22	0
14.46	0
14.51	0
14.32	0
14.44	0
14.35	0
14.30	0
14.32	0
14.24	0
14.27	4
14.26	6
14.26	1
14.05	1
14.22	0
14.11	0
14.25	0
14.26	0
14.16	0
14.07	0
14.06	1
14.22	3
14.24	3
14.25	2
14.23	1
14.14	1
14.29	0
14.33	0
14.34	0
14.65	0
14.43	0
14.32	0
14.31	0
14.34	3
14.28	5
14.23	2
14.40	4
14.45	0
14.39	0
14.35	0
14.43	0
14.29	0
14.41	0
14.31	0
14.42	1
14.43	0
14.30	1
14.36	3
14.22	3
14.16	0
14.20	0
14.38	0
14.37	0
14.34	0
14.19	1
14.22	0
14.15	0
14.00	0
14.01	1
13.94	4
14.00	1
13.93	0
14.13	0
14.28	0
14.26	0
14.30	0
14.18	0
14.18	0
14.10	1
14.09	0
14.03	4
14.02	3
14.16	0
14.00	0
14.14	0
14.28	0
13.94	0
14.25	0
14.26	0
14.22	0
14.29	1
14.20	0
14.19	2
14.25	2
14.38	0
14.37	2
14.29	0
14.44	0
14.70	0
14.44	0
14.34	0
14.11	0
14.33	1
14.46	5
14.37	7
14.24	3
14.42	4
14.37	0
14.26	0
14.23	0
14.43	0
14.25	0
14.20	0
14.21	0
14.18	1
14.30	2
14.32	4
14.16	2
14.15	3
14.28	1
14.31	0
14.27	0
14.31	0
14.46	0
14.33	0
14.31	0
14.43	1
14.28	3
14.36	0
14.45	1
14.50	2
14.55	0
14.53	0
14.55	0
14.83	0
14.56	0
14.58	0
14.59	0
14.59	0
14.67	1
14.60	4
14.43	6
14.42	1
14.40	1
14.51	0
14.45	0
14.64	0
14.27	0
14.28	0
14.23	0
14.28	1
14.26	0
14.27	4
14.25	3
14.30	3
14.32	1
14.37	0
14.21	0
14.49	0
14.46	0
14.50	0
14.30	0
14.31	0
14.28	0
14.37	4
14.29	7
14.21	4
14.21	0
14.19	0
14.38	0
14.40	0
14.56	0
14.42	0
14.47	0
14.45	1
14.46	1
14.45	3
14.45	5
14.43	5
14.68	2
14.47	0
14.74	0
14.75	0
14.81	0
14.54	0
14.51	0
14.43	0
14.53	1
14.43	3
14.46	8
14.48	0
14.51	0
14.33	0


Summary of computational transaction
Raw Inputview raw input (R code)
Raw Outputview raw output of R engine
Computing time5 seconds
R Server'Herman Ole Andreas Wold' @ wold.wessa.net

\begin{tabular}{lllllllll}
\hline
Summary of computational transaction \tabularnewline
Raw Input & view raw input (R code)  \tabularnewline
Raw Output & view raw output of R engine  \tabularnewline
Computing time & 5 seconds \tabularnewline
R Server & 'Herman Ole Andreas Wold' @ wold.wessa.net \tabularnewline
\hline
\end{tabular}
%Source: https://freestatistics.org/blog/index.php?pk=286229&T=0

[TABLE]
[ROW][C]Summary of computational transaction[/C][/ROW]
[ROW][C]Raw Input[/C][C]view raw input (R code) [/C][/ROW]
[ROW][C]Raw Output[/C][C]view raw output of R engine [/C][/ROW]
[ROW][C]Computing time[/C][C]5 seconds[/C][/ROW]
[ROW][C]R Server[/C][C]'Herman Ole Andreas Wold' @ wold.wessa.net[/C][/ROW]
[/TABLE]
Source: https://freestatistics.org/blog/index.php?pk=286229&T=0

Globally Unique Identifier (entire table): ba.freestatistics.org/blog/index.php?pk=286229&T=0

As an alternative you can also use a QR Code:  

The GUIDs for individual cells are displayed in the table below:

Summary of computational transaction
Raw Inputview raw input (R code)
Raw Outputview raw output of R engine
Computing time5 seconds
R Server'Herman Ole Andreas Wold' @ wold.wessa.net


Multiple Linear Regression - Estimated Regression Equation
(1-B12)Orkanen[t] = + 0.802514 -0.210624`(1-B12)Temperatuur`[t] + 2.50995`(1-B12)Temperatuur(t-1)`[t] -1.26653`(1-B12)Temperatuur(t-2)`[t] -1.8753`(1-B12)Temperatuur(t-3)`[t] + 1.30396`(1-B12)Temperatuur(t-4)`[t] + 0.60507`(1-B12)Temperatuur(t-5)`[t] + 2.42454`(1-B12)Temperatuur(t-6)`[t] + 0.895119`(1-B12)Temperatuur(t-7)`[t] + 0.207203`(1-B12)Temperatuur(t-8)`[t] -2.35656`(1-B12)Temperatuur(t-9)`[t] + 3.01161`(1-B12)Temperatuur(t-10)`[t] + 0.507156`(1-B12)Temperatuur(t-11)`[t] -0.480149`(1-B12)Temperatuur(t-1s)`[t] -0.132863`(1-B12)Temperatuur(t-2s)`[t] -3.73125`(1-B12)Temperatuur(t-3s)`[t] -2.70345`(1-B12)Temperatuur(t-4s)`[t] -2.90023`(1-B12)Temperatuur(t-5s)`[t] -3.23915`(1-B12)Temperatuur(t-6s)`[t] -2.71603`(1-B12)Temperatuur(t-7s)`[t] -5.12079`(1-B12)Temperatuur(t-8s)`[t] -4.22133`(1-B12)Temperatuur(t-9s)`[t] -3.91465`(1-B12)Temperatuur(t-10s)`[t] -2.78614`(1-B12)Temperatuur(t-11s)`[t] -3.01174`(1-B12)Temperatuur(t-12s)`[t] -2.51803`(1-B12)Temperatuur(t-13s)`[t] -4.47384`(1-B12)Temperatuur(t-14s)`[t] -3.70526`(1-B12)Temperatuur(t-15s)`[t] -5.30959`(1-B12)Temperatuur(t-16s)`[t] -5.95755`(1-B12)Temperatuur(t-17s)`[t] -6.09997`(1-B12)Temperatuur(t-18s)`[t] -6.85621`(1-B12)Temperatuur(t-19s)`[t] -5.57415`(1-B12)Temperatuur(t-20s)`[t] -1.33241`(1-B12)Temperatuur(t-21s)`[t] -3.59815`(1-B12)Temperatuur(t-22s)`[t] -5.42283`(1-B12)Temperatuur(t-23s)`[t] -7.6951`(1-B12)Temperatuur(t-24s)`[t] -9.23263`(1-B12)Temperatuur(t-25s)`[t] -9.91171`(1-B12)Temperatuur(t-26s)`[t] -5.21857`(1-B12)Temperatuur(t-27s)`[t] -3.04092`(1-B12)Temperatuur(t-28s)`[t] -3.56163`(1-B12)Temperatuur(t-29s)`[t] -1.45061`(1-B12)Temperatuur(t-30s)`[t] -2.23535`(1-B12)Temperatuur(t-31s)`[t] -1.73734`(1-B12)Temperatuur(t-32s)`[t] -4.40359`(1-B12)Temperatuur(t-33s)`[t] -2.9901`(1-B12)Temperatuur(t-34s)`[t] -1.27491`(1-B12)Temperatuur(t-35s)`[t] -1.23295`(1-B12)Temperatuur(t-36s)`[t] -2.11779`(1-B12)Temperatuur(t-37s)`[t] + 0.402629`(1-B12)Temperatuur(t-38s)`[t] -1.29474`(1-B12)Temperatuur(t-39s)`[t] -0.0804179`(1-B12)Temperatuur(t-40s)`[t] -1.5271`(1-B12)Temperatuur(t-41s)`[t] + 0.0503714M1[t] + 0.483343M2[t] + 0.406719M3[t] + 0.358884M4[t] -0.159532M5[t] + 0.145584M6[t] + 0.0507307M7[t] -0.128188M8[t] -0.295958M9[t] + 0.282481M10[t] -0.355514M11[t] + e[t]

\begin{tabular}{lllllllll}
\hline
Multiple Linear Regression - Estimated Regression Equation \tabularnewline
(1-B12)Orkanen[t] =  +  0.802514 -0.210624`(1-B12)Temperatuur`[t] +  2.50995`(1-B12)Temperatuur(t-1)`[t] -1.26653`(1-B12)Temperatuur(t-2)`[t] -1.8753`(1-B12)Temperatuur(t-3)`[t] +  1.30396`(1-B12)Temperatuur(t-4)`[t] +  0.60507`(1-B12)Temperatuur(t-5)`[t] +  2.42454`(1-B12)Temperatuur(t-6)`[t] +  0.895119`(1-B12)Temperatuur(t-7)`[t] +  0.207203`(1-B12)Temperatuur(t-8)`[t] -2.35656`(1-B12)Temperatuur(t-9)`[t] +  3.01161`(1-B12)Temperatuur(t-10)`[t] +  0.507156`(1-B12)Temperatuur(t-11)`[t] -0.480149`(1-B12)Temperatuur(t-1s)`[t] -0.132863`(1-B12)Temperatuur(t-2s)`[t] -3.73125`(1-B12)Temperatuur(t-3s)`[t] -2.70345`(1-B12)Temperatuur(t-4s)`[t] -2.90023`(1-B12)Temperatuur(t-5s)`[t] -3.23915`(1-B12)Temperatuur(t-6s)`[t] -2.71603`(1-B12)Temperatuur(t-7s)`[t] -5.12079`(1-B12)Temperatuur(t-8s)`[t] -4.22133`(1-B12)Temperatuur(t-9s)`[t] -3.91465`(1-B12)Temperatuur(t-10s)`[t] -2.78614`(1-B12)Temperatuur(t-11s)`[t] -3.01174`(1-B12)Temperatuur(t-12s)`[t] -2.51803`(1-B12)Temperatuur(t-13s)`[t] -4.47384`(1-B12)Temperatuur(t-14s)`[t] -3.70526`(1-B12)Temperatuur(t-15s)`[t] -5.30959`(1-B12)Temperatuur(t-16s)`[t] -5.95755`(1-B12)Temperatuur(t-17s)`[t] -6.09997`(1-B12)Temperatuur(t-18s)`[t] -6.85621`(1-B12)Temperatuur(t-19s)`[t] -5.57415`(1-B12)Temperatuur(t-20s)`[t] -1.33241`(1-B12)Temperatuur(t-21s)`[t] -3.59815`(1-B12)Temperatuur(t-22s)`[t] -5.42283`(1-B12)Temperatuur(t-23s)`[t] -7.6951`(1-B12)Temperatuur(t-24s)`[t] -9.23263`(1-B12)Temperatuur(t-25s)`[t] -9.91171`(1-B12)Temperatuur(t-26s)`[t] -5.21857`(1-B12)Temperatuur(t-27s)`[t] -3.04092`(1-B12)Temperatuur(t-28s)`[t] -3.56163`(1-B12)Temperatuur(t-29s)`[t] -1.45061`(1-B12)Temperatuur(t-30s)`[t] -2.23535`(1-B12)Temperatuur(t-31s)`[t] -1.73734`(1-B12)Temperatuur(t-32s)`[t] -4.40359`(1-B12)Temperatuur(t-33s)`[t] -2.9901`(1-B12)Temperatuur(t-34s)`[t] -1.27491`(1-B12)Temperatuur(t-35s)`[t] -1.23295`(1-B12)Temperatuur(t-36s)`[t] -2.11779`(1-B12)Temperatuur(t-37s)`[t] +  0.402629`(1-B12)Temperatuur(t-38s)`[t] -1.29474`(1-B12)Temperatuur(t-39s)`[t] -0.0804179`(1-B12)Temperatuur(t-40s)`[t] -1.5271`(1-B12)Temperatuur(t-41s)`[t] +  0.0503714M1[t] +  0.483343M2[t] +  0.406719M3[t] +  0.358884M4[t] -0.159532M5[t] +  0.145584M6[t] +  0.0507307M7[t] -0.128188M8[t] -0.295958M9[t] +  0.282481M10[t] -0.355514M11[t]  + e[t] \tabularnewline
 \tabularnewline
\hline
\end{tabular}
%Source: https://freestatistics.org/blog/index.php?pk=286229&T=1

[TABLE]
[ROW][C]Multiple Linear Regression - Estimated Regression Equation[/C][/ROW]
[ROW][C](1-B12)Orkanen[t] =  +  0.802514 -0.210624`(1-B12)Temperatuur`[t] +  2.50995`(1-B12)Temperatuur(t-1)`[t] -1.26653`(1-B12)Temperatuur(t-2)`[t] -1.8753`(1-B12)Temperatuur(t-3)`[t] +  1.30396`(1-B12)Temperatuur(t-4)`[t] +  0.60507`(1-B12)Temperatuur(t-5)`[t] +  2.42454`(1-B12)Temperatuur(t-6)`[t] +  0.895119`(1-B12)Temperatuur(t-7)`[t] +  0.207203`(1-B12)Temperatuur(t-8)`[t] -2.35656`(1-B12)Temperatuur(t-9)`[t] +  3.01161`(1-B12)Temperatuur(t-10)`[t] +  0.507156`(1-B12)Temperatuur(t-11)`[t] -0.480149`(1-B12)Temperatuur(t-1s)`[t] -0.132863`(1-B12)Temperatuur(t-2s)`[t] -3.73125`(1-B12)Temperatuur(t-3s)`[t] -2.70345`(1-B12)Temperatuur(t-4s)`[t] -2.90023`(1-B12)Temperatuur(t-5s)`[t] -3.23915`(1-B12)Temperatuur(t-6s)`[t] -2.71603`(1-B12)Temperatuur(t-7s)`[t] -5.12079`(1-B12)Temperatuur(t-8s)`[t] -4.22133`(1-B12)Temperatuur(t-9s)`[t] -3.91465`(1-B12)Temperatuur(t-10s)`[t] -2.78614`(1-B12)Temperatuur(t-11s)`[t] -3.01174`(1-B12)Temperatuur(t-12s)`[t] -2.51803`(1-B12)Temperatuur(t-13s)`[t] -4.47384`(1-B12)Temperatuur(t-14s)`[t] -3.70526`(1-B12)Temperatuur(t-15s)`[t] -5.30959`(1-B12)Temperatuur(t-16s)`[t] -5.95755`(1-B12)Temperatuur(t-17s)`[t] -6.09997`(1-B12)Temperatuur(t-18s)`[t] -6.85621`(1-B12)Temperatuur(t-19s)`[t] -5.57415`(1-B12)Temperatuur(t-20s)`[t] -1.33241`(1-B12)Temperatuur(t-21s)`[t] -3.59815`(1-B12)Temperatuur(t-22s)`[t] -5.42283`(1-B12)Temperatuur(t-23s)`[t] -7.6951`(1-B12)Temperatuur(t-24s)`[t] -9.23263`(1-B12)Temperatuur(t-25s)`[t] -9.91171`(1-B12)Temperatuur(t-26s)`[t] -5.21857`(1-B12)Temperatuur(t-27s)`[t] -3.04092`(1-B12)Temperatuur(t-28s)`[t] -3.56163`(1-B12)Temperatuur(t-29s)`[t] -1.45061`(1-B12)Temperatuur(t-30s)`[t] -2.23535`(1-B12)Temperatuur(t-31s)`[t] -1.73734`(1-B12)Temperatuur(t-32s)`[t] -4.40359`(1-B12)Temperatuur(t-33s)`[t] -2.9901`(1-B12)Temperatuur(t-34s)`[t] -1.27491`(1-B12)Temperatuur(t-35s)`[t] -1.23295`(1-B12)Temperatuur(t-36s)`[t] -2.11779`(1-B12)Temperatuur(t-37s)`[t] +  0.402629`(1-B12)Temperatuur(t-38s)`[t] -1.29474`(1-B12)Temperatuur(t-39s)`[t] -0.0804179`(1-B12)Temperatuur(t-40s)`[t] -1.5271`(1-B12)Temperatuur(t-41s)`[t] +  0.0503714M1[t] +  0.483343M2[t] +  0.406719M3[t] +  0.358884M4[t] -0.159532M5[t] +  0.145584M6[t] +  0.0507307M7[t] -0.128188M8[t] -0.295958M9[t] +  0.282481M10[t] -0.355514M11[t]  + e[t][/C][/ROW]
[ROW][C][/C][/ROW]
[/TABLE]
Source: https://freestatistics.org/blog/index.php?pk=286229&T=1

Globally Unique Identifier (entire table): ba.freestatistics.org/blog/index.php?pk=286229&T=1

As an alternative you can also use a QR Code:  

The GUIDs for individual cells are displayed in the table below:

Multiple Linear Regression - Estimated Regression Equation
(1-B12)Orkanen[t] = + 0.802514 -0.210624`(1-B12)Temperatuur`[t] + 2.50995`(1-B12)Temperatuur(t-1)`[t] -1.26653`(1-B12)Temperatuur(t-2)`[t] -1.8753`(1-B12)Temperatuur(t-3)`[t] + 1.30396`(1-B12)Temperatuur(t-4)`[t] + 0.60507`(1-B12)Temperatuur(t-5)`[t] + 2.42454`(1-B12)Temperatuur(t-6)`[t] + 0.895119`(1-B12)Temperatuur(t-7)`[t] + 0.207203`(1-B12)Temperatuur(t-8)`[t] -2.35656`(1-B12)Temperatuur(t-9)`[t] + 3.01161`(1-B12)Temperatuur(t-10)`[t] + 0.507156`(1-B12)Temperatuur(t-11)`[t] -0.480149`(1-B12)Temperatuur(t-1s)`[t] -0.132863`(1-B12)Temperatuur(t-2s)`[t] -3.73125`(1-B12)Temperatuur(t-3s)`[t] -2.70345`(1-B12)Temperatuur(t-4s)`[t] -2.90023`(1-B12)Temperatuur(t-5s)`[t] -3.23915`(1-B12)Temperatuur(t-6s)`[t] -2.71603`(1-B12)Temperatuur(t-7s)`[t] -5.12079`(1-B12)Temperatuur(t-8s)`[t] -4.22133`(1-B12)Temperatuur(t-9s)`[t] -3.91465`(1-B12)Temperatuur(t-10s)`[t] -2.78614`(1-B12)Temperatuur(t-11s)`[t] -3.01174`(1-B12)Temperatuur(t-12s)`[t] -2.51803`(1-B12)Temperatuur(t-13s)`[t] -4.47384`(1-B12)Temperatuur(t-14s)`[t] -3.70526`(1-B12)Temperatuur(t-15s)`[t] -5.30959`(1-B12)Temperatuur(t-16s)`[t] -5.95755`(1-B12)Temperatuur(t-17s)`[t] -6.09997`(1-B12)Temperatuur(t-18s)`[t] -6.85621`(1-B12)Temperatuur(t-19s)`[t] -5.57415`(1-B12)Temperatuur(t-20s)`[t] -1.33241`(1-B12)Temperatuur(t-21s)`[t] -3.59815`(1-B12)Temperatuur(t-22s)`[t] -5.42283`(1-B12)Temperatuur(t-23s)`[t] -7.6951`(1-B12)Temperatuur(t-24s)`[t] -9.23263`(1-B12)Temperatuur(t-25s)`[t] -9.91171`(1-B12)Temperatuur(t-26s)`[t] -5.21857`(1-B12)Temperatuur(t-27s)`[t] -3.04092`(1-B12)Temperatuur(t-28s)`[t] -3.56163`(1-B12)Temperatuur(t-29s)`[t] -1.45061`(1-B12)Temperatuur(t-30s)`[t] -2.23535`(1-B12)Temperatuur(t-31s)`[t] -1.73734`(1-B12)Temperatuur(t-32s)`[t] -4.40359`(1-B12)Temperatuur(t-33s)`[t] -2.9901`(1-B12)Temperatuur(t-34s)`[t] -1.27491`(1-B12)Temperatuur(t-35s)`[t] -1.23295`(1-B12)Temperatuur(t-36s)`[t] -2.11779`(1-B12)Temperatuur(t-37s)`[t] + 0.402629`(1-B12)Temperatuur(t-38s)`[t] -1.29474`(1-B12)Temperatuur(t-39s)`[t] -0.0804179`(1-B12)Temperatuur(t-40s)`[t] -1.5271`(1-B12)Temperatuur(t-41s)`[t] + 0.0503714M1[t] + 0.483343M2[t] + 0.406719M3[t] + 0.358884M4[t] -0.159532M5[t] + 0.145584M6[t] + 0.0507307M7[t] -0.128188M8[t] -0.295958M9[t] + 0.282481M10[t] -0.355514M11[t] + e[t]


Multiple Linear Regression - Ordinary Least Squares
VariableParameterS.D.T-STATH0: parameter = 02-tail p-value1-tail p-value
(Intercept)+0.8025 1.426+5.6290e-01 0.5751 0.2875
`(1-B12)Temperatuur`-0.2106 1.546-1.3620e-01 0.892 0.446
`(1-B12)Temperatuur(t-1)`+2.51 1.146+2.1900e+00 0.03146 0.01573
`(1-B12)Temperatuur(t-2)`-1.266 1.089-1.1630e+00 0.2483 0.1241
`(1-B12)Temperatuur(t-3)`-1.875 1.047-1.7910e+00 0.07703 0.03852
`(1-B12)Temperatuur(t-4)`+1.304 1.049+1.2430e+00 0.2175 0.1088
`(1-B12)Temperatuur(t-5)`+0.6051 1.064+5.6890e-01 0.571 0.2855
`(1-B12)Temperatuur(t-6)`+2.425 1.011+2.3970e+00 0.01884 0.00942
`(1-B12)Temperatuur(t-7)`+0.8951 1.092+8.1970e-01 0.4148 0.2074
`(1-B12)Temperatuur(t-8)`+0.2072 1.083+1.9130e-01 0.8488 0.4244
`(1-B12)Temperatuur(t-9)`-2.357 1.038-2.2700e+00 0.02589 0.01295
`(1-B12)Temperatuur(t-10)`+3.012 1.105+2.7250e+00 0.007894 0.003947
`(1-B12)Temperatuur(t-11)`+0.5072 1.165+4.3520e-01 0.6646 0.3323
`(1-B12)Temperatuur(t-1s)`-0.4802 2.205-2.1780e-01 0.8282 0.4141
`(1-B12)Temperatuur(t-2s)`-0.1329 2.941-4.5170e-02 0.9641 0.482
`(1-B12)Temperatuur(t-3s)`-3.731 3.459-1.0790e+00 0.2839 0.142
`(1-B12)Temperatuur(t-4s)`-2.703 3.895-6.9400e-01 0.4897 0.2448
`(1-B12)Temperatuur(t-5s)`-2.9 4.371-6.6350e-01 0.5089 0.2545
`(1-B12)Temperatuur(t-6s)`-3.239 4.907-6.6010e-01 0.5111 0.2556
`(1-B12)Temperatuur(t-7s)`-2.716 5.431-5.0010e-01 0.6183 0.3092
`(1-B12)Temperatuur(t-8s)`-5.121 6.286-8.1460e-01 0.4177 0.2089
`(1-B12)Temperatuur(t-9s)`-4.221 6.857-6.1560e-01 0.5399 0.2699
`(1-B12)Temperatuur(t-10s)`-3.915 7.302-5.3610e-01 0.5934 0.2967
`(1-B12)Temperatuur(t-11s)`-2.786 7.678-3.6290e-01 0.7177 0.3588
`(1-B12)Temperatuur(t-12s)`-3.012 7.911-3.8070e-01 0.7044 0.3522
`(1-B12)Temperatuur(t-13s)`-2.518 8.207-3.0680e-01 0.7598 0.3799
`(1-B12)Temperatuur(t-14s)`-4.474 8.3-5.3900e-01 0.5914 0.2957
`(1-B12)Temperatuur(t-15s)`-3.705 8.081-4.5850e-01 0.6478 0.3239
`(1-B12)Temperatuur(t-16s)`-5.31 7.982-6.6520e-01 0.5079 0.2539
`(1-B12)Temperatuur(t-17s)`-5.958 7.853-7.5870e-01 0.4503 0.2251
`(1-B12)Temperatuur(t-18s)`-6.1 7.668-7.9560e-01 0.4286 0.2143
`(1-B12)Temperatuur(t-19s)`-6.856 7.289-9.4070e-01 0.3497 0.1749
`(1-B12)Temperatuur(t-20s)`-5.574 6.819-8.1750e-01 0.4161 0.208
`(1-B12)Temperatuur(t-21s)`-1.332 6.408-2.0790e-01 0.8358 0.4179
`(1-B12)Temperatuur(t-22s)`-3.598 6.519-5.5190e-01 0.5825 0.2913
`(1-B12)Temperatuur(t-23s)`-5.423 6.629-8.1800e-01 0.4158 0.2079
`(1-B12)Temperatuur(t-24s)`-7.695 6.742-1.1410e+00 0.2571 0.1286
`(1-B12)Temperatuur(t-25s)`-9.233 7.328-1.2600e+00 0.2114 0.1057
`(1-B12)Temperatuur(t-26s)`-9.912 8.087-1.2260e+00 0.2239 0.112
`(1-B12)Temperatuur(t-27s)`-5.219 8.293-6.2930e-01 0.531 0.2655
`(1-B12)Temperatuur(t-28s)`-3.041 8.281-3.6720e-01 0.7144 0.3572
`(1-B12)Temperatuur(t-29s)`-3.562 8.145-4.3730e-01 0.6631 0.3315
`(1-B12)Temperatuur(t-30s)`-1.451 7.885-1.8400e-01 0.8545 0.4272
`(1-B12)Temperatuur(t-31s)`-2.235 7.812-2.8610e-01 0.7755 0.3878
`(1-B12)Temperatuur(t-32s)`-1.737 7.447-2.3330e-01 0.8161 0.4081
`(1-B12)Temperatuur(t-33s)`-4.404 7.003-6.2880e-01 0.5313 0.2656
`(1-B12)Temperatuur(t-34s)`-2.99 6.463-4.6270e-01 0.6449 0.3224
`(1-B12)Temperatuur(t-35s)`-1.275 6.125-2.0810e-01 0.8356 0.4178
`(1-B12)Temperatuur(t-36s)`-1.233 5.958-2.0690e-01 0.8366 0.4183
`(1-B12)Temperatuur(t-37s)`-2.118 5.35-3.9580e-01 0.6933 0.3466
`(1-B12)Temperatuur(t-38s)`+0.4026 4.519+8.9100e-02 0.9292 0.4646
`(1-B12)Temperatuur(t-39s)`-1.295 3.547-3.6500e-01 0.7161 0.358
`(1-B12)Temperatuur(t-40s)`-0.08042 2.697-2.9820e-02 0.9763 0.4881
`(1-B12)Temperatuur(t-41s)`-1.527 1.681-9.0820e-01 0.3665 0.1832
M1+0.05037 0.7282+6.9170e-02 0.945 0.4725
M2+0.4833 1.047+4.6150e-01 0.6457 0.3229
M3+0.4067 1.099+3.7000e-01 0.7123 0.3562
M4+0.3589 1.082+3.3180e-01 0.7409 0.3704
M5-0.1595 0.701-2.2760e-01 0.8205 0.4103
M6+0.1456 0.7092+2.0530e-01 0.8379 0.4189
M7+0.05073 0.7591+6.6830e-02 0.9469 0.4734
M8-0.1282 0.7422-1.7270e-01 0.8633 0.4317
M9-0.296 0.7149-4.1400e-01 0.68 0.34
M10+0.2825 0.7071+3.9950e-01 0.6906 0.3453
M11-0.3555 0.822-4.3250e-01 0.6665 0.3333

\begin{tabular}{lllllllll}
\hline
Multiple Linear Regression - Ordinary Least Squares \tabularnewline
Variable & Parameter & S.D. & T-STATH0: parameter = 0 & 2-tail p-value & 1-tail p-value \tabularnewline
(Intercept) & +0.8025 &  1.426 & +5.6290e-01 &  0.5751 &  0.2875 \tabularnewline
`(1-B12)Temperatuur` & -0.2106 &  1.546 & -1.3620e-01 &  0.892 &  0.446 \tabularnewline
`(1-B12)Temperatuur(t-1)` & +2.51 &  1.146 & +2.1900e+00 &  0.03146 &  0.01573 \tabularnewline
`(1-B12)Temperatuur(t-2)` & -1.266 &  1.089 & -1.1630e+00 &  0.2483 &  0.1241 \tabularnewline
`(1-B12)Temperatuur(t-3)` & -1.875 &  1.047 & -1.7910e+00 &  0.07703 &  0.03852 \tabularnewline
`(1-B12)Temperatuur(t-4)` & +1.304 &  1.049 & +1.2430e+00 &  0.2175 &  0.1088 \tabularnewline
`(1-B12)Temperatuur(t-5)` & +0.6051 &  1.064 & +5.6890e-01 &  0.571 &  0.2855 \tabularnewline
`(1-B12)Temperatuur(t-6)` & +2.425 &  1.011 & +2.3970e+00 &  0.01884 &  0.00942 \tabularnewline
`(1-B12)Temperatuur(t-7)` & +0.8951 &  1.092 & +8.1970e-01 &  0.4148 &  0.2074 \tabularnewline
`(1-B12)Temperatuur(t-8)` & +0.2072 &  1.083 & +1.9130e-01 &  0.8488 &  0.4244 \tabularnewline
`(1-B12)Temperatuur(t-9)` & -2.357 &  1.038 & -2.2700e+00 &  0.02589 &  0.01295 \tabularnewline
`(1-B12)Temperatuur(t-10)` & +3.012 &  1.105 & +2.7250e+00 &  0.007894 &  0.003947 \tabularnewline
`(1-B12)Temperatuur(t-11)` & +0.5072 &  1.165 & +4.3520e-01 &  0.6646 &  0.3323 \tabularnewline
`(1-B12)Temperatuur(t-1s)` & -0.4802 &  2.205 & -2.1780e-01 &  0.8282 &  0.4141 \tabularnewline
`(1-B12)Temperatuur(t-2s)` & -0.1329 &  2.941 & -4.5170e-02 &  0.9641 &  0.482 \tabularnewline
`(1-B12)Temperatuur(t-3s)` & -3.731 &  3.459 & -1.0790e+00 &  0.2839 &  0.142 \tabularnewline
`(1-B12)Temperatuur(t-4s)` & -2.703 &  3.895 & -6.9400e-01 &  0.4897 &  0.2448 \tabularnewline
`(1-B12)Temperatuur(t-5s)` & -2.9 &  4.371 & -6.6350e-01 &  0.5089 &  0.2545 \tabularnewline
`(1-B12)Temperatuur(t-6s)` & -3.239 &  4.907 & -6.6010e-01 &  0.5111 &  0.2556 \tabularnewline
`(1-B12)Temperatuur(t-7s)` & -2.716 &  5.431 & -5.0010e-01 &  0.6183 &  0.3092 \tabularnewline
`(1-B12)Temperatuur(t-8s)` & -5.121 &  6.286 & -8.1460e-01 &  0.4177 &  0.2089 \tabularnewline
`(1-B12)Temperatuur(t-9s)` & -4.221 &  6.857 & -6.1560e-01 &  0.5399 &  0.2699 \tabularnewline
`(1-B12)Temperatuur(t-10s)` & -3.915 &  7.302 & -5.3610e-01 &  0.5934 &  0.2967 \tabularnewline
`(1-B12)Temperatuur(t-11s)` & -2.786 &  7.678 & -3.6290e-01 &  0.7177 &  0.3588 \tabularnewline
`(1-B12)Temperatuur(t-12s)` & -3.012 &  7.911 & -3.8070e-01 &  0.7044 &  0.3522 \tabularnewline
`(1-B12)Temperatuur(t-13s)` & -2.518 &  8.207 & -3.0680e-01 &  0.7598 &  0.3799 \tabularnewline
`(1-B12)Temperatuur(t-14s)` & -4.474 &  8.3 & -5.3900e-01 &  0.5914 &  0.2957 \tabularnewline
`(1-B12)Temperatuur(t-15s)` & -3.705 &  8.081 & -4.5850e-01 &  0.6478 &  0.3239 \tabularnewline
`(1-B12)Temperatuur(t-16s)` & -5.31 &  7.982 & -6.6520e-01 &  0.5079 &  0.2539 \tabularnewline
`(1-B12)Temperatuur(t-17s)` & -5.958 &  7.853 & -7.5870e-01 &  0.4503 &  0.2251 \tabularnewline
`(1-B12)Temperatuur(t-18s)` & -6.1 &  7.668 & -7.9560e-01 &  0.4286 &  0.2143 \tabularnewline
`(1-B12)Temperatuur(t-19s)` & -6.856 &  7.289 & -9.4070e-01 &  0.3497 &  0.1749 \tabularnewline
`(1-B12)Temperatuur(t-20s)` & -5.574 &  6.819 & -8.1750e-01 &  0.4161 &  0.208 \tabularnewline
`(1-B12)Temperatuur(t-21s)` & -1.332 &  6.408 & -2.0790e-01 &  0.8358 &  0.4179 \tabularnewline
`(1-B12)Temperatuur(t-22s)` & -3.598 &  6.519 & -5.5190e-01 &  0.5825 &  0.2913 \tabularnewline
`(1-B12)Temperatuur(t-23s)` & -5.423 &  6.629 & -8.1800e-01 &  0.4158 &  0.2079 \tabularnewline
`(1-B12)Temperatuur(t-24s)` & -7.695 &  6.742 & -1.1410e+00 &  0.2571 &  0.1286 \tabularnewline
`(1-B12)Temperatuur(t-25s)` & -9.233 &  7.328 & -1.2600e+00 &  0.2114 &  0.1057 \tabularnewline
`(1-B12)Temperatuur(t-26s)` & -9.912 &  8.087 & -1.2260e+00 &  0.2239 &  0.112 \tabularnewline
`(1-B12)Temperatuur(t-27s)` & -5.219 &  8.293 & -6.2930e-01 &  0.531 &  0.2655 \tabularnewline
`(1-B12)Temperatuur(t-28s)` & -3.041 &  8.281 & -3.6720e-01 &  0.7144 &  0.3572 \tabularnewline
`(1-B12)Temperatuur(t-29s)` & -3.562 &  8.145 & -4.3730e-01 &  0.6631 &  0.3315 \tabularnewline
`(1-B12)Temperatuur(t-30s)` & -1.451 &  7.885 & -1.8400e-01 &  0.8545 &  0.4272 \tabularnewline
`(1-B12)Temperatuur(t-31s)` & -2.235 &  7.812 & -2.8610e-01 &  0.7755 &  0.3878 \tabularnewline
`(1-B12)Temperatuur(t-32s)` & -1.737 &  7.447 & -2.3330e-01 &  0.8161 &  0.4081 \tabularnewline
`(1-B12)Temperatuur(t-33s)` & -4.404 &  7.003 & -6.2880e-01 &  0.5313 &  0.2656 \tabularnewline
`(1-B12)Temperatuur(t-34s)` & -2.99 &  6.463 & -4.6270e-01 &  0.6449 &  0.3224 \tabularnewline
`(1-B12)Temperatuur(t-35s)` & -1.275 &  6.125 & -2.0810e-01 &  0.8356 &  0.4178 \tabularnewline
`(1-B12)Temperatuur(t-36s)` & -1.233 &  5.958 & -2.0690e-01 &  0.8366 &  0.4183 \tabularnewline
`(1-B12)Temperatuur(t-37s)` & -2.118 &  5.35 & -3.9580e-01 &  0.6933 &  0.3466 \tabularnewline
`(1-B12)Temperatuur(t-38s)` & +0.4026 &  4.519 & +8.9100e-02 &  0.9292 &  0.4646 \tabularnewline
`(1-B12)Temperatuur(t-39s)` & -1.295 &  3.547 & -3.6500e-01 &  0.7161 &  0.358 \tabularnewline
`(1-B12)Temperatuur(t-40s)` & -0.08042 &  2.697 & -2.9820e-02 &  0.9763 &  0.4881 \tabularnewline
`(1-B12)Temperatuur(t-41s)` & -1.527 &  1.681 & -9.0820e-01 &  0.3665 &  0.1832 \tabularnewline
M1 & +0.05037 &  0.7282 & +6.9170e-02 &  0.945 &  0.4725 \tabularnewline
M2 & +0.4833 &  1.047 & +4.6150e-01 &  0.6457 &  0.3229 \tabularnewline
M3 & +0.4067 &  1.099 & +3.7000e-01 &  0.7123 &  0.3562 \tabularnewline
M4 & +0.3589 &  1.082 & +3.3180e-01 &  0.7409 &  0.3704 \tabularnewline
M5 & -0.1595 &  0.701 & -2.2760e-01 &  0.8205 &  0.4103 \tabularnewline
M6 & +0.1456 &  0.7092 & +2.0530e-01 &  0.8379 &  0.4189 \tabularnewline
M7 & +0.05073 &  0.7591 & +6.6830e-02 &  0.9469 &  0.4734 \tabularnewline
M8 & -0.1282 &  0.7422 & -1.7270e-01 &  0.8633 &  0.4317 \tabularnewline
M9 & -0.296 &  0.7149 & -4.1400e-01 &  0.68 &  0.34 \tabularnewline
M10 & +0.2825 &  0.7071 & +3.9950e-01 &  0.6906 &  0.3453 \tabularnewline
M11 & -0.3555 &  0.822 & -4.3250e-01 &  0.6665 &  0.3333 \tabularnewline
\hline
\end{tabular}
%Source: https://freestatistics.org/blog/index.php?pk=286229&T=2

[TABLE]
[ROW][C]Multiple Linear Regression - Ordinary Least Squares[/C][/ROW]
[ROW][C]Variable[/C][C]Parameter[/C][C]S.D.[/C][C]T-STATH0: parameter = 0[/C][C]2-tail p-value[/C][C]1-tail p-value[/C][/ROW]
[ROW][C](Intercept)[/C][C]+0.8025[/C][C] 1.426[/C][C]+5.6290e-01[/C][C] 0.5751[/C][C] 0.2875[/C][/ROW]
[ROW][C]`(1-B12)Temperatuur`[/C][C]-0.2106[/C][C] 1.546[/C][C]-1.3620e-01[/C][C] 0.892[/C][C] 0.446[/C][/ROW]
[ROW][C]`(1-B12)Temperatuur(t-1)`[/C][C]+2.51[/C][C] 1.146[/C][C]+2.1900e+00[/C][C] 0.03146[/C][C] 0.01573[/C][/ROW]
[ROW][C]`(1-B12)Temperatuur(t-2)`[/C][C]-1.266[/C][C] 1.089[/C][C]-1.1630e+00[/C][C] 0.2483[/C][C] 0.1241[/C][/ROW]
[ROW][C]`(1-B12)Temperatuur(t-3)`[/C][C]-1.875[/C][C] 1.047[/C][C]-1.7910e+00[/C][C] 0.07703[/C][C] 0.03852[/C][/ROW]
[ROW][C]`(1-B12)Temperatuur(t-4)`[/C][C]+1.304[/C][C] 1.049[/C][C]+1.2430e+00[/C][C] 0.2175[/C][C] 0.1088[/C][/ROW]
[ROW][C]`(1-B12)Temperatuur(t-5)`[/C][C]+0.6051[/C][C] 1.064[/C][C]+5.6890e-01[/C][C] 0.571[/C][C] 0.2855[/C][/ROW]
[ROW][C]`(1-B12)Temperatuur(t-6)`[/C][C]+2.425[/C][C] 1.011[/C][C]+2.3970e+00[/C][C] 0.01884[/C][C] 0.00942[/C][/ROW]
[ROW][C]`(1-B12)Temperatuur(t-7)`[/C][C]+0.8951[/C][C] 1.092[/C][C]+8.1970e-01[/C][C] 0.4148[/C][C] 0.2074[/C][/ROW]
[ROW][C]`(1-B12)Temperatuur(t-8)`[/C][C]+0.2072[/C][C] 1.083[/C][C]+1.9130e-01[/C][C] 0.8488[/C][C] 0.4244[/C][/ROW]
[ROW][C]`(1-B12)Temperatuur(t-9)`[/C][C]-2.357[/C][C] 1.038[/C][C]-2.2700e+00[/C][C] 0.02589[/C][C] 0.01295[/C][/ROW]
[ROW][C]`(1-B12)Temperatuur(t-10)`[/C][C]+3.012[/C][C] 1.105[/C][C]+2.7250e+00[/C][C] 0.007894[/C][C] 0.003947[/C][/ROW]
[ROW][C]`(1-B12)Temperatuur(t-11)`[/C][C]+0.5072[/C][C] 1.165[/C][C]+4.3520e-01[/C][C] 0.6646[/C][C] 0.3323[/C][/ROW]
[ROW][C]`(1-B12)Temperatuur(t-1s)`[/C][C]-0.4802[/C][C] 2.205[/C][C]-2.1780e-01[/C][C] 0.8282[/C][C] 0.4141[/C][/ROW]
[ROW][C]`(1-B12)Temperatuur(t-2s)`[/C][C]-0.1329[/C][C] 2.941[/C][C]-4.5170e-02[/C][C] 0.9641[/C][C] 0.482[/C][/ROW]
[ROW][C]`(1-B12)Temperatuur(t-3s)`[/C][C]-3.731[/C][C] 3.459[/C][C]-1.0790e+00[/C][C] 0.2839[/C][C] 0.142[/C][/ROW]
[ROW][C]`(1-B12)Temperatuur(t-4s)`[/C][C]-2.703[/C][C] 3.895[/C][C]-6.9400e-01[/C][C] 0.4897[/C][C] 0.2448[/C][/ROW]
[ROW][C]`(1-B12)Temperatuur(t-5s)`[/C][C]-2.9[/C][C] 4.371[/C][C]-6.6350e-01[/C][C] 0.5089[/C][C] 0.2545[/C][/ROW]
[ROW][C]`(1-B12)Temperatuur(t-6s)`[/C][C]-3.239[/C][C] 4.907[/C][C]-6.6010e-01[/C][C] 0.5111[/C][C] 0.2556[/C][/ROW]
[ROW][C]`(1-B12)Temperatuur(t-7s)`[/C][C]-2.716[/C][C] 5.431[/C][C]-5.0010e-01[/C][C] 0.6183[/C][C] 0.3092[/C][/ROW]
[ROW][C]`(1-B12)Temperatuur(t-8s)`[/C][C]-5.121[/C][C] 6.286[/C][C]-8.1460e-01[/C][C] 0.4177[/C][C] 0.2089[/C][/ROW]
[ROW][C]`(1-B12)Temperatuur(t-9s)`[/C][C]-4.221[/C][C] 6.857[/C][C]-6.1560e-01[/C][C] 0.5399[/C][C] 0.2699[/C][/ROW]
[ROW][C]`(1-B12)Temperatuur(t-10s)`[/C][C]-3.915[/C][C] 7.302[/C][C]-5.3610e-01[/C][C] 0.5934[/C][C] 0.2967[/C][/ROW]
[ROW][C]`(1-B12)Temperatuur(t-11s)`[/C][C]-2.786[/C][C] 7.678[/C][C]-3.6290e-01[/C][C] 0.7177[/C][C] 0.3588[/C][/ROW]
[ROW][C]`(1-B12)Temperatuur(t-12s)`[/C][C]-3.012[/C][C] 7.911[/C][C]-3.8070e-01[/C][C] 0.7044[/C][C] 0.3522[/C][/ROW]
[ROW][C]`(1-B12)Temperatuur(t-13s)`[/C][C]-2.518[/C][C] 8.207[/C][C]-3.0680e-01[/C][C] 0.7598[/C][C] 0.3799[/C][/ROW]
[ROW][C]`(1-B12)Temperatuur(t-14s)`[/C][C]-4.474[/C][C] 8.3[/C][C]-5.3900e-01[/C][C] 0.5914[/C][C] 0.2957[/C][/ROW]
[ROW][C]`(1-B12)Temperatuur(t-15s)`[/C][C]-3.705[/C][C] 8.081[/C][C]-4.5850e-01[/C][C] 0.6478[/C][C] 0.3239[/C][/ROW]
[ROW][C]`(1-B12)Temperatuur(t-16s)`[/C][C]-5.31[/C][C] 7.982[/C][C]-6.6520e-01[/C][C] 0.5079[/C][C] 0.2539[/C][/ROW]
[ROW][C]`(1-B12)Temperatuur(t-17s)`[/C][C]-5.958[/C][C] 7.853[/C][C]-7.5870e-01[/C][C] 0.4503[/C][C] 0.2251[/C][/ROW]
[ROW][C]`(1-B12)Temperatuur(t-18s)`[/C][C]-6.1[/C][C] 7.668[/C][C]-7.9560e-01[/C][C] 0.4286[/C][C] 0.2143[/C][/ROW]
[ROW][C]`(1-B12)Temperatuur(t-19s)`[/C][C]-6.856[/C][C] 7.289[/C][C]-9.4070e-01[/C][C] 0.3497[/C][C] 0.1749[/C][/ROW]
[ROW][C]`(1-B12)Temperatuur(t-20s)`[/C][C]-5.574[/C][C] 6.819[/C][C]-8.1750e-01[/C][C] 0.4161[/C][C] 0.208[/C][/ROW]
[ROW][C]`(1-B12)Temperatuur(t-21s)`[/C][C]-1.332[/C][C] 6.408[/C][C]-2.0790e-01[/C][C] 0.8358[/C][C] 0.4179[/C][/ROW]
[ROW][C]`(1-B12)Temperatuur(t-22s)`[/C][C]-3.598[/C][C] 6.519[/C][C]-5.5190e-01[/C][C] 0.5825[/C][C] 0.2913[/C][/ROW]
[ROW][C]`(1-B12)Temperatuur(t-23s)`[/C][C]-5.423[/C][C] 6.629[/C][C]-8.1800e-01[/C][C] 0.4158[/C][C] 0.2079[/C][/ROW]
[ROW][C]`(1-B12)Temperatuur(t-24s)`[/C][C]-7.695[/C][C] 6.742[/C][C]-1.1410e+00[/C][C] 0.2571[/C][C] 0.1286[/C][/ROW]
[ROW][C]`(1-B12)Temperatuur(t-25s)`[/C][C]-9.233[/C][C] 7.328[/C][C]-1.2600e+00[/C][C] 0.2114[/C][C] 0.1057[/C][/ROW]
[ROW][C]`(1-B12)Temperatuur(t-26s)`[/C][C]-9.912[/C][C] 8.087[/C][C]-1.2260e+00[/C][C] 0.2239[/C][C] 0.112[/C][/ROW]
[ROW][C]`(1-B12)Temperatuur(t-27s)`[/C][C]-5.219[/C][C] 8.293[/C][C]-6.2930e-01[/C][C] 0.531[/C][C] 0.2655[/C][/ROW]
[ROW][C]`(1-B12)Temperatuur(t-28s)`[/C][C]-3.041[/C][C] 8.281[/C][C]-3.6720e-01[/C][C] 0.7144[/C][C] 0.3572[/C][/ROW]
[ROW][C]`(1-B12)Temperatuur(t-29s)`[/C][C]-3.562[/C][C] 8.145[/C][C]-4.3730e-01[/C][C] 0.6631[/C][C] 0.3315[/C][/ROW]
[ROW][C]`(1-B12)Temperatuur(t-30s)`[/C][C]-1.451[/C][C] 7.885[/C][C]-1.8400e-01[/C][C] 0.8545[/C][C] 0.4272[/C][/ROW]
[ROW][C]`(1-B12)Temperatuur(t-31s)`[/C][C]-2.235[/C][C] 7.812[/C][C]-2.8610e-01[/C][C] 0.7755[/C][C] 0.3878[/C][/ROW]
[ROW][C]`(1-B12)Temperatuur(t-32s)`[/C][C]-1.737[/C][C] 7.447[/C][C]-2.3330e-01[/C][C] 0.8161[/C][C] 0.4081[/C][/ROW]
[ROW][C]`(1-B12)Temperatuur(t-33s)`[/C][C]-4.404[/C][C] 7.003[/C][C]-6.2880e-01[/C][C] 0.5313[/C][C] 0.2656[/C][/ROW]
[ROW][C]`(1-B12)Temperatuur(t-34s)`[/C][C]-2.99[/C][C] 6.463[/C][C]-4.6270e-01[/C][C] 0.6449[/C][C] 0.3224[/C][/ROW]
[ROW][C]`(1-B12)Temperatuur(t-35s)`[/C][C]-1.275[/C][C] 6.125[/C][C]-2.0810e-01[/C][C] 0.8356[/C][C] 0.4178[/C][/ROW]
[ROW][C]`(1-B12)Temperatuur(t-36s)`[/C][C]-1.233[/C][C] 5.958[/C][C]-2.0690e-01[/C][C] 0.8366[/C][C] 0.4183[/C][/ROW]
[ROW][C]`(1-B12)Temperatuur(t-37s)`[/C][C]-2.118[/C][C] 5.35[/C][C]-3.9580e-01[/C][C] 0.6933[/C][C] 0.3466[/C][/ROW]
[ROW][C]`(1-B12)Temperatuur(t-38s)`[/C][C]+0.4026[/C][C] 4.519[/C][C]+8.9100e-02[/C][C] 0.9292[/C][C] 0.4646[/C][/ROW]
[ROW][C]`(1-B12)Temperatuur(t-39s)`[/C][C]-1.295[/C][C] 3.547[/C][C]-3.6500e-01[/C][C] 0.7161[/C][C] 0.358[/C][/ROW]
[ROW][C]`(1-B12)Temperatuur(t-40s)`[/C][C]-0.08042[/C][C] 2.697[/C][C]-2.9820e-02[/C][C] 0.9763[/C][C] 0.4881[/C][/ROW]
[ROW][C]`(1-B12)Temperatuur(t-41s)`[/C][C]-1.527[/C][C] 1.681[/C][C]-9.0820e-01[/C][C] 0.3665[/C][C] 0.1832[/C][/ROW]
[ROW][C]M1[/C][C]+0.05037[/C][C] 0.7282[/C][C]+6.9170e-02[/C][C] 0.945[/C][C] 0.4725[/C][/ROW]
[ROW][C]M2[/C][C]+0.4833[/C][C] 1.047[/C][C]+4.6150e-01[/C][C] 0.6457[/C][C] 0.3229[/C][/ROW]
[ROW][C]M3[/C][C]+0.4067[/C][C] 1.099[/C][C]+3.7000e-01[/C][C] 0.7123[/C][C] 0.3562[/C][/ROW]
[ROW][C]M4[/C][C]+0.3589[/C][C] 1.082[/C][C]+3.3180e-01[/C][C] 0.7409[/C][C] 0.3704[/C][/ROW]
[ROW][C]M5[/C][C]-0.1595[/C][C] 0.701[/C][C]-2.2760e-01[/C][C] 0.8205[/C][C] 0.4103[/C][/ROW]
[ROW][C]M6[/C][C]+0.1456[/C][C] 0.7092[/C][C]+2.0530e-01[/C][C] 0.8379[/C][C] 0.4189[/C][/ROW]
[ROW][C]M7[/C][C]+0.05073[/C][C] 0.7591[/C][C]+6.6830e-02[/C][C] 0.9469[/C][C] 0.4734[/C][/ROW]
[ROW][C]M8[/C][C]-0.1282[/C][C] 0.7422[/C][C]-1.7270e-01[/C][C] 0.8633[/C][C] 0.4317[/C][/ROW]
[ROW][C]M9[/C][C]-0.296[/C][C] 0.7149[/C][C]-4.1400e-01[/C][C] 0.68[/C][C] 0.34[/C][/ROW]
[ROW][C]M10[/C][C]+0.2825[/C][C] 0.7071[/C][C]+3.9950e-01[/C][C] 0.6906[/C][C] 0.3453[/C][/ROW]
[ROW][C]M11[/C][C]-0.3555[/C][C] 0.822[/C][C]-4.3250e-01[/C][C] 0.6665[/C][C] 0.3333[/C][/ROW]
[/TABLE]
Source: https://freestatistics.org/blog/index.php?pk=286229&T=2

Globally Unique Identifier (entire table): ba.freestatistics.org/blog/index.php?pk=286229&T=2

As an alternative you can also use a QR Code:  

The GUIDs for individual cells are displayed in the table below:

Multiple Linear Regression - Ordinary Least Squares
VariableParameterS.D.T-STATH0: parameter = 02-tail p-value1-tail p-value
(Intercept)+0.8025 1.426+5.6290e-01 0.5751 0.2875
`(1-B12)Temperatuur`-0.2106 1.546-1.3620e-01 0.892 0.446
`(1-B12)Temperatuur(t-1)`+2.51 1.146+2.1900e+00 0.03146 0.01573
`(1-B12)Temperatuur(t-2)`-1.266 1.089-1.1630e+00 0.2483 0.1241
`(1-B12)Temperatuur(t-3)`-1.875 1.047-1.7910e+00 0.07703 0.03852
`(1-B12)Temperatuur(t-4)`+1.304 1.049+1.2430e+00 0.2175 0.1088
`(1-B12)Temperatuur(t-5)`+0.6051 1.064+5.6890e-01 0.571 0.2855
`(1-B12)Temperatuur(t-6)`+2.425 1.011+2.3970e+00 0.01884 0.00942
`(1-B12)Temperatuur(t-7)`+0.8951 1.092+8.1970e-01 0.4148 0.2074
`(1-B12)Temperatuur(t-8)`+0.2072 1.083+1.9130e-01 0.8488 0.4244
`(1-B12)Temperatuur(t-9)`-2.357 1.038-2.2700e+00 0.02589 0.01295
`(1-B12)Temperatuur(t-10)`+3.012 1.105+2.7250e+00 0.007894 0.003947
`(1-B12)Temperatuur(t-11)`+0.5072 1.165+4.3520e-01 0.6646 0.3323
`(1-B12)Temperatuur(t-1s)`-0.4802 2.205-2.1780e-01 0.8282 0.4141
`(1-B12)Temperatuur(t-2s)`-0.1329 2.941-4.5170e-02 0.9641 0.482
`(1-B12)Temperatuur(t-3s)`-3.731 3.459-1.0790e+00 0.2839 0.142
`(1-B12)Temperatuur(t-4s)`-2.703 3.895-6.9400e-01 0.4897 0.2448
`(1-B12)Temperatuur(t-5s)`-2.9 4.371-6.6350e-01 0.5089 0.2545
`(1-B12)Temperatuur(t-6s)`-3.239 4.907-6.6010e-01 0.5111 0.2556
`(1-B12)Temperatuur(t-7s)`-2.716 5.431-5.0010e-01 0.6183 0.3092
`(1-B12)Temperatuur(t-8s)`-5.121 6.286-8.1460e-01 0.4177 0.2089
`(1-B12)Temperatuur(t-9s)`-4.221 6.857-6.1560e-01 0.5399 0.2699
`(1-B12)Temperatuur(t-10s)`-3.915 7.302-5.3610e-01 0.5934 0.2967
`(1-B12)Temperatuur(t-11s)`-2.786 7.678-3.6290e-01 0.7177 0.3588
`(1-B12)Temperatuur(t-12s)`-3.012 7.911-3.8070e-01 0.7044 0.3522
`(1-B12)Temperatuur(t-13s)`-2.518 8.207-3.0680e-01 0.7598 0.3799
`(1-B12)Temperatuur(t-14s)`-4.474 8.3-5.3900e-01 0.5914 0.2957
`(1-B12)Temperatuur(t-15s)`-3.705 8.081-4.5850e-01 0.6478 0.3239
`(1-B12)Temperatuur(t-16s)`-5.31 7.982-6.6520e-01 0.5079 0.2539
`(1-B12)Temperatuur(t-17s)`-5.958 7.853-7.5870e-01 0.4503 0.2251
`(1-B12)Temperatuur(t-18s)`-6.1 7.668-7.9560e-01 0.4286 0.2143
`(1-B12)Temperatuur(t-19s)`-6.856 7.289-9.4070e-01 0.3497 0.1749
`(1-B12)Temperatuur(t-20s)`-5.574 6.819-8.1750e-01 0.4161 0.208
`(1-B12)Temperatuur(t-21s)`-1.332 6.408-2.0790e-01 0.8358 0.4179
`(1-B12)Temperatuur(t-22s)`-3.598 6.519-5.5190e-01 0.5825 0.2913
`(1-B12)Temperatuur(t-23s)`-5.423 6.629-8.1800e-01 0.4158 0.2079
`(1-B12)Temperatuur(t-24s)`-7.695 6.742-1.1410e+00 0.2571 0.1286
`(1-B12)Temperatuur(t-25s)`-9.233 7.328-1.2600e+00 0.2114 0.1057
`(1-B12)Temperatuur(t-26s)`-9.912 8.087-1.2260e+00 0.2239 0.112
`(1-B12)Temperatuur(t-27s)`-5.219 8.293-6.2930e-01 0.531 0.2655
`(1-B12)Temperatuur(t-28s)`-3.041 8.281-3.6720e-01 0.7144 0.3572
`(1-B12)Temperatuur(t-29s)`-3.562 8.145-4.3730e-01 0.6631 0.3315
`(1-B12)Temperatuur(t-30s)`-1.451 7.885-1.8400e-01 0.8545 0.4272
`(1-B12)Temperatuur(t-31s)`-2.235 7.812-2.8610e-01 0.7755 0.3878
`(1-B12)Temperatuur(t-32s)`-1.737 7.447-2.3330e-01 0.8161 0.4081
`(1-B12)Temperatuur(t-33s)`-4.404 7.003-6.2880e-01 0.5313 0.2656
`(1-B12)Temperatuur(t-34s)`-2.99 6.463-4.6270e-01 0.6449 0.3224
`(1-B12)Temperatuur(t-35s)`-1.275 6.125-2.0810e-01 0.8356 0.4178
`(1-B12)Temperatuur(t-36s)`-1.233 5.958-2.0690e-01 0.8366 0.4183
`(1-B12)Temperatuur(t-37s)`-2.118 5.35-3.9580e-01 0.6933 0.3466
`(1-B12)Temperatuur(t-38s)`+0.4026 4.519+8.9100e-02 0.9292 0.4646
`(1-B12)Temperatuur(t-39s)`-1.295 3.547-3.6500e-01 0.7161 0.358
`(1-B12)Temperatuur(t-40s)`-0.08042 2.697-2.9820e-02 0.9763 0.4881
`(1-B12)Temperatuur(t-41s)`-1.527 1.681-9.0820e-01 0.3665 0.1832
M1+0.05037 0.7282+6.9170e-02 0.945 0.4725
M2+0.4833 1.047+4.6150e-01 0.6457 0.3229
M3+0.4067 1.099+3.7000e-01 0.7123 0.3562
M4+0.3589 1.082+3.3180e-01 0.7409 0.3704
M5-0.1595 0.701-2.2760e-01 0.8205 0.4103
M6+0.1456 0.7092+2.0530e-01 0.8379 0.4189
M7+0.05073 0.7591+6.6830e-02 0.9469 0.4734
M8-0.1282 0.7422-1.7270e-01 0.8633 0.4317
M9-0.296 0.7149-4.1400e-01 0.68 0.34
M10+0.2825 0.7071+3.9950e-01 0.6906 0.3453
M11-0.3555 0.822-4.3250e-01 0.6665 0.3333


Multiple Linear Regression - Regression Statistics
Multiple R 0.6789
R-squared 0.4609
Adjusted R-squared 0.02969
F-TEST (value) 1.069
F-TEST (DF numerator)64
F-TEST (DF denominator)80
p-value 0.3863
Multiple Linear Regression - Residual Statistics
Residual Standard Deviation 1.426
Sum Squared Residuals 162.8

\begin{tabular}{lllllllll}
\hline
Multiple Linear Regression - Regression Statistics \tabularnewline
Multiple R &  0.6789 \tabularnewline
R-squared &  0.4609 \tabularnewline
Adjusted R-squared &  0.02969 \tabularnewline
F-TEST (value) &  1.069 \tabularnewline
F-TEST (DF numerator) & 64 \tabularnewline
F-TEST (DF denominator) & 80 \tabularnewline
p-value &  0.3863 \tabularnewline
Multiple Linear Regression - Residual Statistics \tabularnewline
Residual Standard Deviation &  1.426 \tabularnewline
Sum Squared Residuals &  162.8 \tabularnewline
\hline
\end{tabular}
%Source: https://freestatistics.org/blog/index.php?pk=286229&T=3

[TABLE]
[ROW][C]Multiple Linear Regression - Regression Statistics[/C][/ROW]
[ROW][C]Multiple R[/C][C] 0.6789[/C][/ROW]
[ROW][C]R-squared[/C][C] 0.4609[/C][/ROW]
[ROW][C]Adjusted R-squared[/C][C] 0.02969[/C][/ROW]
[ROW][C]F-TEST (value)[/C][C] 1.069[/C][/ROW]
[ROW][C]F-TEST (DF numerator)[/C][C]64[/C][/ROW]
[ROW][C]F-TEST (DF denominator)[/C][C]80[/C][/ROW]
[ROW][C]p-value[/C][C] 0.3863[/C][/ROW]
[ROW][C]Multiple Linear Regression - Residual Statistics[/C][/ROW]
[ROW][C]Residual Standard Deviation[/C][C] 1.426[/C][/ROW]
[ROW][C]Sum Squared Residuals[/C][C] 162.8[/C][/ROW]
[/TABLE]
Source: https://freestatistics.org/blog/index.php?pk=286229&T=3

Globally Unique Identifier (entire table): ba.freestatistics.org/blog/index.php?pk=286229&T=3

As an alternative you can also use a QR Code:  

The GUIDs for individual cells are displayed in the table below:

Multiple Linear Regression - Regression Statistics
Multiple R 0.6789
R-squared 0.4609
Adjusted R-squared 0.02969
F-TEST (value) 1.069
F-TEST (DF numerator)64
F-TEST (DF denominator)80
p-value 0.3863
Multiple Linear Regression - Residual Statistics
Residual Standard Deviation 1.426
Sum Squared Residuals 162.8


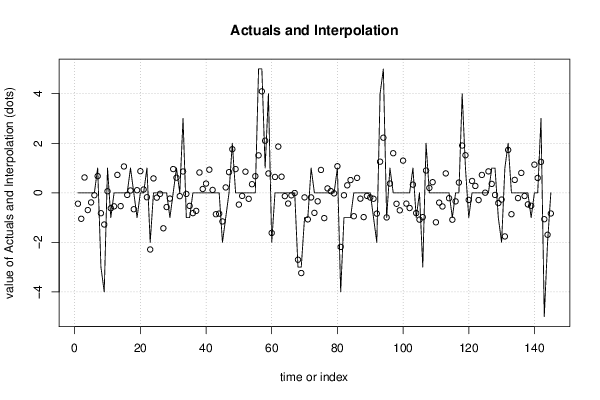
Multiple Linear Regression - Actuals, Interpolation, and Residuals
Time or IndexActualsInterpolationForecastResidualsPrediction Error
1 0-0.4411 0.4411
2 0-1.049 1.049
3 0 0.6189-0.6189
4 0-0.6967 0.6967
5 0-0.3879 0.3879
6 0-0.09739 0.09739
7 1 0.6735 0.3265
8-3-0.8242-2.176
9-4-1.28-2.72
10 1 0.06319 0.9368
11-1-0.6241-0.3759
12 0-0.5466 0.5466
13 0 0.7229-0.7229
14 0-0.5383 0.5383
15 0 1.063-1.063
16 0-0.08535 0.08535
17 1 0.09339 0.9066
18 0-0.6633 0.6633
19-1 0.1051-1.105
20 0 0.873-0.873
21 0 0.1323-0.1323
22 1-0.1793 1.179
23-2-2.289 0.289
24 0 0.5815-0.5815
25 0-0.1948 0.1948
26 0-0.0425 0.0425
27 0-1.433 1.433
28 0-0.5752 0.5752
29-1-0.2336-0.7664
30 0 0.9582-0.9582
31 1 0.6102 0.3898
32 0-0.135 0.135
33 3 0.8601 2.14
34-1-0.04526-0.9547
35-1-0.5285-0.4715
36 0-0.8209 0.8209
37 0-0.7311 0.7311
38 0 0.8191-0.8191
39 0 0.1534-0.1534
40 0 0.3723-0.3723
41 0 0.9321-0.9321
42 0 0.1158-0.1158
43 0-0.8646 0.8646
44 0-0.8396 0.8396
45-2-1.156-0.8439
46-1 0.2168-1.217
47 0 0.8342-0.8342
48 2 1.759 0.2411
49 0 0.9571-0.9571
50 0-0.4764 0.4764
51 0-0.1259 0.1259
52 0 0.8518-0.8518
53 0-0.243 0.243
54 0 0.3468-0.3468
55 0 0.6692-0.6692
56 5 1.512 3.488
57 5 4.096 0.9045
58 1 2.102-1.102
59 4 0.7798 3.22
60-2-1.622-0.3781
61 0 0.6394-0.6394
62 0 1.866-1.866
63 0 0.6489-0.6489
64 0-0.1338 0.1338
65 0-0.4338 0.4338
66 0-0.1024 0.1024
67 0-0.008921 0.008921
68-3-2.702-0.298
69-3-3.24 0.2396
70-1-0.1846-0.8154
71-1-1.072 0.07206
72 1-0.187 1.187
73 0-0.8108 0.8108
74 0-0.3433 0.3433
75 0 0.9223-0.9223
76 0-1.022 1.022
77 0 0.177-0.177
78 0 0.06782-0.06782
79 0-0.02269 0.02269
80 1 1.072-0.07223
81-4-2.185-1.815
82-1-0.09895-0.9011
83-1 0.3028-1.303
84-1 0.5152-1.515
85 0-0.9458 0.9458
86 0 0.6015-0.6015
87 0-0.2369 0.2369
88 0-0.9816 0.9816
89 0-0.1245 0.1245
90 0-0.1903 0.1903
91-1-0.2403-0.7597
92-2-0.8409-1.159
93 4 1.256 2.744
94 5 2.224 2.776
95-1-0.9937-0.006256
96 1 0.3744 0.6256
97 0 1.597-1.597
98 0-0.4431 0.4431
99 0-0.7073 0.7073
100 0 1.299-1.299
101 0-0.4368 0.4368
102 0-0.6147 0.6147
103 1 0.3304 0.6696
104-1-0.8197-0.1803
105 0-1.084 1.084
106-3-0.9823-2.018
107 2 0.8994 1.101
108 0 0.1978-0.1978
109 0 0.4283-0.4283
110 0-1.19 1.19
111 0-0.3972 0.3972
112 0-0.5517 0.5517
113 0 0.7829-0.7829
114 0-0.2183 0.2183
115-1-1.087 0.08659
116 0-0.3453 0.3453
117 0 0.4141-0.4141
118 4 1.908 2.092
119 1 1.517-0.5167
120-1-0.2875-0.7125
121 0 0.4775-0.4775
122 0 0.276-0.276
123 0-0.2932 0.2932
124 0 0.7207-0.7207
125 0 0.003476-0.003476
126 0 0.8654-0.8654
127 1 0.3591 0.6409
128 1-0.08674 1.087
129-1-0.4137-0.5863
130-2-0.2737-1.726
131 1-1.76 2.76
132 2 1.731 0.2693
133 0-0.8642 0.8642
134 0 0.5211-0.5211
135 0-0.2134 0.2134
136 0 0.8027-0.8027
137 0-0.1291 0.1291
138 0-0.4677 0.4677
139-1-0.5245-0.4755
140 0 1.136-1.136
141 0 0.6-0.6
142 3 1.249 1.751
143-5-1.065-3.935
144-2-1.695-0.3054
145 0-0.835 0.835

\begin{tabular}{lllllllll}
\hline
Multiple Linear Regression - Actuals, Interpolation, and Residuals \tabularnewline
Time or Index & Actuals & InterpolationForecast & ResidualsPrediction Error \tabularnewline
1 &  0 & -0.4411 &  0.4411 \tabularnewline
2 &  0 & -1.049 &  1.049 \tabularnewline
3 &  0 &  0.6189 & -0.6189 \tabularnewline
4 &  0 & -0.6967 &  0.6967 \tabularnewline
5 &  0 & -0.3879 &  0.3879 \tabularnewline
6 &  0 & -0.09739 &  0.09739 \tabularnewline
7 &  1 &  0.6735 &  0.3265 \tabularnewline
8 & -3 & -0.8242 & -2.176 \tabularnewline
9 & -4 & -1.28 & -2.72 \tabularnewline
10 &  1 &  0.06319 &  0.9368 \tabularnewline
11 & -1 & -0.6241 & -0.3759 \tabularnewline
12 &  0 & -0.5466 &  0.5466 \tabularnewline
13 &  0 &  0.7229 & -0.7229 \tabularnewline
14 &  0 & -0.5383 &  0.5383 \tabularnewline
15 &  0 &  1.063 & -1.063 \tabularnewline
16 &  0 & -0.08535 &  0.08535 \tabularnewline
17 &  1 &  0.09339 &  0.9066 \tabularnewline
18 &  0 & -0.6633 &  0.6633 \tabularnewline
19 & -1 &  0.1051 & -1.105 \tabularnewline
20 &  0 &  0.873 & -0.873 \tabularnewline
21 &  0 &  0.1323 & -0.1323 \tabularnewline
22 &  1 & -0.1793 &  1.179 \tabularnewline
23 & -2 & -2.289 &  0.289 \tabularnewline
24 &  0 &  0.5815 & -0.5815 \tabularnewline
25 &  0 & -0.1948 &  0.1948 \tabularnewline
26 &  0 & -0.0425 &  0.0425 \tabularnewline
27 &  0 & -1.433 &  1.433 \tabularnewline
28 &  0 & -0.5752 &  0.5752 \tabularnewline
29 & -1 & -0.2336 & -0.7664 \tabularnewline
30 &  0 &  0.9582 & -0.9582 \tabularnewline
31 &  1 &  0.6102 &  0.3898 \tabularnewline
32 &  0 & -0.135 &  0.135 \tabularnewline
33 &  3 &  0.8601 &  2.14 \tabularnewline
34 & -1 & -0.04526 & -0.9547 \tabularnewline
35 & -1 & -0.5285 & -0.4715 \tabularnewline
36 &  0 & -0.8209 &  0.8209 \tabularnewline
37 &  0 & -0.7311 &  0.7311 \tabularnewline
38 &  0 &  0.8191 & -0.8191 \tabularnewline
39 &  0 &  0.1534 & -0.1534 \tabularnewline
40 &  0 &  0.3723 & -0.3723 \tabularnewline
41 &  0 &  0.9321 & -0.9321 \tabularnewline
42 &  0 &  0.1158 & -0.1158 \tabularnewline
43 &  0 & -0.8646 &  0.8646 \tabularnewline
44 &  0 & -0.8396 &  0.8396 \tabularnewline
45 & -2 & -1.156 & -0.8439 \tabularnewline
46 & -1 &  0.2168 & -1.217 \tabularnewline
47 &  0 &  0.8342 & -0.8342 \tabularnewline
48 &  2 &  1.759 &  0.2411 \tabularnewline
49 &  0 &  0.9571 & -0.9571 \tabularnewline
50 &  0 & -0.4764 &  0.4764 \tabularnewline
51 &  0 & -0.1259 &  0.1259 \tabularnewline
52 &  0 &  0.8518 & -0.8518 \tabularnewline
53 &  0 & -0.243 &  0.243 \tabularnewline
54 &  0 &  0.3468 & -0.3468 \tabularnewline
55 &  0 &  0.6692 & -0.6692 \tabularnewline
56 &  5 &  1.512 &  3.488 \tabularnewline
57 &  5 &  4.096 &  0.9045 \tabularnewline
58 &  1 &  2.102 & -1.102 \tabularnewline
59 &  4 &  0.7798 &  3.22 \tabularnewline
60 & -2 & -1.622 & -0.3781 \tabularnewline
61 &  0 &  0.6394 & -0.6394 \tabularnewline
62 &  0 &  1.866 & -1.866 \tabularnewline
63 &  0 &  0.6489 & -0.6489 \tabularnewline
64 &  0 & -0.1338 &  0.1338 \tabularnewline
65 &  0 & -0.4338 &  0.4338 \tabularnewline
66 &  0 & -0.1024 &  0.1024 \tabularnewline
67 &  0 & -0.008921 &  0.008921 \tabularnewline
68 & -3 & -2.702 & -0.298 \tabularnewline
69 & -3 & -3.24 &  0.2396 \tabularnewline
70 & -1 & -0.1846 & -0.8154 \tabularnewline
71 & -1 & -1.072 &  0.07206 \tabularnewline
72 &  1 & -0.187 &  1.187 \tabularnewline
73 &  0 & -0.8108 &  0.8108 \tabularnewline
74 &  0 & -0.3433 &  0.3433 \tabularnewline
75 &  0 &  0.9223 & -0.9223 \tabularnewline
76 &  0 & -1.022 &  1.022 \tabularnewline
77 &  0 &  0.177 & -0.177 \tabularnewline
78 &  0 &  0.06782 & -0.06782 \tabularnewline
79 &  0 & -0.02269 &  0.02269 \tabularnewline
80 &  1 &  1.072 & -0.07223 \tabularnewline
81 & -4 & -2.185 & -1.815 \tabularnewline
82 & -1 & -0.09895 & -0.9011 \tabularnewline
83 & -1 &  0.3028 & -1.303 \tabularnewline
84 & -1 &  0.5152 & -1.515 \tabularnewline
85 &  0 & -0.9458 &  0.9458 \tabularnewline
86 &  0 &  0.6015 & -0.6015 \tabularnewline
87 &  0 & -0.2369 &  0.2369 \tabularnewline
88 &  0 & -0.9816 &  0.9816 \tabularnewline
89 &  0 & -0.1245 &  0.1245 \tabularnewline
90 &  0 & -0.1903 &  0.1903 \tabularnewline
91 & -1 & -0.2403 & -0.7597 \tabularnewline
92 & -2 & -0.8409 & -1.159 \tabularnewline
93 &  4 &  1.256 &  2.744 \tabularnewline
94 &  5 &  2.224 &  2.776 \tabularnewline
95 & -1 & -0.9937 & -0.006256 \tabularnewline
96 &  1 &  0.3744 &  0.6256 \tabularnewline
97 &  0 &  1.597 & -1.597 \tabularnewline
98 &  0 & -0.4431 &  0.4431 \tabularnewline
99 &  0 & -0.7073 &  0.7073 \tabularnewline
100 &  0 &  1.299 & -1.299 \tabularnewline
101 &  0 & -0.4368 &  0.4368 \tabularnewline
102 &  0 & -0.6147 &  0.6147 \tabularnewline
103 &  1 &  0.3304 &  0.6696 \tabularnewline
104 & -1 & -0.8197 & -0.1803 \tabularnewline
105 &  0 & -1.084 &  1.084 \tabularnewline
106 & -3 & -0.9823 & -2.018 \tabularnewline
107 &  2 &  0.8994 &  1.101 \tabularnewline
108 &  0 &  0.1978 & -0.1978 \tabularnewline
109 &  0 &  0.4283 & -0.4283 \tabularnewline
110 &  0 & -1.19 &  1.19 \tabularnewline
111 &  0 & -0.3972 &  0.3972 \tabularnewline
112 &  0 & -0.5517 &  0.5517 \tabularnewline
113 &  0 &  0.7829 & -0.7829 \tabularnewline
114 &  0 & -0.2183 &  0.2183 \tabularnewline
115 & -1 & -1.087 &  0.08659 \tabularnewline
116 &  0 & -0.3453 &  0.3453 \tabularnewline
117 &  0 &  0.4141 & -0.4141 \tabularnewline
118 &  4 &  1.908 &  2.092 \tabularnewline
119 &  1 &  1.517 & -0.5167 \tabularnewline
120 & -1 & -0.2875 & -0.7125 \tabularnewline
121 &  0 &  0.4775 & -0.4775 \tabularnewline
122 &  0 &  0.276 & -0.276 \tabularnewline
123 &  0 & -0.2932 &  0.2932 \tabularnewline
124 &  0 &  0.7207 & -0.7207 \tabularnewline
125 &  0 &  0.003476 & -0.003476 \tabularnewline
126 &  0 &  0.8654 & -0.8654 \tabularnewline
127 &  1 &  0.3591 &  0.6409 \tabularnewline
128 &  1 & -0.08674 &  1.087 \tabularnewline
129 & -1 & -0.4137 & -0.5863 \tabularnewline
130 & -2 & -0.2737 & -1.726 \tabularnewline
131 &  1 & -1.76 &  2.76 \tabularnewline
132 &  2 &  1.731 &  0.2693 \tabularnewline
133 &  0 & -0.8642 &  0.8642 \tabularnewline
134 &  0 &  0.5211 & -0.5211 \tabularnewline
135 &  0 & -0.2134 &  0.2134 \tabularnewline
136 &  0 &  0.8027 & -0.8027 \tabularnewline
137 &  0 & -0.1291 &  0.1291 \tabularnewline
138 &  0 & -0.4677 &  0.4677 \tabularnewline
139 & -1 & -0.5245 & -0.4755 \tabularnewline
140 &  0 &  1.136 & -1.136 \tabularnewline
141 &  0 &  0.6 & -0.6 \tabularnewline
142 &  3 &  1.249 &  1.751 \tabularnewline
143 & -5 & -1.065 & -3.935 \tabularnewline
144 & -2 & -1.695 & -0.3054 \tabularnewline
145 &  0 & -0.835 &  0.835 \tabularnewline
\hline
\end{tabular}
%Source: https://freestatistics.org/blog/index.php?pk=286229&T=4

[TABLE]
[ROW][C]Multiple Linear Regression - Actuals, Interpolation, and Residuals[/C][/ROW]
[ROW][C]Time or Index[/C][C]Actuals[/C][C]InterpolationForecast[/C][C]ResidualsPrediction Error[/C][/ROW]
[ROW][C]1[/C][C] 0[/C][C]-0.4411[/C][C] 0.4411[/C][/ROW]
[ROW][C]2[/C][C] 0[/C][C]-1.049[/C][C] 1.049[/C][/ROW]
[ROW][C]3[/C][C] 0[/C][C] 0.6189[/C][C]-0.6189[/C][/ROW]
[ROW][C]4[/C][C] 0[/C][C]-0.6967[/C][C] 0.6967[/C][/ROW]
[ROW][C]5[/C][C] 0[/C][C]-0.3879[/C][C] 0.3879[/C][/ROW]
[ROW][C]6[/C][C] 0[/C][C]-0.09739[/C][C] 0.09739[/C][/ROW]
[ROW][C]7[/C][C] 1[/C][C] 0.6735[/C][C] 0.3265[/C][/ROW]
[ROW][C]8[/C][C]-3[/C][C]-0.8242[/C][C]-2.176[/C][/ROW]
[ROW][C]9[/C][C]-4[/C][C]-1.28[/C][C]-2.72[/C][/ROW]
[ROW][C]10[/C][C] 1[/C][C] 0.06319[/C][C] 0.9368[/C][/ROW]
[ROW][C]11[/C][C]-1[/C][C]-0.6241[/C][C]-0.3759[/C][/ROW]
[ROW][C]12[/C][C] 0[/C][C]-0.5466[/C][C] 0.5466[/C][/ROW]
[ROW][C]13[/C][C] 0[/C][C] 0.7229[/C][C]-0.7229[/C][/ROW]
[ROW][C]14[/C][C] 0[/C][C]-0.5383[/C][C] 0.5383[/C][/ROW]
[ROW][C]15[/C][C] 0[/C][C] 1.063[/C][C]-1.063[/C][/ROW]
[ROW][C]16[/C][C] 0[/C][C]-0.08535[/C][C] 0.08535[/C][/ROW]
[ROW][C]17[/C][C] 1[/C][C] 0.09339[/C][C] 0.9066[/C][/ROW]
[ROW][C]18[/C][C] 0[/C][C]-0.6633[/C][C] 0.6633[/C][/ROW]
[ROW][C]19[/C][C]-1[/C][C] 0.1051[/C][C]-1.105[/C][/ROW]
[ROW][C]20[/C][C] 0[/C][C] 0.873[/C][C]-0.873[/C][/ROW]
[ROW][C]21[/C][C] 0[/C][C] 0.1323[/C][C]-0.1323[/C][/ROW]
[ROW][C]22[/C][C] 1[/C][C]-0.1793[/C][C] 1.179[/C][/ROW]
[ROW][C]23[/C][C]-2[/C][C]-2.289[/C][C] 0.289[/C][/ROW]
[ROW][C]24[/C][C] 0[/C][C] 0.5815[/C][C]-0.5815[/C][/ROW]
[ROW][C]25[/C][C] 0[/C][C]-0.1948[/C][C] 0.1948[/C][/ROW]
[ROW][C]26[/C][C] 0[/C][C]-0.0425[/C][C] 0.0425[/C][/ROW]
[ROW][C]27[/C][C] 0[/C][C]-1.433[/C][C] 1.433[/C][/ROW]
[ROW][C]28[/C][C] 0[/C][C]-0.5752[/C][C] 0.5752[/C][/ROW]
[ROW][C]29[/C][C]-1[/C][C]-0.2336[/C][C]-0.7664[/C][/ROW]
[ROW][C]30[/C][C] 0[/C][C] 0.9582[/C][C]-0.9582[/C][/ROW]
[ROW][C]31[/C][C] 1[/C][C] 0.6102[/C][C] 0.3898[/C][/ROW]
[ROW][C]32[/C][C] 0[/C][C]-0.135[/C][C] 0.135[/C][/ROW]
[ROW][C]33[/C][C] 3[/C][C] 0.8601[/C][C] 2.14[/C][/ROW]
[ROW][C]34[/C][C]-1[/C][C]-0.04526[/C][C]-0.9547[/C][/ROW]
[ROW][C]35[/C][C]-1[/C][C]-0.5285[/C][C]-0.4715[/C][/ROW]
[ROW][C]36[/C][C] 0[/C][C]-0.8209[/C][C] 0.8209[/C][/ROW]
[ROW][C]37[/C][C] 0[/C][C]-0.7311[/C][C] 0.7311[/C][/ROW]
[ROW][C]38[/C][C] 0[/C][C] 0.8191[/C][C]-0.8191[/C][/ROW]
[ROW][C]39[/C][C] 0[/C][C] 0.1534[/C][C]-0.1534[/C][/ROW]
[ROW][C]40[/C][C] 0[/C][C] 0.3723[/C][C]-0.3723[/C][/ROW]
[ROW][C]41[/C][C] 0[/C][C] 0.9321[/C][C]-0.9321[/C][/ROW]
[ROW][C]42[/C][C] 0[/C][C] 0.1158[/C][C]-0.1158[/C][/ROW]
[ROW][C]43[/C][C] 0[/C][C]-0.8646[/C][C] 0.8646[/C][/ROW]
[ROW][C]44[/C][C] 0[/C][C]-0.8396[/C][C] 0.8396[/C][/ROW]
[ROW][C]45[/C][C]-2[/C][C]-1.156[/C][C]-0.8439[/C][/ROW]
[ROW][C]46[/C][C]-1[/C][C] 0.2168[/C][C]-1.217[/C][/ROW]
[ROW][C]47[/C][C] 0[/C][C] 0.8342[/C][C]-0.8342[/C][/ROW]
[ROW][C]48[/C][C] 2[/C][C] 1.759[/C][C] 0.2411[/C][/ROW]
[ROW][C]49[/C][C] 0[/C][C] 0.9571[/C][C]-0.9571[/C][/ROW]
[ROW][C]50[/C][C] 0[/C][C]-0.4764[/C][C] 0.4764[/C][/ROW]
[ROW][C]51[/C][C] 0[/C][C]-0.1259[/C][C] 0.1259[/C][/ROW]
[ROW][C]52[/C][C] 0[/C][C] 0.8518[/C][C]-0.8518[/C][/ROW]
[ROW][C]53[/C][C] 0[/C][C]-0.243[/C][C] 0.243[/C][/ROW]
[ROW][C]54[/C][C] 0[/C][C] 0.3468[/C][C]-0.3468[/C][/ROW]
[ROW][C]55[/C][C] 0[/C][C] 0.6692[/C][C]-0.6692[/C][/ROW]
[ROW][C]56[/C][C] 5[/C][C] 1.512[/C][C] 3.488[/C][/ROW]
[ROW][C]57[/C][C] 5[/C][C] 4.096[/C][C] 0.9045[/C][/ROW]
[ROW][C]58[/C][C] 1[/C][C] 2.102[/C][C]-1.102[/C][/ROW]
[ROW][C]59[/C][C] 4[/C][C] 0.7798[/C][C] 3.22[/C][/ROW]
[ROW][C]60[/C][C]-2[/C][C]-1.622[/C][C]-0.3781[/C][/ROW]
[ROW][C]61[/C][C] 0[/C][C] 0.6394[/C][C]-0.6394[/C][/ROW]
[ROW][C]62[/C][C] 0[/C][C] 1.866[/C][C]-1.866[/C][/ROW]
[ROW][C]63[/C][C] 0[/C][C] 0.6489[/C][C]-0.6489[/C][/ROW]
[ROW][C]64[/C][C] 0[/C][C]-0.1338[/C][C] 0.1338[/C][/ROW]
[ROW][C]65[/C][C] 0[/C][C]-0.4338[/C][C] 0.4338[/C][/ROW]
[ROW][C]66[/C][C] 0[/C][C]-0.1024[/C][C] 0.1024[/C][/ROW]
[ROW][C]67[/C][C] 0[/C][C]-0.008921[/C][C] 0.008921[/C][/ROW]
[ROW][C]68[/C][C]-3[/C][C]-2.702[/C][C]-0.298[/C][/ROW]
[ROW][C]69[/C][C]-3[/C][C]-3.24[/C][C] 0.2396[/C][/ROW]
[ROW][C]70[/C][C]-1[/C][C]-0.1846[/C][C]-0.8154[/C][/ROW]
[ROW][C]71[/C][C]-1[/C][C]-1.072[/C][C] 0.07206[/C][/ROW]
[ROW][C]72[/C][C] 1[/C][C]-0.187[/C][C] 1.187[/C][/ROW]
[ROW][C]73[/C][C] 0[/C][C]-0.8108[/C][C] 0.8108[/C][/ROW]
[ROW][C]74[/C][C] 0[/C][C]-0.3433[/C][C] 0.3433[/C][/ROW]
[ROW][C]75[/C][C] 0[/C][C] 0.9223[/C][C]-0.9223[/C][/ROW]
[ROW][C]76[/C][C] 0[/C][C]-1.022[/C][C] 1.022[/C][/ROW]
[ROW][C]77[/C][C] 0[/C][C] 0.177[/C][C]-0.177[/C][/ROW]
[ROW][C]78[/C][C] 0[/C][C] 0.06782[/C][C]-0.06782[/C][/ROW]
[ROW][C]79[/C][C] 0[/C][C]-0.02269[/C][C] 0.02269[/C][/ROW]
[ROW][C]80[/C][C] 1[/C][C] 1.072[/C][C]-0.07223[/C][/ROW]
[ROW][C]81[/C][C]-4[/C][C]-2.185[/C][C]-1.815[/C][/ROW]
[ROW][C]82[/C][C]-1[/C][C]-0.09895[/C][C]-0.9011[/C][/ROW]
[ROW][C]83[/C][C]-1[/C][C] 0.3028[/C][C]-1.303[/C][/ROW]
[ROW][C]84[/C][C]-1[/C][C] 0.5152[/C][C]-1.515[/C][/ROW]
[ROW][C]85[/C][C] 0[/C][C]-0.9458[/C][C] 0.9458[/C][/ROW]
[ROW][C]86[/C][C] 0[/C][C] 0.6015[/C][C]-0.6015[/C][/ROW]
[ROW][C]87[/C][C] 0[/C][C]-0.2369[/C][C] 0.2369[/C][/ROW]
[ROW][C]88[/C][C] 0[/C][C]-0.9816[/C][C] 0.9816[/C][/ROW]
[ROW][C]89[/C][C] 0[/C][C]-0.1245[/C][C] 0.1245[/C][/ROW]
[ROW][C]90[/C][C] 0[/C][C]-0.1903[/C][C] 0.1903[/C][/ROW]
[ROW][C]91[/C][C]-1[/C][C]-0.2403[/C][C]-0.7597[/C][/ROW]
[ROW][C]92[/C][C]-2[/C][C]-0.8409[/C][C]-1.159[/C][/ROW]
[ROW][C]93[/C][C] 4[/C][C] 1.256[/C][C] 2.744[/C][/ROW]
[ROW][C]94[/C][C] 5[/C][C] 2.224[/C][C] 2.776[/C][/ROW]
[ROW][C]95[/C][C]-1[/C][C]-0.9937[/C][C]-0.006256[/C][/ROW]
[ROW][C]96[/C][C] 1[/C][C] 0.3744[/C][C] 0.6256[/C][/ROW]
[ROW][C]97[/C][C] 0[/C][C] 1.597[/C][C]-1.597[/C][/ROW]
[ROW][C]98[/C][C] 0[/C][C]-0.4431[/C][C] 0.4431[/C][/ROW]
[ROW][C]99[/C][C] 0[/C][C]-0.7073[/C][C] 0.7073[/C][/ROW]
[ROW][C]100[/C][C] 0[/C][C] 1.299[/C][C]-1.299[/C][/ROW]
[ROW][C]101[/C][C] 0[/C][C]-0.4368[/C][C] 0.4368[/C][/ROW]
[ROW][C]102[/C][C] 0[/C][C]-0.6147[/C][C] 0.6147[/C][/ROW]
[ROW][C]103[/C][C] 1[/C][C] 0.3304[/C][C] 0.6696[/C][/ROW]
[ROW][C]104[/C][C]-1[/C][C]-0.8197[/C][C]-0.1803[/C][/ROW]
[ROW][C]105[/C][C] 0[/C][C]-1.084[/C][C] 1.084[/C][/ROW]
[ROW][C]106[/C][C]-3[/C][C]-0.9823[/C][C]-2.018[/C][/ROW]
[ROW][C]107[/C][C] 2[/C][C] 0.8994[/C][C] 1.101[/C][/ROW]
[ROW][C]108[/C][C] 0[/C][C] 0.1978[/C][C]-0.1978[/C][/ROW]
[ROW][C]109[/C][C] 0[/C][C] 0.4283[/C][C]-0.4283[/C][/ROW]
[ROW][C]110[/C][C] 0[/C][C]-1.19[/C][C] 1.19[/C][/ROW]
[ROW][C]111[/C][C] 0[/C][C]-0.3972[/C][C] 0.3972[/C][/ROW]
[ROW][C]112[/C][C] 0[/C][C]-0.5517[/C][C] 0.5517[/C][/ROW]
[ROW][C]113[/C][C] 0[/C][C] 0.7829[/C][C]-0.7829[/C][/ROW]
[ROW][C]114[/C][C] 0[/C][C]-0.2183[/C][C] 0.2183[/C][/ROW]
[ROW][C]115[/C][C]-1[/C][C]-1.087[/C][C] 0.08659[/C][/ROW]
[ROW][C]116[/C][C] 0[/C][C]-0.3453[/C][C] 0.3453[/C][/ROW]
[ROW][C]117[/C][C] 0[/C][C] 0.4141[/C][C]-0.4141[/C][/ROW]
[ROW][C]118[/C][C] 4[/C][C] 1.908[/C][C] 2.092[/C][/ROW]
[ROW][C]119[/C][C] 1[/C][C] 1.517[/C][C]-0.5167[/C][/ROW]
[ROW][C]120[/C][C]-1[/C][C]-0.2875[/C][C]-0.7125[/C][/ROW]
[ROW][C]121[/C][C] 0[/C][C] 0.4775[/C][C]-0.4775[/C][/ROW]
[ROW][C]122[/C][C] 0[/C][C] 0.276[/C][C]-0.276[/C][/ROW]
[ROW][C]123[/C][C] 0[/C][C]-0.2932[/C][C] 0.2932[/C][/ROW]
[ROW][C]124[/C][C] 0[/C][C] 0.7207[/C][C]-0.7207[/C][/ROW]
[ROW][C]125[/C][C] 0[/C][C] 0.003476[/C][C]-0.003476[/C][/ROW]
[ROW][C]126[/C][C] 0[/C][C] 0.8654[/C][C]-0.8654[/C][/ROW]
[ROW][C]127[/C][C] 1[/C][C] 0.3591[/C][C] 0.6409[/C][/ROW]
[ROW][C]128[/C][C] 1[/C][C]-0.08674[/C][C] 1.087[/C][/ROW]
[ROW][C]129[/C][C]-1[/C][C]-0.4137[/C][C]-0.5863[/C][/ROW]
[ROW][C]130[/C][C]-2[/C][C]-0.2737[/C][C]-1.726[/C][/ROW]
[ROW][C]131[/C][C] 1[/C][C]-1.76[/C][C] 2.76[/C][/ROW]
[ROW][C]132[/C][C] 2[/C][C] 1.731[/C][C] 0.2693[/C][/ROW]
[ROW][C]133[/C][C] 0[/C][C]-0.8642[/C][C] 0.8642[/C][/ROW]
[ROW][C]134[/C][C] 0[/C][C] 0.5211[/C][C]-0.5211[/C][/ROW]
[ROW][C]135[/C][C] 0[/C][C]-0.2134[/C][C] 0.2134[/C][/ROW]
[ROW][C]136[/C][C] 0[/C][C] 0.8027[/C][C]-0.8027[/C][/ROW]
[ROW][C]137[/C][C] 0[/C][C]-0.1291[/C][C] 0.1291[/C][/ROW]
[ROW][C]138[/C][C] 0[/C][C]-0.4677[/C][C] 0.4677[/C][/ROW]
[ROW][C]139[/C][C]-1[/C][C]-0.5245[/C][C]-0.4755[/C][/ROW]
[ROW][C]140[/C][C] 0[/C][C] 1.136[/C][C]-1.136[/C][/ROW]
[ROW][C]141[/C][C] 0[/C][C] 0.6[/C][C]-0.6[/C][/ROW]
[ROW][C]142[/C][C] 3[/C][C] 1.249[/C][C] 1.751[/C][/ROW]
[ROW][C]143[/C][C]-5[/C][C]-1.065[/C][C]-3.935[/C][/ROW]
[ROW][C]144[/C][C]-2[/C][C]-1.695[/C][C]-0.3054[/C][/ROW]
[ROW][C]145[/C][C] 0[/C][C]-0.835[/C][C] 0.835[/C][/ROW]
[/TABLE]
Source: https://freestatistics.org/blog/index.php?pk=286229&T=4

Globally Unique Identifier (entire table): ba.freestatistics.org/blog/index.php?pk=286229&T=4

As an alternative you can also use a QR Code:  

The GUIDs for individual cells are displayed in the table below:

Multiple Linear Regression - Actuals, Interpolation, and Residuals
Time or IndexActualsInterpolationForecastResidualsPrediction Error
1 0-0.4411 0.4411
2 0-1.049 1.049
3 0 0.6189-0.6189
4 0-0.6967 0.6967
5 0-0.3879 0.3879
6 0-0.09739 0.09739
7 1 0.6735 0.3265
8-3-0.8242-2.176
9-4-1.28-2.72
10 1 0.06319 0.9368
11-1-0.6241-0.3759
12 0-0.5466 0.5466
13 0 0.7229-0.7229
14 0-0.5383 0.5383
15 0 1.063-1.063
16 0-0.08535 0.08535
17 1 0.09339 0.9066
18 0-0.6633 0.6633
19-1 0.1051-1.105
20 0 0.873-0.873
21 0 0.1323-0.1323
22 1-0.1793 1.179
23-2-2.289 0.289
24 0 0.5815-0.5815
25 0-0.1948 0.1948
26 0-0.0425 0.0425
27 0-1.433 1.433
28 0-0.5752 0.5752
29-1-0.2336-0.7664
30 0 0.9582-0.9582
31 1 0.6102 0.3898
32 0-0.135 0.135
33 3 0.8601 2.14
34-1-0.04526-0.9547
35-1-0.5285-0.4715
36 0-0.8209 0.8209
37 0-0.7311 0.7311
38 0 0.8191-0.8191
39 0 0.1534-0.1534
40 0 0.3723-0.3723
41 0 0.9321-0.9321
42 0 0.1158-0.1158
43 0-0.8646 0.8646
44 0-0.8396 0.8396
45-2-1.156-0.8439
46-1 0.2168-1.217
47 0 0.8342-0.8342
48 2 1.759 0.2411
49 0 0.9571-0.9571
50 0-0.4764 0.4764
51 0-0.1259 0.1259
52 0 0.8518-0.8518
53 0-0.243 0.243
54 0 0.3468-0.3468
55 0 0.6692-0.6692
56 5 1.512 3.488
57 5 4.096 0.9045
58 1 2.102-1.102
59 4 0.7798 3.22
60-2-1.622-0.3781
61 0 0.6394-0.6394
62 0 1.866-1.866
63 0 0.6489-0.6489
64 0-0.1338 0.1338
65 0-0.4338 0.4338
66 0-0.1024 0.1024
67 0-0.008921 0.008921
68-3-2.702-0.298
69-3-3.24 0.2396
70-1-0.1846-0.8154
71-1-1.072 0.07206
72 1-0.187 1.187
73 0-0.8108 0.8108
74 0-0.3433 0.3433
75 0 0.9223-0.9223
76 0-1.022 1.022
77 0 0.177-0.177
78 0 0.06782-0.06782
79 0-0.02269 0.02269
80 1 1.072-0.07223
81-4-2.185-1.815
82-1-0.09895-0.9011
83-1 0.3028-1.303
84-1 0.5152-1.515
85 0-0.9458 0.9458
86 0 0.6015-0.6015
87 0-0.2369 0.2369
88 0-0.9816 0.9816
89 0-0.1245 0.1245
90 0-0.1903 0.1903
91-1-0.2403-0.7597
92-2-0.8409-1.159
93 4 1.256 2.744
94 5 2.224 2.776
95-1-0.9937-0.006256
96 1 0.3744 0.6256
97 0 1.597-1.597
98 0-0.4431 0.4431
99 0-0.7073 0.7073
100 0 1.299-1.299
101 0-0.4368 0.4368
102 0-0.6147 0.6147
103 1 0.3304 0.6696
104-1-0.8197-0.1803
105 0-1.084 1.084
106-3-0.9823-2.018
107 2 0.8994 1.101
108 0 0.1978-0.1978
109 0 0.4283-0.4283
110 0-1.19 1.19
111 0-0.3972 0.3972
112 0-0.5517 0.5517
113 0 0.7829-0.7829
114 0-0.2183 0.2183
115-1-1.087 0.08659
116 0-0.3453 0.3453
117 0 0.4141-0.4141
118 4 1.908 2.092
119 1 1.517-0.5167
120-1-0.2875-0.7125
121 0 0.4775-0.4775
122 0 0.276-0.276
123 0-0.2932 0.2932
124 0 0.7207-0.7207
125 0 0.003476-0.003476
126 0 0.8654-0.8654
127 1 0.3591 0.6409
128 1-0.08674 1.087
129-1-0.4137-0.5863
130-2-0.2737-1.726
131 1-1.76 2.76
132 2 1.731 0.2693
133 0-0.8642 0.8642
134 0 0.5211-0.5211
135 0-0.2134 0.2134
136 0 0.8027-0.8027
137 0-0.1291 0.1291
138 0-0.4677 0.4677
139-1-0.5245-0.4755
140 0 1.136-1.136
141 0 0.6-0.6
142 3 1.249 1.751
143-5-1.065-3.935
144-2-1.695-0.3054
145 0-0.835 0.835


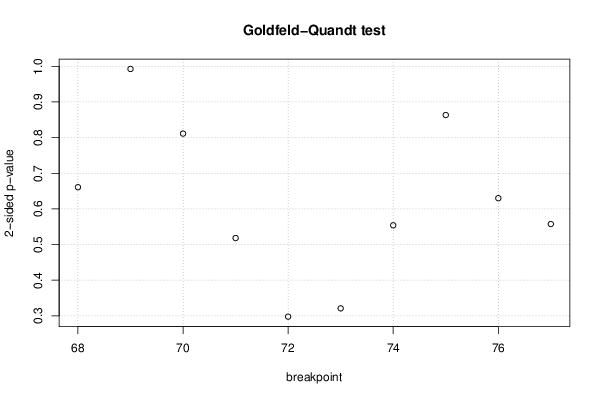
Goldfeld-Quandt test for Heteroskedasticity
p-valuesAlternative Hypothesis
breakpoint indexgreater2-sidedless
68 0.6696 0.6609 0.3304
69 0.5037 0.9926 0.4963
70 0.4056 0.8113 0.5944
71 0.2591 0.5181 0.7409
72 0.1488 0.2977 0.8512
73 0.1605 0.3209 0.8395
74 0.277 0.5539 0.723
75 0.4317 0.8634 0.5683
76 0.315 0.63 0.685
77 0.2788 0.5575 0.7212

\begin{tabular}{lllllllll}
\hline
Goldfeld-Quandt test for Heteroskedasticity \tabularnewline
p-values & Alternative Hypothesis \tabularnewline
breakpoint index & greater & 2-sided & less \tabularnewline
68 &  0.6696 &  0.6609 &  0.3304 \tabularnewline
69 &  0.5037 &  0.9926 &  0.4963 \tabularnewline
70 &  0.4056 &  0.8113 &  0.5944 \tabularnewline
71 &  0.2591 &  0.5181 &  0.7409 \tabularnewline
72 &  0.1488 &  0.2977 &  0.8512 \tabularnewline
73 &  0.1605 &  0.3209 &  0.8395 \tabularnewline
74 &  0.277 &  0.5539 &  0.723 \tabularnewline
75 &  0.4317 &  0.8634 &  0.5683 \tabularnewline
76 &  0.315 &  0.63 &  0.685 \tabularnewline
77 &  0.2788 &  0.5575 &  0.7212 \tabularnewline
\hline
\end{tabular}
%Source: https://freestatistics.org/blog/index.php?pk=286229&T=5

[TABLE]
[ROW][C]Goldfeld-Quandt test for Heteroskedasticity[/C][/ROW]
[ROW][C]p-values[/C][C]Alternative Hypothesis[/C][/ROW]
[ROW][C]breakpoint index[/C][C]greater[/C][C]2-sided[/C][C]less[/C][/ROW]
[ROW][C]68[/C][C] 0.6696[/C][C] 0.6609[/C][C] 0.3304[/C][/ROW]
[ROW][C]69[/C][C] 0.5037[/C][C] 0.9926[/C][C] 0.4963[/C][/ROW]
[ROW][C]70[/C][C] 0.4056[/C][C] 0.8113[/C][C] 0.5944[/C][/ROW]
[ROW][C]71[/C][C] 0.2591[/C][C] 0.5181[/C][C] 0.7409[/C][/ROW]
[ROW][C]72[/C][C] 0.1488[/C][C] 0.2977[/C][C] 0.8512[/C][/ROW]
[ROW][C]73[/C][C] 0.1605[/C][C] 0.3209[/C][C] 0.8395[/C][/ROW]
[ROW][C]74[/C][C] 0.277[/C][C] 0.5539[/C][C] 0.723[/C][/ROW]
[ROW][C]75[/C][C] 0.4317[/C][C] 0.8634[/C][C] 0.5683[/C][/ROW]
[ROW][C]76[/C][C] 0.315[/C][C] 0.63[/C][C] 0.685[/C][/ROW]
[ROW][C]77[/C][C] 0.2788[/C][C] 0.5575[/C][C] 0.7212[/C][/ROW]
[/TABLE]
Source: https://freestatistics.org/blog/index.php?pk=286229&T=5

Globally Unique Identifier (entire table): ba.freestatistics.org/blog/index.php?pk=286229&T=5

As an alternative you can also use a QR Code:  

The GUIDs for individual cells are displayed in the table below:

Goldfeld-Quandt test for Heteroskedasticity
p-valuesAlternative Hypothesis
breakpoint indexgreater2-sidedless
68 0.6696 0.6609 0.3304
69 0.5037 0.9926 0.4963
70 0.4056 0.8113 0.5944
71 0.2591 0.5181 0.7409
72 0.1488 0.2977 0.8512
73 0.1605 0.3209 0.8395
74 0.277 0.5539 0.723
75 0.4317 0.8634 0.5683
76 0.315 0.63 0.685
77 0.2788 0.5575 0.7212


Meta Analysis of Goldfeld-Quandt test for Heteroskedasticity
Description# significant tests% significant testsOK/NOK
1% type I error level0 0OK
5% type I error level00OK
10% type I error level00OK

\begin{tabular}{lllllllll}
\hline
Meta Analysis of Goldfeld-Quandt test for Heteroskedasticity \tabularnewline
Description & # significant tests & % significant tests & OK/NOK \tabularnewline
1% type I error level & 0 &  0 & OK \tabularnewline
5% type I error level & 0 & 0 & OK \tabularnewline
10% type I error level & 0 & 0 & OK \tabularnewline
\hline
\end{tabular}
%Source: https://freestatistics.org/blog/index.php?pk=286229&T=6

[TABLE]
[ROW][C]Meta Analysis of Goldfeld-Quandt test for Heteroskedasticity[/C][/ROW]
[ROW][C]Description[/C][C]# significant tests[/C][C]% significant tests[/C][C]OK/NOK[/C][/ROW]
[ROW][C]1% type I error level[/C][C]0[/C][C] 0[/C][C]OK[/C][/ROW]
[ROW][C]5% type I error level[/C][C]0[/C][C]0[/C][C]OK[/C][/ROW]
[ROW][C]10% type I error level[/C][C]0[/C][C]0[/C][C]OK[/C][/ROW]
[/TABLE]
Source: https://freestatistics.org/blog/index.php?pk=286229&T=6

Globally Unique Identifier (entire table): ba.freestatistics.org/blog/index.php?pk=286229&T=6

As an alternative you can also use a QR Code:  

The GUIDs for individual cells are displayed in the table below:

Meta Analysis of Goldfeld-Quandt test for Heteroskedasticity
Description# significant tests% significant testsOK/NOK
1% type I error level0 0OK
5% type I error level00OK
10% type I error level00OK


Parameters (Session):
par1 = 2 ; par2 = Include Monthly Dummies ; par3 = Seasonal Differences (s=12) ; par4 = -10 ; par5 = 41 ;
Parameters (R input):
par1 = 2 ; par2 = Include Monthly Dummies ; par3 = Seasonal Differences (s=12) ; par4 = 11 ; par5 = 41 ;
R code (references can be found in the software module):
library(lattice)
library(lmtest)
n25 <- 25 #minimum number of obs. for Goldfeld-Quandt test
mywarning <- ''
par1 <- as.numeric(par1)
if(is.na(par1)) {
par1 <- 1
mywarning = 'Warning: you did not specify the column number of the endogenous series! The first column was selected by default.'
}
if (par4=='') par4 <- 0
par4 <- as.numeric(par4)
if (par5=='') par5 <- 0
par5 <- as.numeric(par5)
x <- na.omit(t(y))
k <- length(x[1,])
n <- length(x[,1])
x1 <- cbind(x[,par1], x[,1:k!=par1])
mycolnames <- c(colnames(x)[par1], colnames(x)[1:k!=par1])
colnames(x1) <- mycolnames #colnames(x)[par1]
x <- x1
if (par3 == 'First Differences'){
(n <- n -1)
x2 <- array(0, dim=c(n,k), dimnames=list(1:n, paste('(1-B)',colnames(x),sep='')))
for (i in 1:n) {
for (j in 1:k) {
x2[i,j] <- x[i+1,j] - x[i,j]
}
}
x <- x2
}
if (par3 == 'Seasonal Differences (s=12)'){
(n <- n - 12)
x2 <- array(0, dim=c(n,k), dimnames=list(1:n, paste('(1-B12)',colnames(x),sep='')))
for (i in 1:n) {
for (j in 1:k) {
x2[i,j] <- x[i+12,j] - x[i,j]
}
}
x <- x2
}
if (par3 == 'First and Seasonal Differences (s=12)'){
(n <- n -1)
x2 <- array(0, dim=c(n,k), dimnames=list(1:n, paste('(1-B)',colnames(x),sep='')))
for (i in 1:n) {
for (j in 1:k) {
x2[i,j] <- x[i+1,j] - x[i,j]
}
}
x <- x2
(n <- n - 12)
x2 <- array(0, dim=c(n,k), dimnames=list(1:n, paste('(1-B12)',colnames(x),sep='')))
for (i in 1:n) {
for (j in 1:k) {
x2[i,j] <- x[i+12,j] - x[i,j]
}
}
x <- x2
}
if(par4 > 0) {
x2 <- array(0, dim=c(n-par4,par4), dimnames=list(1:(n-par4), paste(colnames(x)[par1],'(t-',1:par4,')',sep='')))
for (i in 1:(n-par4)) {
for (j in 1:par4) {
x2[i,j] <- x[i+par4-j,par1]
}
}
x <- cbind(x[(par4+1):n,], x2)
n <- n - par4
}
if(par5 > 0) {
x2 <- array(0, dim=c(n-par5*12,par5), dimnames=list(1:(n-par5*12), paste(colnames(x)[par1],'(t-',1:par5,'s)',sep='')))
for (i in 1:(n-par5*12)) {
for (j in 1:par5) {
x2[i,j] <- x[i+par5*12-j*12,par1]
}
}
x <- cbind(x[(par5*12+1):n,], x2)
n <- n - par5*12
}
if (par2 == 'Include Monthly Dummies'){
x2 <- array(0, dim=c(n,11), dimnames=list(1:n, paste('M', seq(1:11), sep ='')))
for (i in 1:11){
x2[seq(i,n,12),i] <- 1
}
x <- cbind(x, x2)
}
if (par2 == 'Include Quarterly Dummies'){
x2 <- array(0, dim=c(n,3), dimnames=list(1:n, paste('Q', seq(1:3), sep ='')))
for (i in 1:3){
x2[seq(i,n,4),i] <- 1
}
x <- cbind(x, x2)
}
(k <- length(x[n,]))
if (par3 == 'Linear Trend'){
x <- cbind(x, c(1:n))
colnames(x)[k+1] <- 't'
}
x
(k <- length(x[n,]))
head(x)
df <- as.data.frame(x)
(mylm <- lm(df))
(mysum <- summary(mylm))
if (n > n25) {
kp3 <- k + 3
nmkm3 <- n - k - 3
gqarr <- array(NA, dim=c(nmkm3-kp3+1,3))
numgqtests <- 0
numsignificant1 <- 0
numsignificant5 <- 0
numsignificant10 <- 0
for (mypoint in kp3:nmkm3) {
j <- 0
numgqtests <- numgqtests + 1
for (myalt in c('greater', 'two.sided', 'less')) {
j <- j + 1
gqarr[mypoint-kp3+1,j] <- gqtest(mylm, point=mypoint, alternative=myalt)$p.value
}
if (gqarr[mypoint-kp3+1,2] < 0.01) numsignificant1 <- numsignificant1 + 1
if (gqarr[mypoint-kp3+1,2] < 0.05) numsignificant5 <- numsignificant5 + 1
if (gqarr[mypoint-kp3+1,2] < 0.10) numsignificant10 <- numsignificant10 + 1
}
gqarr
}
bitmap(file='test0.png')
plot(x[,1], type='l', main='Actuals and Interpolation', ylab='value of Actuals and Interpolation (dots)', xlab='time or index')
points(x[,1]-mysum$resid)
grid()
dev.off()
bitmap(file='test1.png')
plot(mysum$resid, type='b', pch=19, main='Residuals', ylab='value of Residuals', xlab='time or index')
grid()
dev.off()
bitmap(file='test2.png')
hist(mysum$resid, main='Residual Histogram', xlab='values of Residuals')
grid()
dev.off()
bitmap(file='test3.png')
densityplot(~mysum$resid,col='black',main='Residual Density Plot', xlab='values of Residuals')
dev.off()
bitmap(file='test4.png')
qqnorm(mysum$resid, main='Residual Normal Q-Q Plot')
qqline(mysum$resid)
grid()
dev.off()
(myerror <- as.ts(mysum$resid))
bitmap(file='test5.png')
dum <- cbind(lag(myerror,k=1),myerror)
dum
dum1 <- dum[2:length(myerror),]
dum1
z <- as.data.frame(dum1)
z
plot(z,main=paste('Residual Lag plot, lowess, and regression line'), ylab='values of Residuals', xlab='lagged values of Residuals')
lines(lowess(z))
abline(lm(z))
grid()
dev.off()
bitmap(file='test6.png')
acf(mysum$resid, lag.max=length(mysum$resid)/2, main='Residual Autocorrelation Function')
grid()
dev.off()
bitmap(file='test7.png')
pacf(mysum$resid, lag.max=length(mysum$resid)/2, main='Residual Partial Autocorrelation Function')
grid()
dev.off()
bitmap(file='test8.png')
opar <- par(mfrow = c(2,2), oma = c(0, 0, 1.1, 0))
plot(mylm, las = 1, sub='Residual Diagnostics')
par(opar)
dev.off()
if (n > n25) {
bitmap(file='test9.png')
plot(kp3:nmkm3,gqarr[,2], main='Goldfeld-Quandt test',ylab='2-sided p-value',xlab='breakpoint')
grid()
dev.off()
}
load(file='createtable')
a<-table.start()
a<-table.row.start(a)
a<-table.element(a, 'Multiple Linear Regression - Estimated Regression Equation', 1, TRUE)
a<-table.row.end(a)
myeq <- colnames(x)[1]
myeq <- paste(myeq, '[t] = ', sep='')
for (i in 1:k){
if (mysum$coefficients[i,1] > 0) myeq <- paste(myeq, '+', '')
myeq <- paste(myeq, signif(mysum$coefficients[i,1],6), sep=' ')
if (rownames(mysum$coefficients)[i] != '(Intercept)') {
myeq <- paste(myeq, rownames(mysum$coefficients)[i], sep='')
if (rownames(mysum$coefficients)[i] != 't') myeq <- paste(myeq, '[t]', sep='')
}
}
myeq <- paste(myeq, ' + e[t]')
a<-table.row.start(a)
a<-table.element(a, myeq)
a<-table.row.end(a)
a<-table.row.start(a)
a<-table.element(a, mywarning)
a<-table.row.end(a)
a<-table.end(a)
table.save(a,file='mytable1.tab')
a<-table.start()
a<-table.row.start(a)
a<-table.element(a,hyperlink('ols1.htm','Multiple Linear Regression - Ordinary Least Squares',''), 6, TRUE)
a<-table.row.end(a)
a<-table.row.start(a)
a<-table.element(a,'Variable',header=TRUE)
a<-table.element(a,'Parameter',header=TRUE)
a<-table.element(a,'S.D.',header=TRUE)
a<-table.element(a,'T-STAT
H0: parameter = 0',header=TRUE)
a<-table.element(a,'2-tail p-value',header=TRUE)
a<-table.element(a,'1-tail p-value',header=TRUE)
a<-table.row.end(a)
for (i in 1:k){
a<-table.row.start(a)
a<-table.element(a,rownames(mysum$coefficients)[i],header=TRUE)
a<-table.element(a,formatC(signif(mysum$coefficients[i,1],5),format='g',flag='+'))
a<-table.element(a,formatC(signif(mysum$coefficients[i,2],5),format='g',flag=' '))
a<-table.element(a,formatC(signif(mysum$coefficients[i,3],4),format='e',flag='+'))
a<-table.element(a,formatC(signif(mysum$coefficients[i,4],4),format='g',flag=' '))
a<-table.element(a,formatC(signif(mysum$coefficients[i,4]/2,4),format='g',flag=' '))
a<-table.row.end(a)
}
a<-table.end(a)
table.save(a,file='mytable2.tab')
a<-table.start()
a<-table.row.start(a)
a<-table.element(a, 'Multiple Linear Regression - Regression Statistics', 2, TRUE)
a<-table.row.end(a)
a<-table.row.start(a)
a<-table.element(a, 'Multiple R',1,TRUE)
a<-table.element(a,formatC(signif(sqrt(mysum$r.squared),6),format='g',flag=' '))
a<-table.row.end(a)
a<-table.row.start(a)
a<-table.element(a, 'R-squared',1,TRUE)
a<-table.element(a,formatC(signif(mysum$r.squared,6),format='g',flag=' '))
a<-table.row.end(a)
a<-table.row.start(a)
a<-table.element(a, 'Adjusted R-squared',1,TRUE)
a<-table.element(a,formatC(signif(mysum$adj.r.squared,6),format='g',flag=' '))
a<-table.row.end(a)
a<-table.row.start(a)
a<-table.element(a, 'F-TEST (value)',1,TRUE)
a<-table.element(a,formatC(signif(mysum$fstatistic[1],6),format='g',flag=' '))
a<-table.row.end(a)
a<-table.row.start(a)
a<-table.element(a, 'F-TEST (DF numerator)',1,TRUE)
a<-table.element(a, signif(mysum$fstatistic[2],6))
a<-table.row.end(a)
a<-table.row.start(a)
a<-table.element(a, 'F-TEST (DF denominator)',1,TRUE)
a<-table.element(a, signif(mysum$fstatistic[3],6))
a<-table.row.end(a)
a<-table.row.start(a)
a<-table.element(a, 'p-value',1,TRUE)
a<-table.element(a,formatC(signif(1-pf(mysum$fstatistic[1],mysum$fstatistic[2],mysum$fstatistic[3]),6),format='g',flag=' '))
a<-table.row.end(a)
a<-table.row.start(a)
a<-table.element(a, 'Multiple Linear Regression - Residual Statistics', 2, TRUE)
a<-table.row.end(a)
a<-table.row.start(a)
a<-table.element(a, 'Residual Standard Deviation',1,TRUE)
a<-table.element(a,formatC(signif(mysum$sigma,6),format='g',flag=' '))
a<-table.row.end(a)
a<-table.row.start(a)
a<-table.element(a, 'Sum Squared Residuals',1,TRUE)
a<-table.element(a,formatC(signif(sum(myerror*myerror),6),format='g',flag=' '))
a<-table.row.end(a)
a<-table.end(a)
table.save(a,file='mytable3.tab')
if(n < 200) {
a<-table.start()
a<-table.row.start(a)
a<-table.element(a, 'Multiple Linear Regression - Actuals, Interpolation, and Residuals', 4, TRUE)
a<-table.row.end(a)
a<-table.row.start(a)
a<-table.element(a, 'Time or Index', 1, TRUE)
a<-table.element(a, 'Actuals', 1, TRUE)
a<-table.element(a, 'Interpolation
Forecast', 1, TRUE)
a<-table.element(a, 'Residuals
Prediction Error', 1, TRUE)
a<-table.row.end(a)
for (i in 1:n) {
a<-table.row.start(a)
a<-table.element(a,i, 1, TRUE)
a<-table.element(a,formatC(signif(x[i],6),format='g',flag=' '))
a<-table.element(a,formatC(signif(x[i]-mysum$resid[i],6),format='g',flag=' '))
a<-table.element(a,formatC(signif(mysum$resid[i],6),format='g',flag=' '))
a<-table.row.end(a)
}
a<-table.end(a)
table.save(a,file='mytable4.tab')
if (n > n25) {
a<-table.start()
a<-table.row.start(a)
a<-table.element(a,'Goldfeld-Quandt test for Heteroskedasticity',4,TRUE)
a<-table.row.end(a)
a<-table.row.start(a)
a<-table.element(a,'p-values',header=TRUE)
a<-table.element(a,'Alternative Hypothesis',3,header=TRUE)
a<-table.row.end(a)
a<-table.row.start(a)
a<-table.element(a,'breakpoint index',header=TRUE)
a<-table.element(a,'greater',header=TRUE)
a<-table.element(a,'2-sided',header=TRUE)
a<-table.element(a,'less',header=TRUE)
a<-table.row.end(a)
for (mypoint in kp3:nmkm3) {
a<-table.row.start(a)
a<-table.element(a,mypoint,header=TRUE)
a<-table.element(a,formatC(signif(gqarr[mypoint-kp3+1,1],6),format='g',flag=' '))
a<-table.element(a,formatC(signif(gqarr[mypoint-kp3+1,2],6),format='g',flag=' '))
a<-table.element(a,formatC(signif(gqarr[mypoint-kp3+1,3],6),format='g',flag=' '))
a<-table.row.end(a)
}
a<-table.end(a)
table.save(a,file='mytable5.tab')
a<-table.start()
a<-table.row.start(a)
a<-table.element(a,'Meta Analysis of Goldfeld-Quandt test for Heteroskedasticity',4,TRUE)
a<-table.row.end(a)
a<-table.row.start(a)
a<-table.element(a,'Description',header=TRUE)
a<-table.element(a,'# significant tests',header=TRUE)
a<-table.element(a,'% significant tests',header=TRUE)
a<-table.element(a,'OK/NOK',header=TRUE)
a<-table.row.end(a)
a<-table.row.start(a)
a<-table.element(a,'1% type I error level',header=TRUE)
a<-table.element(a,signif(numsignificant1,6))
a<-table.element(a,formatC(signif(numsignificant1/numgqtests,6),format='g',flag=' '))
if (numsignificant1/numgqtests < 0.01) dum <- 'OK' else dum <- 'NOK'
a<-table.element(a,dum)
a<-table.row.end(a)
a<-table.row.start(a)
a<-table.element(a,'5% type I error level',header=TRUE)
a<-table.element(a,signif(numsignificant5,6))
a<-table.element(a,signif(numsignificant5/numgqtests,6))
if (numsignificant5/numgqtests < 0.05) dum <- 'OK' else dum <- 'NOK'
a<-table.element(a,dum)
a<-table.row.end(a)
a<-table.row.start(a)
a<-table.element(a,'10% type I error level',header=TRUE)
a<-table.element(a,signif(numsignificant10,6))
a<-table.element(a,signif(numsignificant10/numgqtests,6))
if (numsignificant10/numgqtests < 0.1) dum <- 'OK' else dum <- 'NOK'
a<-table.element(a,dum)
a<-table.row.end(a)
a<-table.end(a)
table.save(a,file='mytable6.tab')
}
}