Free Statistics

of Irreproducible Research!

Author's title

Author*The author of this computation has been verified*
R Software Modulerwasp_multipleregression.wasp
Title produced by softwareMultiple Regression
Date of computationWed, 18 Nov 2009 13:35:45 -0700
Cite this page as followsStatistical Computations at FreeStatistics.org, Office for Research Development and Education, URL https://freestatistics.org/blog/index.php?v=date/2009/Nov/18/t1258576615ja8a51n2yie2rfi.htm/, Retrieved Sun, 28 Apr 2024 12:22:37 +0000
Statistical Computations at FreeStatistics.org, Office for Research Development and Education, URL https://freestatistics.org/blog/index.php?pk=57615, Retrieved Sun, 28 Apr 2024 12:22:37 +0000
QR Codes:

Original text written by user:
IsPrivate?No (this computation is public)
User-defined keywords
Estimated Impact197
Family? (F = Feedback message, R = changed R code, M = changed R Module, P = changed Parameters, D = changed Data)
-     [Multiple Regression] [Q1 The Seatbeltlaw] [2007-11-14 19:27:43] [8cd6641b921d30ebe00b648d1481bba0]
- RMPD  [Multiple Regression] [Seatbelt] [2009-11-12 14:03:14] [b98453cac15ba1066b407e146608df68]
F R  D      [Multiple Regression] [Model 2] [2009-11-18 20:35:45] [026d431dc78a3ce53a040b5408fc0322] [Current]
-    D        [Multiple Regression] [model 2 ws 7] [2009-11-20 14:15:33] [134dc66689e3d457a82860db6471d419]
-   PD        [Multiple Regression] [model 3 ws 7] [2009-11-20 14:17:31] [134dc66689e3d457a82860db6471d419]
Feedback Forum
2009-12-02 18:17:33 [f1e24346ff4ab8a20729561498ad5c34] [reply
Er worden seasonal dummies gemaakt voor de eerste 11 observaties, de 12e observatie is de ‘intercept’.
De getallen van M1 tot M11 geven het aantal weer dat in de andere maanden meer of minder is dan bij de intercept. Enkele getallen zijn negatief; hier is je reeks lager dan bij intercept. De meeste getallen zijn positief, hier ligt je reeks hoger dan de intercept.

Post a new message
Dataseries X:
115.6	0
111.3	0
114.6	0
137.5	0
83.7	0
106.0	0
123.4	0
126.5	0
120.0	0
141.6	0
90.5	0
96.5	0
113.5	0
120.1	0
123.9	0
144.4	0
90.8	0
114.2	0
138.1	0
135.0	0
131.3	0
144.6	0
101.7	0
108.7	0
135.3	0
124.3	0
138.3	0
158.2	0
93.5	0
124.8	0
154.4	0
152.8	0
148.9	0
170.3	0
124.8	0
134.4	0
154.0	0
147.9	0
168.1	0
175.7	0
116.7	0
140.8	0
164.2	0
173.8	0
167.8	0
166.6	0
135.1	1
158.1	1
151.8	1
166.7	1
165.3	1
187.0	1
125.2	1
144.4	1
181.7	1
175.9	1
166.3	1
181.5	1
121.8	1
134.8	1
162.9	1


Summary of computational transaction
Raw Inputview raw input (R code)
Raw Outputview raw output of R engine
Computing time4 seconds
R Server'Gwilym Jenkins' @ 72.249.127.135

\begin{tabular}{lllllllll}
\hline
Summary of computational transaction \tabularnewline
Raw Input & view raw input (R code)  \tabularnewline
Raw Output & view raw output of R engine  \tabularnewline
Computing time & 4 seconds \tabularnewline
R Server & 'Gwilym Jenkins' @ 72.249.127.135 \tabularnewline
\hline
\end{tabular}
%Source: https://freestatistics.org/blog/index.php?pk=57615&T=0

[TABLE]
[ROW][C]Summary of computational transaction[/C][/ROW]
[ROW][C]Raw Input[/C][C]view raw input (R code) [/C][/ROW]
[ROW][C]Raw Output[/C][C]view raw output of R engine [/C][/ROW]
[ROW][C]Computing time[/C][C]4 seconds[/C][/ROW]
[ROW][C]R Server[/C][C]'Gwilym Jenkins' @ 72.249.127.135[/C][/ROW]
[/TABLE]
Source: https://freestatistics.org/blog/index.php?pk=57615&T=0

Globally Unique Identifier (entire table): ba.freestatistics.org/blog/index.php?pk=57615&T=0

As an alternative you can also use a QR Code:  

The GUIDs for individual cells are displayed in the table below:

Summary of computational transaction
Raw Inputview raw input (R code)
Raw Outputview raw output of R engine
Computing time4 seconds
R Server'Gwilym Jenkins' @ 72.249.127.135


Multiple Linear Regression - Estimated Regression Equation
Y[t] = + 114.77 + 29.325X[t] + 14.305M1[t] + 13.425M2[t] + 21.4050000000000M3[t] + 39.925M4[t] -18.655M5[t] + 5.40499999999998M6[t] + 31.7250000000000M7[t] + 32.165M8[t] + 26.225M9[t] + 40.285M10[t] -11.72M11[t] + e[t]

\begin{tabular}{lllllllll}
\hline
Multiple Linear Regression - Estimated Regression Equation \tabularnewline
Y[t] =  +  114.77 +  29.325X[t] +  14.305M1[t] +  13.425M2[t] +  21.4050000000000M3[t] +  39.925M4[t] -18.655M5[t] +  5.40499999999998M6[t] +  31.7250000000000M7[t] +  32.165M8[t] +  26.225M9[t] +  40.285M10[t] -11.72M11[t]  + e[t] \tabularnewline
\hline
\end{tabular}
%Source: https://freestatistics.org/blog/index.php?pk=57615&T=1

[TABLE]
[ROW][C]Multiple Linear Regression - Estimated Regression Equation[/C][/ROW]
[ROW][C]Y[t] =  +  114.77 +  29.325X[t] +  14.305M1[t] +  13.425M2[t] +  21.4050000000000M3[t] +  39.925M4[t] -18.655M5[t] +  5.40499999999998M6[t] +  31.7250000000000M7[t] +  32.165M8[t] +  26.225M9[t] +  40.285M10[t] -11.72M11[t]  + e[t][/C][/ROW]
[/TABLE]
Source: https://freestatistics.org/blog/index.php?pk=57615&T=1

Globally Unique Identifier (entire table): ba.freestatistics.org/blog/index.php?pk=57615&T=1

As an alternative you can also use a QR Code:  

The GUIDs for individual cells are displayed in the table below:

Multiple Linear Regression - Estimated Regression Equation
Y[t] = + 114.77 + 29.325X[t] + 14.305M1[t] + 13.425M2[t] + 21.4050000000000M3[t] + 39.925M4[t] -18.655M5[t] + 5.40499999999998M6[t] + 31.7250000000000M7[t] + 32.165M8[t] + 26.225M9[t] + 40.285M10[t] -11.72M11[t] + e[t]


Multiple Linear Regression - Ordinary Least Squares
VariableParameterS.D.T-STATH0: parameter = 02-tail p-value1-tail p-value
(Intercept)114.777.30385415.713600
X29.3254.7678926.150500
M114.3059.5516631.49760.1407730.070387
M213.42510.0163561.34030.1864550.093228
M321.405000000000010.0163562.1370.0377210.018861
M439.92510.0163563.9860.0002280.000114
M5-18.65510.016356-1.86250.0686660.034333
M65.4049999999999810.0163560.53960.5919560.295978
M731.725000000000010.0163563.16730.0026750.001337
M832.16510.0163563.21120.002360.00118
M926.22510.0163562.61820.0117910.005895
M1040.28510.0163564.02190.0002030.000102
M11-11.729.970862-1.17540.2456220.122811

\begin{tabular}{lllllllll}
\hline
Multiple Linear Regression - Ordinary Least Squares \tabularnewline
Variable & Parameter & S.D. & T-STATH0: parameter = 0 & 2-tail p-value & 1-tail p-value \tabularnewline
(Intercept) & 114.77 & 7.303854 & 15.7136 & 0 & 0 \tabularnewline
X & 29.325 & 4.767892 & 6.1505 & 0 & 0 \tabularnewline
M1 & 14.305 & 9.551663 & 1.4976 & 0.140773 & 0.070387 \tabularnewline
M2 & 13.425 & 10.016356 & 1.3403 & 0.186455 & 0.093228 \tabularnewline
M3 & 21.4050000000000 & 10.016356 & 2.137 & 0.037721 & 0.018861 \tabularnewline
M4 & 39.925 & 10.016356 & 3.986 & 0.000228 & 0.000114 \tabularnewline
M5 & -18.655 & 10.016356 & -1.8625 & 0.068666 & 0.034333 \tabularnewline
M6 & 5.40499999999998 & 10.016356 & 0.5396 & 0.591956 & 0.295978 \tabularnewline
M7 & 31.7250000000000 & 10.016356 & 3.1673 & 0.002675 & 0.001337 \tabularnewline
M8 & 32.165 & 10.016356 & 3.2112 & 0.00236 & 0.00118 \tabularnewline
M9 & 26.225 & 10.016356 & 2.6182 & 0.011791 & 0.005895 \tabularnewline
M10 & 40.285 & 10.016356 & 4.0219 & 0.000203 & 0.000102 \tabularnewline
M11 & -11.72 & 9.970862 & -1.1754 & 0.245622 & 0.122811 \tabularnewline
\hline
\end{tabular}
%Source: https://freestatistics.org/blog/index.php?pk=57615&T=2

[TABLE]
[ROW][C]Multiple Linear Regression - Ordinary Least Squares[/C][/ROW]
[ROW][C]Variable[/C][C]Parameter[/C][C]S.D.[/C][C]T-STATH0: parameter = 0[/C][C]2-tail p-value[/C][C]1-tail p-value[/C][/ROW]
[ROW][C](Intercept)[/C][C]114.77[/C][C]7.303854[/C][C]15.7136[/C][C]0[/C][C]0[/C][/ROW]
[ROW][C]X[/C][C]29.325[/C][C]4.767892[/C][C]6.1505[/C][C]0[/C][C]0[/C][/ROW]
[ROW][C]M1[/C][C]14.305[/C][C]9.551663[/C][C]1.4976[/C][C]0.140773[/C][C]0.070387[/C][/ROW]
[ROW][C]M2[/C][C]13.425[/C][C]10.016356[/C][C]1.3403[/C][C]0.186455[/C][C]0.093228[/C][/ROW]
[ROW][C]M3[/C][C]21.4050000000000[/C][C]10.016356[/C][C]2.137[/C][C]0.037721[/C][C]0.018861[/C][/ROW]
[ROW][C]M4[/C][C]39.925[/C][C]10.016356[/C][C]3.986[/C][C]0.000228[/C][C]0.000114[/C][/ROW]
[ROW][C]M5[/C][C]-18.655[/C][C]10.016356[/C][C]-1.8625[/C][C]0.068666[/C][C]0.034333[/C][/ROW]
[ROW][C]M6[/C][C]5.40499999999998[/C][C]10.016356[/C][C]0.5396[/C][C]0.591956[/C][C]0.295978[/C][/ROW]
[ROW][C]M7[/C][C]31.7250000000000[/C][C]10.016356[/C][C]3.1673[/C][C]0.002675[/C][C]0.001337[/C][/ROW]
[ROW][C]M8[/C][C]32.165[/C][C]10.016356[/C][C]3.2112[/C][C]0.00236[/C][C]0.00118[/C][/ROW]
[ROW][C]M9[/C][C]26.225[/C][C]10.016356[/C][C]2.6182[/C][C]0.011791[/C][C]0.005895[/C][/ROW]
[ROW][C]M10[/C][C]40.285[/C][C]10.016356[/C][C]4.0219[/C][C]0.000203[/C][C]0.000102[/C][/ROW]
[ROW][C]M11[/C][C]-11.72[/C][C]9.970862[/C][C]-1.1754[/C][C]0.245622[/C][C]0.122811[/C][/ROW]
[/TABLE]
Source: https://freestatistics.org/blog/index.php?pk=57615&T=2

Globally Unique Identifier (entire table): ba.freestatistics.org/blog/index.php?pk=57615&T=2

As an alternative you can also use a QR Code:  

The GUIDs for individual cells are displayed in the table below:

Multiple Linear Regression - Ordinary Least Squares
VariableParameterS.D.T-STATH0: parameter = 02-tail p-value1-tail p-value
(Intercept)114.777.30385415.713600
X29.3254.7678926.150500
M114.3059.5516631.49760.1407730.070387
M213.42510.0163561.34030.1864550.093228
M321.405000000000010.0163562.1370.0377210.018861
M439.92510.0163563.9860.0002280.000114
M5-18.65510.016356-1.86250.0686660.034333
M65.4049999999999810.0163560.53960.5919560.295978
M731.725000000000010.0163563.16730.0026750.001337
M832.16510.0163563.21120.002360.00118
M926.22510.0163562.61820.0117910.005895
M1040.28510.0163564.02190.0002030.000102
M11-11.729.970862-1.17540.2456220.122811


Multiple Linear Regression - Regression Statistics
Multiple R0.836555444451901
R-squared0.699825011642118
Adjusted R-squared0.624781264552648
F-TEST (value)9.32556060677188
F-TEST (DF numerator)12
F-TEST (DF denominator)48
p-value6.2330476335859e-09
Multiple Linear Regression - Residual Statistics
Residual Standard Deviation15.7653162961187
Sum Squared Residuals11930.1695

\begin{tabular}{lllllllll}
\hline
Multiple Linear Regression - Regression Statistics \tabularnewline
Multiple R & 0.836555444451901 \tabularnewline
R-squared & 0.699825011642118 \tabularnewline
Adjusted R-squared & 0.624781264552648 \tabularnewline
F-TEST (value) & 9.32556060677188 \tabularnewline
F-TEST (DF numerator) & 12 \tabularnewline
F-TEST (DF denominator) & 48 \tabularnewline
p-value & 6.2330476335859e-09 \tabularnewline
Multiple Linear Regression - Residual Statistics \tabularnewline
Residual Standard Deviation & 15.7653162961187 \tabularnewline
Sum Squared Residuals & 11930.1695 \tabularnewline
\hline
\end{tabular}
%Source: https://freestatistics.org/blog/index.php?pk=57615&T=3

[TABLE]
[ROW][C]Multiple Linear Regression - Regression Statistics[/C][/ROW]
[ROW][C]Multiple R[/C][C]0.836555444451901[/C][/ROW]
[ROW][C]R-squared[/C][C]0.699825011642118[/C][/ROW]
[ROW][C]Adjusted R-squared[/C][C]0.624781264552648[/C][/ROW]
[ROW][C]F-TEST (value)[/C][C]9.32556060677188[/C][/ROW]
[ROW][C]F-TEST (DF numerator)[/C][C]12[/C][/ROW]
[ROW][C]F-TEST (DF denominator)[/C][C]48[/C][/ROW]
[ROW][C]p-value[/C][C]6.2330476335859e-09[/C][/ROW]
[ROW][C]Multiple Linear Regression - Residual Statistics[/C][/ROW]
[ROW][C]Residual Standard Deviation[/C][C]15.7653162961187[/C][/ROW]
[ROW][C]Sum Squared Residuals[/C][C]11930.1695[/C][/ROW]
[/TABLE]
Source: https://freestatistics.org/blog/index.php?pk=57615&T=3

Globally Unique Identifier (entire table): ba.freestatistics.org/blog/index.php?pk=57615&T=3

As an alternative you can also use a QR Code:  

The GUIDs for individual cells are displayed in the table below:

Multiple Linear Regression - Regression Statistics
Multiple R0.836555444451901
R-squared0.699825011642118
Adjusted R-squared0.624781264552648
F-TEST (value)9.32556060677188
F-TEST (DF numerator)12
F-TEST (DF denominator)48
p-value6.2330476335859e-09
Multiple Linear Regression - Residual Statistics
Residual Standard Deviation15.7653162961187
Sum Squared Residuals11930.1695


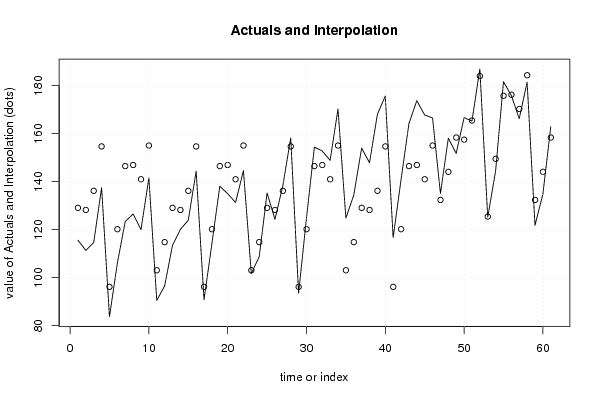
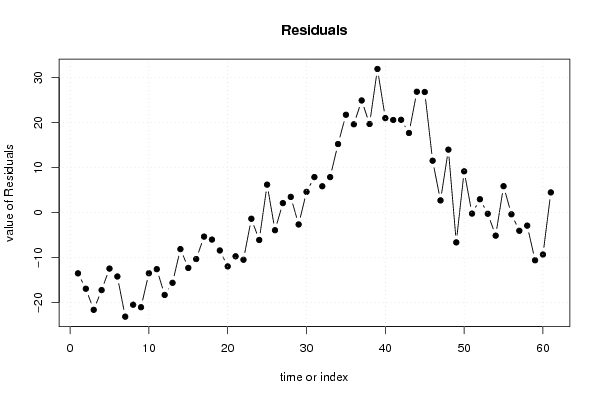
Multiple Linear Regression - Actuals, Interpolation, and Residuals
Time or IndexActualsInterpolationForecastResidualsPrediction Error
1115.6129.075-13.4750000000000
2111.3128.195-16.8950000000000
3114.6136.175-21.575
4137.5154.695-17.1950000000000
583.796.115-12.415
6106120.175-14.1750000000000
7123.4146.495-23.0950000000000
8126.5146.935-20.435
9120140.995-20.995
10141.6155.055-13.455
1190.5103.05-12.5500000000000
1296.5114.77-18.27
13113.5129.075-15.575
14120.1128.195-8.095
15123.9136.175-12.275
16144.4154.695-10.2950000000000
1790.896.115-5.31500000000001
18114.2120.175-5.97499999999999
19138.1146.495-8.39499999999999
20135146.935-11.935
21131.3140.995-9.695
22144.6155.055-10.455
23101.7103.05-1.35000000000000
24108.7114.77-6.07000000000002
25135.3129.0756.225
26124.3128.195-3.89500000000000
27138.3136.1752.12500000000001
28158.2154.6953.50500000000001
2993.596.115-2.61500000000001
30124.8120.1754.625
31154.4146.4957.90500000000002
32152.8146.9355.86500000000001
33148.9140.9957.90499999999999
34170.3155.05515.2450000000000
35124.8103.0521.75
36134.4114.7719.6300000000000
37154129.07524.925
38147.9128.19519.705
39168.1136.17531.925
40175.7154.69521.005
41116.796.11520.585
42140.8120.17520.625
43164.2146.49517.705
44173.8146.93526.865
45167.8140.99526.805
46166.6155.05511.545
47135.1132.3752.72499999999999
48158.1144.09514.0050000000000
49151.8158.4-6.6
50166.7157.529.18
51165.3165.5-0.199999999999981
52187184.022.98000000000004
53125.2125.44-0.240000000000006
54144.4149.5-5.09999999999999
55181.7175.825.88
56175.9176.26-0.359999999999999
57166.3170.32-4.02
58181.5184.38-2.88000000000001
59121.8132.375-10.575
60134.8144.095-9.29500000000001
61162.9158.44.49999999999999

\begin{tabular}{lllllllll}
\hline
Multiple Linear Regression - Actuals, Interpolation, and Residuals \tabularnewline
Time or Index & Actuals & InterpolationForecast & ResidualsPrediction Error \tabularnewline
1 & 115.6 & 129.075 & -13.4750000000000 \tabularnewline
2 & 111.3 & 128.195 & -16.8950000000000 \tabularnewline
3 & 114.6 & 136.175 & -21.575 \tabularnewline
4 & 137.5 & 154.695 & -17.1950000000000 \tabularnewline
5 & 83.7 & 96.115 & -12.415 \tabularnewline
6 & 106 & 120.175 & -14.1750000000000 \tabularnewline
7 & 123.4 & 146.495 & -23.0950000000000 \tabularnewline
8 & 126.5 & 146.935 & -20.435 \tabularnewline
9 & 120 & 140.995 & -20.995 \tabularnewline
10 & 141.6 & 155.055 & -13.455 \tabularnewline
11 & 90.5 & 103.05 & -12.5500000000000 \tabularnewline
12 & 96.5 & 114.77 & -18.27 \tabularnewline
13 & 113.5 & 129.075 & -15.575 \tabularnewline
14 & 120.1 & 128.195 & -8.095 \tabularnewline
15 & 123.9 & 136.175 & -12.275 \tabularnewline
16 & 144.4 & 154.695 & -10.2950000000000 \tabularnewline
17 & 90.8 & 96.115 & -5.31500000000001 \tabularnewline
18 & 114.2 & 120.175 & -5.97499999999999 \tabularnewline
19 & 138.1 & 146.495 & -8.39499999999999 \tabularnewline
20 & 135 & 146.935 & -11.935 \tabularnewline
21 & 131.3 & 140.995 & -9.695 \tabularnewline
22 & 144.6 & 155.055 & -10.455 \tabularnewline
23 & 101.7 & 103.05 & -1.35000000000000 \tabularnewline
24 & 108.7 & 114.77 & -6.07000000000002 \tabularnewline
25 & 135.3 & 129.075 & 6.225 \tabularnewline
26 & 124.3 & 128.195 & -3.89500000000000 \tabularnewline
27 & 138.3 & 136.175 & 2.12500000000001 \tabularnewline
28 & 158.2 & 154.695 & 3.50500000000001 \tabularnewline
29 & 93.5 & 96.115 & -2.61500000000001 \tabularnewline
30 & 124.8 & 120.175 & 4.625 \tabularnewline
31 & 154.4 & 146.495 & 7.90500000000002 \tabularnewline
32 & 152.8 & 146.935 & 5.86500000000001 \tabularnewline
33 & 148.9 & 140.995 & 7.90499999999999 \tabularnewline
34 & 170.3 & 155.055 & 15.2450000000000 \tabularnewline
35 & 124.8 & 103.05 & 21.75 \tabularnewline
36 & 134.4 & 114.77 & 19.6300000000000 \tabularnewline
37 & 154 & 129.075 & 24.925 \tabularnewline
38 & 147.9 & 128.195 & 19.705 \tabularnewline
39 & 168.1 & 136.175 & 31.925 \tabularnewline
40 & 175.7 & 154.695 & 21.005 \tabularnewline
41 & 116.7 & 96.115 & 20.585 \tabularnewline
42 & 140.8 & 120.175 & 20.625 \tabularnewline
43 & 164.2 & 146.495 & 17.705 \tabularnewline
44 & 173.8 & 146.935 & 26.865 \tabularnewline
45 & 167.8 & 140.995 & 26.805 \tabularnewline
46 & 166.6 & 155.055 & 11.545 \tabularnewline
47 & 135.1 & 132.375 & 2.72499999999999 \tabularnewline
48 & 158.1 & 144.095 & 14.0050000000000 \tabularnewline
49 & 151.8 & 158.4 & -6.6 \tabularnewline
50 & 166.7 & 157.52 & 9.18 \tabularnewline
51 & 165.3 & 165.5 & -0.199999999999981 \tabularnewline
52 & 187 & 184.02 & 2.98000000000004 \tabularnewline
53 & 125.2 & 125.44 & -0.240000000000006 \tabularnewline
54 & 144.4 & 149.5 & -5.09999999999999 \tabularnewline
55 & 181.7 & 175.82 & 5.88 \tabularnewline
56 & 175.9 & 176.26 & -0.359999999999999 \tabularnewline
57 & 166.3 & 170.32 & -4.02 \tabularnewline
58 & 181.5 & 184.38 & -2.88000000000001 \tabularnewline
59 & 121.8 & 132.375 & -10.575 \tabularnewline
60 & 134.8 & 144.095 & -9.29500000000001 \tabularnewline
61 & 162.9 & 158.4 & 4.49999999999999 \tabularnewline
\hline
\end{tabular}
%Source: https://freestatistics.org/blog/index.php?pk=57615&T=4

[TABLE]
[ROW][C]Multiple Linear Regression - Actuals, Interpolation, and Residuals[/C][/ROW]
[ROW][C]Time or Index[/C][C]Actuals[/C][C]InterpolationForecast[/C][C]ResidualsPrediction Error[/C][/ROW]
[ROW][C]1[/C][C]115.6[/C][C]129.075[/C][C]-13.4750000000000[/C][/ROW]
[ROW][C]2[/C][C]111.3[/C][C]128.195[/C][C]-16.8950000000000[/C][/ROW]
[ROW][C]3[/C][C]114.6[/C][C]136.175[/C][C]-21.575[/C][/ROW]
[ROW][C]4[/C][C]137.5[/C][C]154.695[/C][C]-17.1950000000000[/C][/ROW]
[ROW][C]5[/C][C]83.7[/C][C]96.115[/C][C]-12.415[/C][/ROW]
[ROW][C]6[/C][C]106[/C][C]120.175[/C][C]-14.1750000000000[/C][/ROW]
[ROW][C]7[/C][C]123.4[/C][C]146.495[/C][C]-23.0950000000000[/C][/ROW]
[ROW][C]8[/C][C]126.5[/C][C]146.935[/C][C]-20.435[/C][/ROW]
[ROW][C]9[/C][C]120[/C][C]140.995[/C][C]-20.995[/C][/ROW]
[ROW][C]10[/C][C]141.6[/C][C]155.055[/C][C]-13.455[/C][/ROW]
[ROW][C]11[/C][C]90.5[/C][C]103.05[/C][C]-12.5500000000000[/C][/ROW]
[ROW][C]12[/C][C]96.5[/C][C]114.77[/C][C]-18.27[/C][/ROW]
[ROW][C]13[/C][C]113.5[/C][C]129.075[/C][C]-15.575[/C][/ROW]
[ROW][C]14[/C][C]120.1[/C][C]128.195[/C][C]-8.095[/C][/ROW]
[ROW][C]15[/C][C]123.9[/C][C]136.175[/C][C]-12.275[/C][/ROW]
[ROW][C]16[/C][C]144.4[/C][C]154.695[/C][C]-10.2950000000000[/C][/ROW]
[ROW][C]17[/C][C]90.8[/C][C]96.115[/C][C]-5.31500000000001[/C][/ROW]
[ROW][C]18[/C][C]114.2[/C][C]120.175[/C][C]-5.97499999999999[/C][/ROW]
[ROW][C]19[/C][C]138.1[/C][C]146.495[/C][C]-8.39499999999999[/C][/ROW]
[ROW][C]20[/C][C]135[/C][C]146.935[/C][C]-11.935[/C][/ROW]
[ROW][C]21[/C][C]131.3[/C][C]140.995[/C][C]-9.695[/C][/ROW]
[ROW][C]22[/C][C]144.6[/C][C]155.055[/C][C]-10.455[/C][/ROW]
[ROW][C]23[/C][C]101.7[/C][C]103.05[/C][C]-1.35000000000000[/C][/ROW]
[ROW][C]24[/C][C]108.7[/C][C]114.77[/C][C]-6.07000000000002[/C][/ROW]
[ROW][C]25[/C][C]135.3[/C][C]129.075[/C][C]6.225[/C][/ROW]
[ROW][C]26[/C][C]124.3[/C][C]128.195[/C][C]-3.89500000000000[/C][/ROW]
[ROW][C]27[/C][C]138.3[/C][C]136.175[/C][C]2.12500000000001[/C][/ROW]
[ROW][C]28[/C][C]158.2[/C][C]154.695[/C][C]3.50500000000001[/C][/ROW]
[ROW][C]29[/C][C]93.5[/C][C]96.115[/C][C]-2.61500000000001[/C][/ROW]
[ROW][C]30[/C][C]124.8[/C][C]120.175[/C][C]4.625[/C][/ROW]
[ROW][C]31[/C][C]154.4[/C][C]146.495[/C][C]7.90500000000002[/C][/ROW]
[ROW][C]32[/C][C]152.8[/C][C]146.935[/C][C]5.86500000000001[/C][/ROW]
[ROW][C]33[/C][C]148.9[/C][C]140.995[/C][C]7.90499999999999[/C][/ROW]
[ROW][C]34[/C][C]170.3[/C][C]155.055[/C][C]15.2450000000000[/C][/ROW]
[ROW][C]35[/C][C]124.8[/C][C]103.05[/C][C]21.75[/C][/ROW]
[ROW][C]36[/C][C]134.4[/C][C]114.77[/C][C]19.6300000000000[/C][/ROW]
[ROW][C]37[/C][C]154[/C][C]129.075[/C][C]24.925[/C][/ROW]
[ROW][C]38[/C][C]147.9[/C][C]128.195[/C][C]19.705[/C][/ROW]
[ROW][C]39[/C][C]168.1[/C][C]136.175[/C][C]31.925[/C][/ROW]
[ROW][C]40[/C][C]175.7[/C][C]154.695[/C][C]21.005[/C][/ROW]
[ROW][C]41[/C][C]116.7[/C][C]96.115[/C][C]20.585[/C][/ROW]
[ROW][C]42[/C][C]140.8[/C][C]120.175[/C][C]20.625[/C][/ROW]
[ROW][C]43[/C][C]164.2[/C][C]146.495[/C][C]17.705[/C][/ROW]
[ROW][C]44[/C][C]173.8[/C][C]146.935[/C][C]26.865[/C][/ROW]
[ROW][C]45[/C][C]167.8[/C][C]140.995[/C][C]26.805[/C][/ROW]
[ROW][C]46[/C][C]166.6[/C][C]155.055[/C][C]11.545[/C][/ROW]
[ROW][C]47[/C][C]135.1[/C][C]132.375[/C][C]2.72499999999999[/C][/ROW]
[ROW][C]48[/C][C]158.1[/C][C]144.095[/C][C]14.0050000000000[/C][/ROW]
[ROW][C]49[/C][C]151.8[/C][C]158.4[/C][C]-6.6[/C][/ROW]
[ROW][C]50[/C][C]166.7[/C][C]157.52[/C][C]9.18[/C][/ROW]
[ROW][C]51[/C][C]165.3[/C][C]165.5[/C][C]-0.199999999999981[/C][/ROW]
[ROW][C]52[/C][C]187[/C][C]184.02[/C][C]2.98000000000004[/C][/ROW]
[ROW][C]53[/C][C]125.2[/C][C]125.44[/C][C]-0.240000000000006[/C][/ROW]
[ROW][C]54[/C][C]144.4[/C][C]149.5[/C][C]-5.09999999999999[/C][/ROW]
[ROW][C]55[/C][C]181.7[/C][C]175.82[/C][C]5.88[/C][/ROW]
[ROW][C]56[/C][C]175.9[/C][C]176.26[/C][C]-0.359999999999999[/C][/ROW]
[ROW][C]57[/C][C]166.3[/C][C]170.32[/C][C]-4.02[/C][/ROW]
[ROW][C]58[/C][C]181.5[/C][C]184.38[/C][C]-2.88000000000001[/C][/ROW]
[ROW][C]59[/C][C]121.8[/C][C]132.375[/C][C]-10.575[/C][/ROW]
[ROW][C]60[/C][C]134.8[/C][C]144.095[/C][C]-9.29500000000001[/C][/ROW]
[ROW][C]61[/C][C]162.9[/C][C]158.4[/C][C]4.49999999999999[/C][/ROW]
[/TABLE]
Source: https://freestatistics.org/blog/index.php?pk=57615&T=4

Globally Unique Identifier (entire table): ba.freestatistics.org/blog/index.php?pk=57615&T=4

As an alternative you can also use a QR Code:  

The GUIDs for individual cells are displayed in the table below:

Multiple Linear Regression - Actuals, Interpolation, and Residuals
Time or IndexActualsInterpolationForecastResidualsPrediction Error
1115.6129.075-13.4750000000000
2111.3128.195-16.8950000000000
3114.6136.175-21.575
4137.5154.695-17.1950000000000
583.796.115-12.415
6106120.175-14.1750000000000
7123.4146.495-23.0950000000000
8126.5146.935-20.435
9120140.995-20.995
10141.6155.055-13.455
1190.5103.05-12.5500000000000
1296.5114.77-18.27
13113.5129.075-15.575
14120.1128.195-8.095
15123.9136.175-12.275
16144.4154.695-10.2950000000000
1790.896.115-5.31500000000001
18114.2120.175-5.97499999999999
19138.1146.495-8.39499999999999
20135146.935-11.935
21131.3140.995-9.695
22144.6155.055-10.455
23101.7103.05-1.35000000000000
24108.7114.77-6.07000000000002
25135.3129.0756.225
26124.3128.195-3.89500000000000
27138.3136.1752.12500000000001
28158.2154.6953.50500000000001
2993.596.115-2.61500000000001
30124.8120.1754.625
31154.4146.4957.90500000000002
32152.8146.9355.86500000000001
33148.9140.9957.90499999999999
34170.3155.05515.2450000000000
35124.8103.0521.75
36134.4114.7719.6300000000000
37154129.07524.925
38147.9128.19519.705
39168.1136.17531.925
40175.7154.69521.005
41116.796.11520.585
42140.8120.17520.625
43164.2146.49517.705
44173.8146.93526.865
45167.8140.99526.805
46166.6155.05511.545
47135.1132.3752.72499999999999
48158.1144.09514.0050000000000
49151.8158.4-6.6
50166.7157.529.18
51165.3165.5-0.199999999999981
52187184.022.98000000000004
53125.2125.44-0.240000000000006
54144.4149.5-5.09999999999999
55181.7175.825.88
56175.9176.26-0.359999999999999
57166.3170.32-4.02
58181.5184.38-2.88000000000001
59121.8132.375-10.575
60134.8144.095-9.29500000000001
61162.9158.44.49999999999999


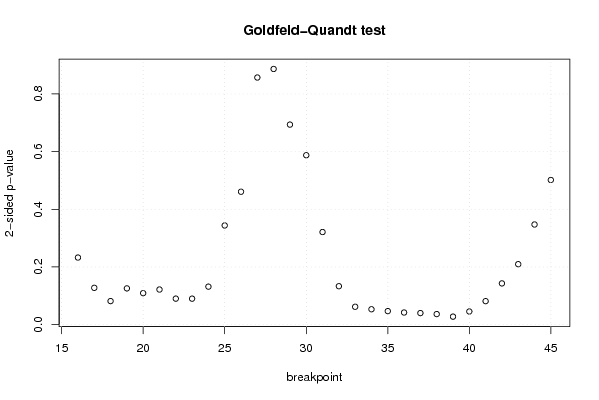
Goldfeld-Quandt test for Heteroskedasticity
p-valuesAlternative Hypothesis
breakpoint indexgreater2-sidedless
160.1162704479096490.2325408958192990.88372955209035
170.063789788601290.1275795772025800.93621021139871
180.04077750144412420.08155500288824840.959222498555876
190.06282882737941140.1256576547588230.937171172620589
200.05455889019948370.1091177803989670.945441109800516
210.06083600557084160.1216720111416830.939163994429158
220.04504060482858890.09008120965717780.954959395171411
230.04501049670372460.09002099340744920.954989503296275
240.0658292847693560.1316585695387120.934170715230644
250.1719162774909660.3438325549819320.828083722509034
260.2303896044879200.4607792089758400.76961039551208
270.4283704613683240.8567409227366490.571629538631676
280.5567764997521480.8864470004957030.443223500247852
290.653256940273050.6934861194538990.346743059726949
300.7063516253059580.5872967493880840.293648374694042
310.8394956326353430.3210087347293140.160504367364657
320.9334200229979660.1331599540040680.0665799770020338
330.9690467304444770.06190653911104550.0309532695555228
340.9733639680010730.05327206399785330.0266360319989267
350.9765484445917550.04690311081649030.0234515554082452
360.9790045435496070.04199091290078660.0209954564503933
370.9799893300603620.04002133987927590.0200106699396380
380.9817238785399040.0365522429201930.0182761214600965
390.9861769327578180.02764613448436300.0138230672421815
400.9772258252064470.04554834958710580.0227741747935529
410.9593132011297060.08137359774058890.0406867988702944
420.9285120309234780.1429759381530450.0714879690765224
430.8952212058620770.2095575882758450.104778794137923
440.8264173339561360.3471653320877270.173582666043864
450.749251488737750.5014970225245010.250748511262251

\begin{tabular}{lllllllll}
\hline
Goldfeld-Quandt test for Heteroskedasticity \tabularnewline
p-values & Alternative Hypothesis \tabularnewline
breakpoint index & greater & 2-sided & less \tabularnewline
16 & 0.116270447909649 & 0.232540895819299 & 0.88372955209035 \tabularnewline
17 & 0.06378978860129 & 0.127579577202580 & 0.93621021139871 \tabularnewline
18 & 0.0407775014441242 & 0.0815550028882484 & 0.959222498555876 \tabularnewline
19 & 0.0628288273794114 & 0.125657654758823 & 0.937171172620589 \tabularnewline
20 & 0.0545588901994837 & 0.109117780398967 & 0.945441109800516 \tabularnewline
21 & 0.0608360055708416 & 0.121672011141683 & 0.939163994429158 \tabularnewline
22 & 0.0450406048285889 & 0.0900812096571778 & 0.954959395171411 \tabularnewline
23 & 0.0450104967037246 & 0.0900209934074492 & 0.954989503296275 \tabularnewline
24 & 0.065829284769356 & 0.131658569538712 & 0.934170715230644 \tabularnewline
25 & 0.171916277490966 & 0.343832554981932 & 0.828083722509034 \tabularnewline
26 & 0.230389604487920 & 0.460779208975840 & 0.76961039551208 \tabularnewline
27 & 0.428370461368324 & 0.856740922736649 & 0.571629538631676 \tabularnewline
28 & 0.556776499752148 & 0.886447000495703 & 0.443223500247852 \tabularnewline
29 & 0.65325694027305 & 0.693486119453899 & 0.346743059726949 \tabularnewline
30 & 0.706351625305958 & 0.587296749388084 & 0.293648374694042 \tabularnewline
31 & 0.839495632635343 & 0.321008734729314 & 0.160504367364657 \tabularnewline
32 & 0.933420022997966 & 0.133159954004068 & 0.0665799770020338 \tabularnewline
33 & 0.969046730444477 & 0.0619065391110455 & 0.0309532695555228 \tabularnewline
34 & 0.973363968001073 & 0.0532720639978533 & 0.0266360319989267 \tabularnewline
35 & 0.976548444591755 & 0.0469031108164903 & 0.0234515554082452 \tabularnewline
36 & 0.979004543549607 & 0.0419909129007866 & 0.0209954564503933 \tabularnewline
37 & 0.979989330060362 & 0.0400213398792759 & 0.0200106699396380 \tabularnewline
38 & 0.981723878539904 & 0.036552242920193 & 0.0182761214600965 \tabularnewline
39 & 0.986176932757818 & 0.0276461344843630 & 0.0138230672421815 \tabularnewline
40 & 0.977225825206447 & 0.0455483495871058 & 0.0227741747935529 \tabularnewline
41 & 0.959313201129706 & 0.0813735977405889 & 0.0406867988702944 \tabularnewline
42 & 0.928512030923478 & 0.142975938153045 & 0.0714879690765224 \tabularnewline
43 & 0.895221205862077 & 0.209557588275845 & 0.104778794137923 \tabularnewline
44 & 0.826417333956136 & 0.347165332087727 & 0.173582666043864 \tabularnewline
45 & 0.74925148873775 & 0.501497022524501 & 0.250748511262251 \tabularnewline
\hline
\end{tabular}
%Source: https://freestatistics.org/blog/index.php?pk=57615&T=5

[TABLE]
[ROW][C]Goldfeld-Quandt test for Heteroskedasticity[/C][/ROW]
[ROW][C]p-values[/C][C]Alternative Hypothesis[/C][/ROW]
[ROW][C]breakpoint index[/C][C]greater[/C][C]2-sided[/C][C]less[/C][/ROW]
[ROW][C]16[/C][C]0.116270447909649[/C][C]0.232540895819299[/C][C]0.88372955209035[/C][/ROW]
[ROW][C]17[/C][C]0.06378978860129[/C][C]0.127579577202580[/C][C]0.93621021139871[/C][/ROW]
[ROW][C]18[/C][C]0.0407775014441242[/C][C]0.0815550028882484[/C][C]0.959222498555876[/C][/ROW]
[ROW][C]19[/C][C]0.0628288273794114[/C][C]0.125657654758823[/C][C]0.937171172620589[/C][/ROW]
[ROW][C]20[/C][C]0.0545588901994837[/C][C]0.109117780398967[/C][C]0.945441109800516[/C][/ROW]
[ROW][C]21[/C][C]0.0608360055708416[/C][C]0.121672011141683[/C][C]0.939163994429158[/C][/ROW]
[ROW][C]22[/C][C]0.0450406048285889[/C][C]0.0900812096571778[/C][C]0.954959395171411[/C][/ROW]
[ROW][C]23[/C][C]0.0450104967037246[/C][C]0.0900209934074492[/C][C]0.954989503296275[/C][/ROW]
[ROW][C]24[/C][C]0.065829284769356[/C][C]0.131658569538712[/C][C]0.934170715230644[/C][/ROW]
[ROW][C]25[/C][C]0.171916277490966[/C][C]0.343832554981932[/C][C]0.828083722509034[/C][/ROW]
[ROW][C]26[/C][C]0.230389604487920[/C][C]0.460779208975840[/C][C]0.76961039551208[/C][/ROW]
[ROW][C]27[/C][C]0.428370461368324[/C][C]0.856740922736649[/C][C]0.571629538631676[/C][/ROW]
[ROW][C]28[/C][C]0.556776499752148[/C][C]0.886447000495703[/C][C]0.443223500247852[/C][/ROW]
[ROW][C]29[/C][C]0.65325694027305[/C][C]0.693486119453899[/C][C]0.346743059726949[/C][/ROW]
[ROW][C]30[/C][C]0.706351625305958[/C][C]0.587296749388084[/C][C]0.293648374694042[/C][/ROW]
[ROW][C]31[/C][C]0.839495632635343[/C][C]0.321008734729314[/C][C]0.160504367364657[/C][/ROW]
[ROW][C]32[/C][C]0.933420022997966[/C][C]0.133159954004068[/C][C]0.0665799770020338[/C][/ROW]
[ROW][C]33[/C][C]0.969046730444477[/C][C]0.0619065391110455[/C][C]0.0309532695555228[/C][/ROW]
[ROW][C]34[/C][C]0.973363968001073[/C][C]0.0532720639978533[/C][C]0.0266360319989267[/C][/ROW]
[ROW][C]35[/C][C]0.976548444591755[/C][C]0.0469031108164903[/C][C]0.0234515554082452[/C][/ROW]
[ROW][C]36[/C][C]0.979004543549607[/C][C]0.0419909129007866[/C][C]0.0209954564503933[/C][/ROW]
[ROW][C]37[/C][C]0.979989330060362[/C][C]0.0400213398792759[/C][C]0.0200106699396380[/C][/ROW]
[ROW][C]38[/C][C]0.981723878539904[/C][C]0.036552242920193[/C][C]0.0182761214600965[/C][/ROW]
[ROW][C]39[/C][C]0.986176932757818[/C][C]0.0276461344843630[/C][C]0.0138230672421815[/C][/ROW]
[ROW][C]40[/C][C]0.977225825206447[/C][C]0.0455483495871058[/C][C]0.0227741747935529[/C][/ROW]
[ROW][C]41[/C][C]0.959313201129706[/C][C]0.0813735977405889[/C][C]0.0406867988702944[/C][/ROW]
[ROW][C]42[/C][C]0.928512030923478[/C][C]0.142975938153045[/C][C]0.0714879690765224[/C][/ROW]
[ROW][C]43[/C][C]0.895221205862077[/C][C]0.209557588275845[/C][C]0.104778794137923[/C][/ROW]
[ROW][C]44[/C][C]0.826417333956136[/C][C]0.347165332087727[/C][C]0.173582666043864[/C][/ROW]
[ROW][C]45[/C][C]0.74925148873775[/C][C]0.501497022524501[/C][C]0.250748511262251[/C][/ROW]
[/TABLE]
Source: https://freestatistics.org/blog/index.php?pk=57615&T=5

Globally Unique Identifier (entire table): ba.freestatistics.org/blog/index.php?pk=57615&T=5

As an alternative you can also use a QR Code:  

The GUIDs for individual cells are displayed in the table below:

Goldfeld-Quandt test for Heteroskedasticity
p-valuesAlternative Hypothesis
breakpoint indexgreater2-sidedless
160.1162704479096490.2325408958192990.88372955209035
170.063789788601290.1275795772025800.93621021139871
180.04077750144412420.08155500288824840.959222498555876
190.06282882737941140.1256576547588230.937171172620589
200.05455889019948370.1091177803989670.945441109800516
210.06083600557084160.1216720111416830.939163994429158
220.04504060482858890.09008120965717780.954959395171411
230.04501049670372460.09002099340744920.954989503296275
240.0658292847693560.1316585695387120.934170715230644
250.1719162774909660.3438325549819320.828083722509034
260.2303896044879200.4607792089758400.76961039551208
270.4283704613683240.8567409227366490.571629538631676
280.5567764997521480.8864470004957030.443223500247852
290.653256940273050.6934861194538990.346743059726949
300.7063516253059580.5872967493880840.293648374694042
310.8394956326353430.3210087347293140.160504367364657
320.9334200229979660.1331599540040680.0665799770020338
330.9690467304444770.06190653911104550.0309532695555228
340.9733639680010730.05327206399785330.0266360319989267
350.9765484445917550.04690311081649030.0234515554082452
360.9790045435496070.04199091290078660.0209954564503933
370.9799893300603620.04002133987927590.0200106699396380
380.9817238785399040.0365522429201930.0182761214600965
390.9861769327578180.02764613448436300.0138230672421815
400.9772258252064470.04554834958710580.0227741747935529
410.9593132011297060.08137359774058890.0406867988702944
420.9285120309234780.1429759381530450.0714879690765224
430.8952212058620770.2095575882758450.104778794137923
440.8264173339561360.3471653320877270.173582666043864
450.749251488737750.5014970225245010.250748511262251


Meta Analysis of Goldfeld-Quandt test for Heteroskedasticity
Description# significant tests% significant testsOK/NOK
1% type I error level00OK
5% type I error level60.2NOK
10% type I error level120.4NOK

\begin{tabular}{lllllllll}
\hline
Meta Analysis of Goldfeld-Quandt test for Heteroskedasticity \tabularnewline
Description & # significant tests & % significant tests & OK/NOK \tabularnewline
1% type I error level & 0 & 0 & OK \tabularnewline
5% type I error level & 6 & 0.2 & NOK \tabularnewline
10% type I error level & 12 & 0.4 & NOK \tabularnewline
\hline
\end{tabular}
%Source: https://freestatistics.org/blog/index.php?pk=57615&T=6

[TABLE]
[ROW][C]Meta Analysis of Goldfeld-Quandt test for Heteroskedasticity[/C][/ROW]
[ROW][C]Description[/C][C]# significant tests[/C][C]% significant tests[/C][C]OK/NOK[/C][/ROW]
[ROW][C]1% type I error level[/C][C]0[/C][C]0[/C][C]OK[/C][/ROW]
[ROW][C]5% type I error level[/C][C]6[/C][C]0.2[/C][C]NOK[/C][/ROW]
[ROW][C]10% type I error level[/C][C]12[/C][C]0.4[/C][C]NOK[/C][/ROW]
[/TABLE]
Source: https://freestatistics.org/blog/index.php?pk=57615&T=6

Globally Unique Identifier (entire table): ba.freestatistics.org/blog/index.php?pk=57615&T=6

As an alternative you can also use a QR Code:  

The GUIDs for individual cells are displayed in the table below:

Meta Analysis of Goldfeld-Quandt test for Heteroskedasticity
Description# significant tests% significant testsOK/NOK
1% type I error level00OK
5% type I error level60.2NOK
10% type I error level120.4NOK


Parameters (Session):
par1 = 1 ; par2 = Include Monthly Dummies ; par3 = No Linear Trend ;
Parameters (R input):
par1 = 1 ; par2 = Include Monthly Dummies ; par3 = No Linear Trend ;
R code (references can be found in the software module):
library(lattice)
library(lmtest)
n25 <- 25 #minimum number of obs. for Goldfeld-Quandt test
par1 <- as.numeric(par1)
x <- t(y)
k <- length(x[1,])
n <- length(x[,1])
x1 <- cbind(x[,par1], x[,1:k!=par1])
mycolnames <- c(colnames(x)[par1], colnames(x)[1:k!=par1])
colnames(x1) <- mycolnames #colnames(x)[par1]
x <- x1
if (par3 == 'First Differences'){
x2 <- array(0, dim=c(n-1,k), dimnames=list(1:(n-1), paste('(1-B)',colnames(x),sep='')))
for (i in 1:n-1) {
for (j in 1:k) {
x2[i,j] <- x[i+1,j] - x[i,j]
}
}
x <- x2
}
if (par2 == 'Include Monthly Dummies'){
x2 <- array(0, dim=c(n,11), dimnames=list(1:n, paste('M', seq(1:11), sep ='')))
for (i in 1:11){
x2[seq(i,n,12),i] <- 1
}
x <- cbind(x, x2)
}
if (par2 == 'Include Quarterly Dummies'){
x2 <- array(0, dim=c(n,3), dimnames=list(1:n, paste('Q', seq(1:3), sep ='')))
for (i in 1:3){
x2[seq(i,n,4),i] <- 1
}
x <- cbind(x, x2)
}
k <- length(x[1,])
if (par3 == 'Linear Trend'){
x <- cbind(x, c(1:n))
colnames(x)[k+1] <- 't'
}
x
k <- length(x[1,])
df <- as.data.frame(x)
(mylm <- lm(df))
(mysum <- summary(mylm))
if (n > n25) {
kp3 <- k + 3
nmkm3 <- n - k - 3
gqarr <- array(NA, dim=c(nmkm3-kp3+1,3))
numgqtests <- 0
numsignificant1 <- 0
numsignificant5 <- 0
numsignificant10 <- 0
for (mypoint in kp3:nmkm3) {
j <- 0
numgqtests <- numgqtests + 1
for (myalt in c('greater', 'two.sided', 'less')) {
j <- j + 1
gqarr[mypoint-kp3+1,j] <- gqtest(mylm, point=mypoint, alternative=myalt)$p.value
}
if (gqarr[mypoint-kp3+1,2] < 0.01) numsignificant1 <- numsignificant1 + 1
if (gqarr[mypoint-kp3+1,2] < 0.05) numsignificant5 <- numsignificant5 + 1
if (gqarr[mypoint-kp3+1,2] < 0.10) numsignificant10 <- numsignificant10 + 1
}
gqarr
}
bitmap(file='test0.png')
plot(x[,1], type='l', main='Actuals and Interpolation', ylab='value of Actuals and Interpolation (dots)', xlab='time or index')
points(x[,1]-mysum$resid)
grid()
dev.off()
bitmap(file='test1.png')
plot(mysum$resid, type='b', pch=19, main='Residuals', ylab='value of Residuals', xlab='time or index')
grid()
dev.off()
bitmap(file='test2.png')
hist(mysum$resid, main='Residual Histogram', xlab='values of Residuals')
grid()
dev.off()
bitmap(file='test3.png')
densityplot(~mysum$resid,col='black',main='Residual Density Plot', xlab='values of Residuals')
dev.off()
bitmap(file='test4.png')
qqnorm(mysum$resid, main='Residual Normal Q-Q Plot')
qqline(mysum$resid)
grid()
dev.off()
(myerror <- as.ts(mysum$resid))
bitmap(file='test5.png')
dum <- cbind(lag(myerror,k=1),myerror)
dum
dum1 <- dum[2:length(myerror),]
dum1
z <- as.data.frame(dum1)
z
plot(z,main=paste('Residual Lag plot, lowess, and regression line'), ylab='values of Residuals', xlab='lagged values of Residuals')
lines(lowess(z))
abline(lm(z))
grid()
dev.off()
bitmap(file='test6.png')
acf(mysum$resid, lag.max=length(mysum$resid)/2, main='Residual Autocorrelation Function')
grid()
dev.off()
bitmap(file='test7.png')
pacf(mysum$resid, lag.max=length(mysum$resid)/2, main='Residual Partial Autocorrelation Function')
grid()
dev.off()
bitmap(file='test8.png')
opar <- par(mfrow = c(2,2), oma = c(0, 0, 1.1, 0))
plot(mylm, las = 1, sub='Residual Diagnostics')
par(opar)
dev.off()
if (n > n25) {
bitmap(file='test9.png')
plot(kp3:nmkm3,gqarr[,2], main='Goldfeld-Quandt test',ylab='2-sided p-value',xlab='breakpoint')
grid()
dev.off()
}
load(file='createtable')
a<-table.start()
a<-table.row.start(a)
a<-table.element(a, 'Multiple Linear Regression - Estimated Regression Equation', 1, TRUE)
a<-table.row.end(a)
myeq <- colnames(x)[1]
myeq <- paste(myeq, '[t] = ', sep='')
for (i in 1:k){
if (mysum$coefficients[i,1] > 0) myeq <- paste(myeq, '+', '')
myeq <- paste(myeq, mysum$coefficients[i,1], sep=' ')
if (rownames(mysum$coefficients)[i] != '(Intercept)') {
myeq <- paste(myeq, rownames(mysum$coefficients)[i], sep='')
if (rownames(mysum$coefficients)[i] != 't') myeq <- paste(myeq, '[t]', sep='')
}
}
myeq <- paste(myeq, ' + e[t]')
a<-table.row.start(a)
a<-table.element(a, myeq)
a<-table.row.end(a)
a<-table.end(a)
table.save(a,file='mytable1.tab')
a<-table.start()
a<-table.row.start(a)
a<-table.element(a,hyperlink('ols1.htm','Multiple Linear Regression - Ordinary Least Squares',''), 6, TRUE)
a<-table.row.end(a)
a<-table.row.start(a)
a<-table.element(a,'Variable',header=TRUE)
a<-table.element(a,'Parameter',header=TRUE)
a<-table.element(a,'S.D.',header=TRUE)
a<-table.element(a,'T-STAT
H0: parameter = 0',header=TRUE)
a<-table.element(a,'2-tail p-value',header=TRUE)
a<-table.element(a,'1-tail p-value',header=TRUE)
a<-table.row.end(a)
for (i in 1:k){
a<-table.row.start(a)
a<-table.element(a,rownames(mysum$coefficients)[i],header=TRUE)
a<-table.element(a,mysum$coefficients[i,1])
a<-table.element(a, round(mysum$coefficients[i,2],6))
a<-table.element(a, round(mysum$coefficients[i,3],4))
a<-table.element(a, round(mysum$coefficients[i,4],6))
a<-table.element(a, round(mysum$coefficients[i,4]/2,6))
a<-table.row.end(a)
}
a<-table.end(a)
table.save(a,file='mytable2.tab')
a<-table.start()
a<-table.row.start(a)
a<-table.element(a, 'Multiple Linear Regression - Regression Statistics', 2, TRUE)
a<-table.row.end(a)
a<-table.row.start(a)
a<-table.element(a, 'Multiple R',1,TRUE)
a<-table.element(a, sqrt(mysum$r.squared))
a<-table.row.end(a)
a<-table.row.start(a)
a<-table.element(a, 'R-squared',1,TRUE)
a<-table.element(a, mysum$r.squared)
a<-table.row.end(a)
a<-table.row.start(a)
a<-table.element(a, 'Adjusted R-squared',1,TRUE)
a<-table.element(a, mysum$adj.r.squared)
a<-table.row.end(a)
a<-table.row.start(a)
a<-table.element(a, 'F-TEST (value)',1,TRUE)
a<-table.element(a, mysum$fstatistic[1])
a<-table.row.end(a)
a<-table.row.start(a)
a<-table.element(a, 'F-TEST (DF numerator)',1,TRUE)
a<-table.element(a, mysum$fstatistic[2])
a<-table.row.end(a)
a<-table.row.start(a)
a<-table.element(a, 'F-TEST (DF denominator)',1,TRUE)
a<-table.element(a, mysum$fstatistic[3])
a<-table.row.end(a)
a<-table.row.start(a)
a<-table.element(a, 'p-value',1,TRUE)
a<-table.element(a, 1-pf(mysum$fstatistic[1],mysum$fstatistic[2],mysum$fstatistic[3]))
a<-table.row.end(a)
a<-table.row.start(a)
a<-table.element(a, 'Multiple Linear Regression - Residual Statistics', 2, TRUE)
a<-table.row.end(a)
a<-table.row.start(a)
a<-table.element(a, 'Residual Standard Deviation',1,TRUE)
a<-table.element(a, mysum$sigma)
a<-table.row.end(a)
a<-table.row.start(a)
a<-table.element(a, 'Sum Squared Residuals',1,TRUE)
a<-table.element(a, sum(myerror*myerror))
a<-table.row.end(a)
a<-table.end(a)
table.save(a,file='mytable3.tab')
a<-table.start()
a<-table.row.start(a)
a<-table.element(a, 'Multiple Linear Regression - Actuals, Interpolation, and Residuals', 4, TRUE)
a<-table.row.end(a)
a<-table.row.start(a)
a<-table.element(a, 'Time or Index', 1, TRUE)
a<-table.element(a, 'Actuals', 1, TRUE)
a<-table.element(a, 'Interpolation
Forecast', 1, TRUE)
a<-table.element(a, 'Residuals
Prediction Error', 1, TRUE)
a<-table.row.end(a)
for (i in 1:n) {
a<-table.row.start(a)
a<-table.element(a,i, 1, TRUE)
a<-table.element(a,x[i])
a<-table.element(a,x[i]-mysum$resid[i])
a<-table.element(a,mysum$resid[i])
a<-table.row.end(a)
}
a<-table.end(a)
table.save(a,file='mytable4.tab')
if (n > n25) {
a<-table.start()
a<-table.row.start(a)
a<-table.element(a,'Goldfeld-Quandt test for Heteroskedasticity',4,TRUE)
a<-table.row.end(a)
a<-table.row.start(a)
a<-table.element(a,'p-values',header=TRUE)
a<-table.element(a,'Alternative Hypothesis',3,header=TRUE)
a<-table.row.end(a)
a<-table.row.start(a)
a<-table.element(a,'breakpoint index',header=TRUE)
a<-table.element(a,'greater',header=TRUE)
a<-table.element(a,'2-sided',header=TRUE)
a<-table.element(a,'less',header=TRUE)
a<-table.row.end(a)
for (mypoint in kp3:nmkm3) {
a<-table.row.start(a)
a<-table.element(a,mypoint,header=TRUE)
a<-table.element(a,gqarr[mypoint-kp3+1,1])
a<-table.element(a,gqarr[mypoint-kp3+1,2])
a<-table.element(a,gqarr[mypoint-kp3+1,3])
a<-table.row.end(a)
}
a<-table.end(a)
table.save(a,file='mytable5.tab')
a<-table.start()
a<-table.row.start(a)
a<-table.element(a,'Meta Analysis of Goldfeld-Quandt test for Heteroskedasticity',4,TRUE)
a<-table.row.end(a)
a<-table.row.start(a)
a<-table.element(a,'Description',header=TRUE)
a<-table.element(a,'# significant tests',header=TRUE)
a<-table.element(a,'% significant tests',header=TRUE)
a<-table.element(a,'OK/NOK',header=TRUE)
a<-table.row.end(a)
a<-table.row.start(a)
a<-table.element(a,'1% type I error level',header=TRUE)
a<-table.element(a,numsignificant1)
a<-table.element(a,numsignificant1/numgqtests)
if (numsignificant1/numgqtests < 0.01) dum <- 'OK' else dum <- 'NOK'
a<-table.element(a,dum)
a<-table.row.end(a)
a<-table.row.start(a)
a<-table.element(a,'5% type I error level',header=TRUE)
a<-table.element(a,numsignificant5)
a<-table.element(a,numsignificant5/numgqtests)
if (numsignificant5/numgqtests < 0.05) dum <- 'OK' else dum <- 'NOK'
a<-table.element(a,dum)
a<-table.row.end(a)
a<-table.row.start(a)
a<-table.element(a,'10% type I error level',header=TRUE)
a<-table.element(a,numsignificant10)
a<-table.element(a,numsignificant10/numgqtests)
if (numsignificant10/numgqtests < 0.1) dum <- 'OK' else dum <- 'NOK'
a<-table.element(a,dum)
a<-table.row.end(a)
a<-table.end(a)
table.save(a,file='mytable6.tab')
}