of Irreproducible Research!
Description of Statistical Computation | |||||||||||||||||||||||||||||||||||||||||||||||||||||||||||||||||||||||||||||||||||||||||||||||||||||||||||||||||||||||||||||||||||||||||
---|---|---|---|---|---|---|---|---|---|---|---|---|---|---|---|---|---|---|---|---|---|---|---|---|---|---|---|---|---|---|---|---|---|---|---|---|---|---|---|---|---|---|---|---|---|---|---|---|---|---|---|---|---|---|---|---|---|---|---|---|---|---|---|---|---|---|---|---|---|---|---|---|---|---|---|---|---|---|---|---|---|---|---|---|---|---|---|---|---|---|---|---|---|---|---|---|---|---|---|---|---|---|---|---|---|---|---|---|---|---|---|---|---|---|---|---|---|---|---|---|---|---|---|---|---|---|---|---|---|---|---|---|---|---|---|---|---|
Author's title | |||||||||||||||||||||||||||||||||||||||||||||||||||||||||||||||||||||||||||||||||||||||||||||||||||||||||||||||||||||||||||||||||||||||||
Author | *The author of this computation has been verified* | ||||||||||||||||||||||||||||||||||||||||||||||||||||||||||||||||||||||||||||||||||||||||||||||||||||||||||||||||||||||||||||||||||||||||
R Software Module | rwasp_smp.wasp | ||||||||||||||||||||||||||||||||||||||||||||||||||||||||||||||||||||||||||||||||||||||||||||||||||||||||||||||||||||||||||||||||||||||||
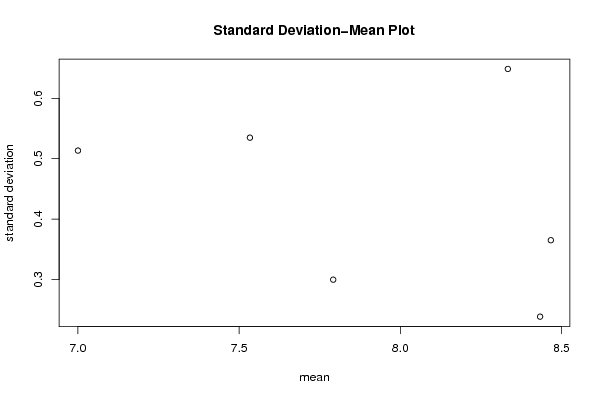
Title produced by software | Standard Deviation-Mean Plot | ||||||||||||||||||||||||||||||||||||||||||||||||||||||||||||||||||||||||||||||||||||||||||||||||||||||||||||||||||||||||||||||||||||||||
Date of computation | Thu, 17 Dec 2009 16:29:15 -0700 | ||||||||||||||||||||||||||||||||||||||||||||||||||||||||||||||||||||||||||||||||||||||||||||||||||||||||||||||||||||||||||||||||||||||||
Cite this page as follows | Statistical Computations at FreeStatistics.org, Office for Research Development and Education, URL https://freestatistics.org/blog/index.php?v=date/2009/Dec/18/t1261092596uokqnfjo5sbeqoi.htm/, Retrieved Tue, 17 Jun 2025 06:22:57 +0000 | ||||||||||||||||||||||||||||||||||||||||||||||||||||||||||||||||||||||||||||||||||||||||||||||||||||||||||||||||||||||||||||||||||||||||
Statistical Computations at FreeStatistics.org, Office for Research Development and Education, URL https://freestatistics.org/blog/index.php?pk=69148, Retrieved Tue, 17 Jun 2025 06:22:57 +0000 | |||||||||||||||||||||||||||||||||||||||||||||||||||||||||||||||||||||||||||||||||||||||||||||||||||||||||||||||||||||||||||||||||||||||||
QR Codes: | |||||||||||||||||||||||||||||||||||||||||||||||||||||||||||||||||||||||||||||||||||||||||||||||||||||||||||||||||||||||||||||||||||||||||
|
|||||||||||||||||||||||||||||||||||||||||||||||||||||||||||||||||||||||||||||||||||||||||||||||||||||||||||||||||||||||||||||||||||||||||
Original text written by user: | |||||||||||||||||||||||||||||||||||||||||||||||||||||||||||||||||||||||||||||||||||||||||||||||||||||||||||||||||||||||||||||||||||||||||
IsPrivate? | No (this computation is public) | ||||||||||||||||||||||||||||||||||||||||||||||||||||||||||||||||||||||||||||||||||||||||||||||||||||||||||||||||||||||||||||||||||||||||
User-defined keywords | |||||||||||||||||||||||||||||||||||||||||||||||||||||||||||||||||||||||||||||||||||||||||||||||||||||||||||||||||||||||||||||||||||||||||
Estimated Impact | 266 | ||||||||||||||||||||||||||||||||||||||||||||||||||||||||||||||||||||||||||||||||||||||||||||||||||||||||||||||||||||||||||||||||||||||||
Tree of Dependent Computations | |||||||||||||||||||||||||||||||||||||||||||||||||||||||||||||||||||||||||||||||||||||||||||||||||||||||||||||||||||||||||||||||||||||||||
Family? (F = Feedback message, R = changed R code, M = changed R Module, P = changed Parameters, D = changed Data) | |||||||||||||||||||||||||||||||||||||||||||||||||||||||||||||||||||||||||||||||||||||||||||||||||||||||||||||||||||||||||||||||||||||||||
- [Univariate Explorative Data Analysis] [Run Sequence gebo...] [2008-12-12 13:32:37] [76963dc1903f0f612b6153510a3818cf] - R D [Univariate Explorative Data Analysis] [Run Sequence gebo...] [2008-12-17 12:14:40] [76963dc1903f0f612b6153510a3818cf] - [Univariate Explorative Data Analysis] [Run Sequence Plot...] [2008-12-22 18:19:51] [1ce0d16c8f4225c977b42c8fa93bc163] - RMP [Standard Deviation-Mean Plot] [Identifying Integ...] [2009-11-22 12:50:05] [b98453cac15ba1066b407e146608df68] - PD [Standard Deviation-Mean Plot] [Identifying integ...] [2009-11-23 19:29:32] [d46757a0a8c9b00540ab7e7e0c34bfc4] - P [Standard Deviation-Mean Plot] [] [2009-12-17 23:29:15] [f90b018c65398c2fee7b197f24b65ddd] [Current] | |||||||||||||||||||||||||||||||||||||||||||||||||||||||||||||||||||||||||||||||||||||||||||||||||||||||||||||||||||||||||||||||||||||||||
Feedback Forum | |||||||||||||||||||||||||||||||||||||||||||||||||||||||||||||||||||||||||||||||||||||||||||||||||||||||||||||||||||||||||||||||||||||||||
Post a new message | |||||||||||||||||||||||||||||||||||||||||||||||||||||||||||||||||||||||||||||||||||||||||||||||||||||||||||||||||||||||||||||||||||||||||
Dataset | |||||||||||||||||||||||||||||||||||||||||||||||||||||||||||||||||||||||||||||||||||||||||||||||||||||||||||||||||||||||||||||||||||||||||
Dataseries X: | |||||||||||||||||||||||||||||||||||||||||||||||||||||||||||||||||||||||||||||||||||||||||||||||||||||||||||||||||||||||||||||||||||||||||
8.4 8.4 8.4 8.6 8.9 8.8 8.3 7.5 7.2 7.4 8.8 9.3 9.3 8.7 8.2 8.3 8.5 8.6 8.5 8.2 8.1 7.9 8.6 8.7 8.7 8.5 8.4 8.5 8.7 8.7 8.6 8.5 8.3 8 8.2 8.1 8.1 8 7.9 7.9 8 8 7.9 8 7.7 7.2 7.5 7.3 7 7 7 7.2 7.3 7.1 6.8 6.4 6.1 6.5 7.7 7.9 7.5 6.9 6.6 6.9 7.7 8 8 7.7 7.3 7.4 8.1 8.3 8.2 | |||||||||||||||||||||||||||||||||||||||||||||||||||||||||||||||||||||||||||||||||||||||||||||||||||||||||||||||||||||||||||||||||||||||||
Tables (Output of Computation) | |||||||||||||||||||||||||||||||||||||||||||||||||||||||||||||||||||||||||||||||||||||||||||||||||||||||||||||||||||||||||||||||||||||||||
\begin{tabular}{lllllllll} \hline Summary of computational transaction \tabularnewline Raw Input & view raw input (R code) \tabularnewline Raw Output & view raw output of R engine \tabularnewline Computing time & 1 seconds \tabularnewline R Server & 'Gwilym Jenkins' @ 72.249.127.135 \tabularnewline \hline \end{tabular} %Source: https://freestatistics.org/blog/index.php?pk=69148&T=0 [TABLE] [ROW][C]Summary of computational transaction[/C][/ROW] [ROW][C]Raw Input[/C][C]view raw input (R code) [/C][/ROW] [ROW][C]Raw Output[/C][C]view raw output of R engine [/C][/ROW] [ROW][C]Computing time[/C][C]1 seconds[/C][/ROW] [ROW][C]R Server[/C][C]'Gwilym Jenkins' @ 72.249.127.135[/C][/ROW] [/TABLE] Source: https://freestatistics.org/blog/index.php?pk=69148&T=0
Globally Unique Identifier (entire table): ba.freestatistics.org/blog/index.php?pk=69148&T=0
As an alternative you can also use a QR Code: The GUIDs for individual cells are displayed in the table below:
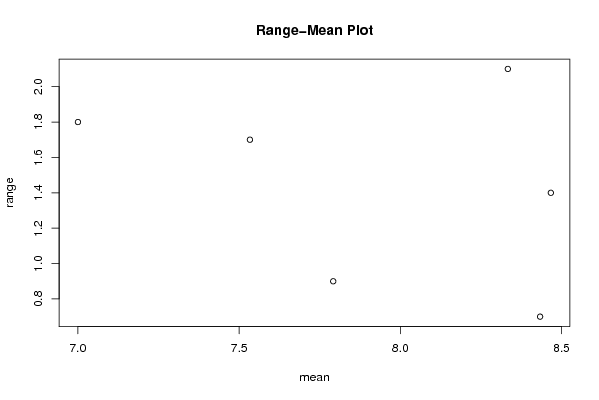
\begin{tabular}{lllllllll} \hline Standard Deviation-Mean Plot \tabularnewline Section & Mean & Standard Deviation & Range \tabularnewline 1 & 8.33333333333333 & 0.648541487189571 & 2.1 \tabularnewline 2 & 8.46666666666667 & 0.365148371670111 & 1.4 \tabularnewline 3 & 8.43333333333333 & 0.238683256575942 & 0.700 \tabularnewline 4 & 7.79166666666667 & 0.299873710792131 & 0.9 \tabularnewline 5 & 7 & 0.513455318052471 & 1.8 \tabularnewline 6 & 7.53333333333333 & 0.534846338737217 & 1.7 \tabularnewline \hline \end{tabular} %Source: https://freestatistics.org/blog/index.php?pk=69148&T=1 [TABLE] [ROW][C]Standard Deviation-Mean Plot[/C][/ROW] [ROW][C]Section[/C][C]Mean[/C][C]Standard Deviation[/C][C]Range[/C][/ROW] [ROW][C]1[/C][C]8.33333333333333[/C][C]0.648541487189571[/C][C]2.1[/C][/ROW] [ROW][C]2[/C][C]8.46666666666667[/C][C]0.365148371670111[/C][C]1.4[/C][/ROW] [ROW][C]3[/C][C]8.43333333333333[/C][C]0.238683256575942[/C][C]0.700[/C][/ROW] [ROW][C]4[/C][C]7.79166666666667[/C][C]0.299873710792131[/C][C]0.9[/C][/ROW] [ROW][C]5[/C][C]7[/C][C]0.513455318052471[/C][C]1.8[/C][/ROW] [ROW][C]6[/C][C]7.53333333333333[/C][C]0.534846338737217[/C][C]1.7[/C][/ROW] [/TABLE] Source: https://freestatistics.org/blog/index.php?pk=69148&T=1
Globally Unique Identifier (entire table): ba.freestatistics.org/blog/index.php?pk=69148&T=1
As an alternative you can also use a QR Code: The GUIDs for individual cells are displayed in the table below:
\begin{tabular}{lllllllll} \hline Regression: S.E.(k) = alpha + beta * Mean(k) \tabularnewline alpha & 1.08776978746855 \tabularnewline beta & -0.0825527298081765 \tabularnewline S.D. & 0.126373492449734 \tabularnewline T-STAT & -0.653244032493701 \tabularnewline p-value & 0.54924439802919 \tabularnewline \hline \end{tabular} %Source: https://freestatistics.org/blog/index.php?pk=69148&T=2 [TABLE] [ROW][C]Regression: S.E.(k) = alpha + beta * Mean(k)[/C][/ROW] [ROW][C]alpha[/C][C]1.08776978746855[/C][/ROW] [ROW][C]beta[/C][C]-0.0825527298081765[/C][/ROW] [ROW][C]S.D.[/C][C]0.126373492449734[/C][/ROW] [ROW][C]T-STAT[/C][C]-0.653244032493701[/C][/ROW] [ROW][C]p-value[/C][C]0.54924439802919[/C][/ROW] [/TABLE] Source: https://freestatistics.org/blog/index.php?pk=69148&T=2
Globally Unique Identifier (entire table): ba.freestatistics.org/blog/index.php?pk=69148&T=2
As an alternative you can also use a QR Code: The GUIDs for individual cells are displayed in the table below:
\begin{tabular}{lllllllll} \hline Regression: ln S.E.(k) = alpha + beta * ln Mean(k) \tabularnewline alpha & 2.98448504919170 \tabularnewline beta & -1.87611572138014 \tabularnewline S.D. & 2.33711386161391 \tabularnewline T-STAT & -0.80274895981515 \tabularnewline p-value & 0.467106215117767 \tabularnewline Lambda & 2.87611572138014 \tabularnewline \hline \end{tabular} %Source: https://freestatistics.org/blog/index.php?pk=69148&T=3 [TABLE] [ROW][C]Regression: ln S.E.(k) = alpha + beta * ln Mean(k)[/C][/ROW] [ROW][C]alpha[/C][C]2.98448504919170[/C][/ROW] [ROW][C]beta[/C][C]-1.87611572138014[/C][/ROW] [ROW][C]S.D.[/C][C]2.33711386161391[/C][/ROW] [ROW][C]T-STAT[/C][C]-0.80274895981515[/C][/ROW] [ROW][C]p-value[/C][C]0.467106215117767[/C][/ROW] [ROW][C]Lambda[/C][C]2.87611572138014[/C][/ROW] [/TABLE] Source: https://freestatistics.org/blog/index.php?pk=69148&T=3
Globally Unique Identifier (entire table): ba.freestatistics.org/blog/index.php?pk=69148&T=3
As an alternative you can also use a QR Code: The GUIDs for individual cells are displayed in the table below:
| |||||||||||||||||||||||||||||||||||||||||||||||||||||||||||||||||||||||||||||||||||||||||||||||||||||||||||||||||||||||||||||||||||||||||
Figures (Output of Computation) | |||||||||||||||||||||||||||||||||||||||||||||||||||||||||||||||||||||||||||||||||||||||||||||||||||||||||||||||||||||||||||||||||||||||||
Input Parameters & R Code | |||||||||||||||||||||||||||||||||||||||||||||||||||||||||||||||||||||||||||||||||||||||||||||||||||||||||||||||||||||||||||||||||||||||||
Parameters (Session): | |||||||||||||||||||||||||||||||||||||||||||||||||||||||||||||||||||||||||||||||||||||||||||||||||||||||||||||||||||||||||||||||||||||||||
par1 = 12 ; | |||||||||||||||||||||||||||||||||||||||||||||||||||||||||||||||||||||||||||||||||||||||||||||||||||||||||||||||||||||||||||||||||||||||||
Parameters (R input): | |||||||||||||||||||||||||||||||||||||||||||||||||||||||||||||||||||||||||||||||||||||||||||||||||||||||||||||||||||||||||||||||||||||||||
par1 = 12 ; | |||||||||||||||||||||||||||||||||||||||||||||||||||||||||||||||||||||||||||||||||||||||||||||||||||||||||||||||||||||||||||||||||||||||||
R code (references can be found in the software module): | |||||||||||||||||||||||||||||||||||||||||||||||||||||||||||||||||||||||||||||||||||||||||||||||||||||||||||||||||||||||||||||||||||||||||
par1 <- as.numeric(par1) |