Free Statistics

of Irreproducible Research!

Author's title

Author*The author of this computation has been verified*
R Software Modulerwasp_hierarchicalclustering.wasp
Title produced by softwareHierarchical Clustering
Date of computationMon, 10 Nov 2008 04:40:44 -0700
Cite this page as followsStatistical Computations at FreeStatistics.org, Office for Research Development and Education, URL https://freestatistics.org/blog/index.php?v=date/2008/Nov/10/t1226317309vtdu64ttzh5nnqx.htm/, Retrieved Sun, 19 May 2024 08:14:03 +0000
Statistical Computations at FreeStatistics.org, Office for Research Development and Education, URL https://freestatistics.org/blog/index.php?pk=22958, Retrieved Sun, 19 May 2024 08:14:03 +0000
QR Codes:

Original text written by user:
IsPrivate?No (this computation is public)
User-defined keywords
Estimated Impact164
Family? (F = Feedback message, R = changed R code, M = changed R Module, P = changed Parameters, D = changed Data)
F       [Hierarchical Clustering] [Various EDA topic...] [2008-11-10 11:40:44] [55ca0ca4a201c9689dcf5fae352c92eb] [Current]
Feedback Forum
2008-11-17 18:39:36 [8e2cc0b2ef568da46d009b2f601285b2] [reply
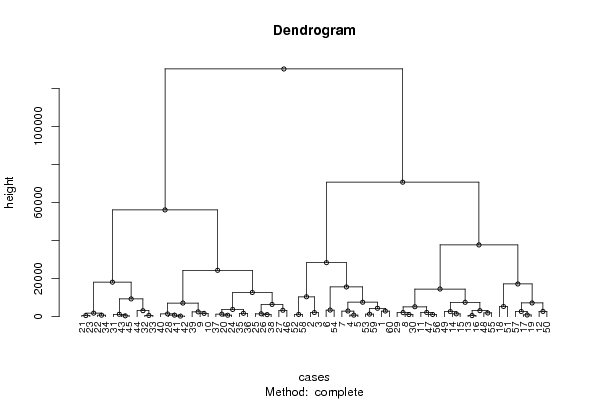
In deze grafiek kan men clusters (hiërarchische) aflezen. Uit de eerste opsplitsing kan je aflezen dat er 2 clusters/categorieën zijn. Deze bestaan uit verdere onderverdelingen enz tot je bij een observatie komt. Elke observatie heeft een volg nr. Op de laagste opsplitssing kan je aflezen welke observaties samen kunnen gezien worden.
Meestal gebruikt men deze techniek niet voor tijdreeksen.
2008-11-22 18:23:10 [Kenny Simons] [reply
Een dendogram wordt wel eens een boomstructuur genoemd, het brengt namelijk alle gelijkaardige eigenschappen samen. Dit is een clustertechniek dat ook wel gebruikt wordt voor niet-tijdreeksen. Een goed voorbeeld hiervan is marktsegmentatie.

Zoals je op de grafiek ziet, zijn de waarden nu opgesplitst in clusters, elke cluster vertoont nu een gelijkaardigheid, dit is de meest aangewezen manier op hierarchical clustering te doen.
2008-11-23 14:22:44 [Chi-Kwong Man] [reply
Hierarchical Clustering: welke observaties kan men plaatsen in één cluster? Dit is puur exploratief methode.

Post a new message
Dataseries X:
1.21	512238	99.29	1946.81
1.74	519164	98.69	1765.9
1.76	517009	107.92	1635.25
1.48	509933	101.03	1833.42
1.04	509127	97.55	1910.43
1.62	500857	103.02	1959.67
1.49	506971	94.08	1969.6
1.79	569323	94.12	2061.41
1.8	579714	115.08	2093.48
1.58	577992	116.48	2120.88
1.86	565464	103.42	2174.56
1.74	547344	112.51	2196.72
1.59	554788	95.55	2350.44
1.26	562325	97.53	2440.25
1.13	560854	119.26	2408.64
1.92	555332	100.94	2472.81
2.61	543599	97.73	2407.6
2.26	536662	115.25	2454.62
2.41	542722	92.8	2448.05
2.26	593530	99.2	2497.84
2.03	610763	118.69	2645.64
2.86	612613	110.12	2756.76
2.55	611324	110.26	2849.27
2.27	594167	112.9	2921.44
2.26	590865	102.17	3080.58
2.57	589379	99.38	3106.22
3.07	584428	116.1	3119.31
2.76	573100	103.77	3061.26
2.51	567456	101.81	3097.31
2.87	569028	113.74	3161.69
3.14	620735	89.67	3257.16
3.11	628884	99.5	3277.01
3.16	628232	122.89	3295.32
2.47	612117	108.61	3363.99
2.57	595404	114.37	3494.17
2.89	597141	110.5	3667.03
2.63	593408	104.08	3813.06
2.38	590072	103.64	3917.96
1.69	579799	121.61	3895.51
1.96	574205	101.14	3733.22
2.19	572775	115.97	3801.06
1.87	572942	120.12	3570.12
1.6	619567	95.97	3701.61
1.63	625809	105.01	3862.27
1.22	619916	124.68	3970.1
1.21	587625	123.89	4138.52
1.49	565742	123.61	4199.75
1.64	557274	114.76	4290.89
1.66	560576	108.75	4443.91
1.77	548854	106.09	4502.64
1.82	531673	123.17	4356.98
1.78	525919	106.16	4591.27
1.28	511038	115.18	4696.96
1.29	498662	120.6	4621.4
1.37	555362	109.48	4562.84
1.12	564591	114.44	4202.52
1.51	541657	121.44	4296.49
2.24	527070	129.48	4435.23
2.94	509846	124.32	4105.18
3.09	514258	112.59	4116.68


Summary of computational transaction
Raw Inputview raw input (R code)
Raw Outputview raw output of R engine
Computing time1 seconds
R Server'George Udny Yule' @ 72.249.76.132

\begin{tabular}{lllllllll}
\hline
Summary of computational transaction \tabularnewline
Raw Input & view raw input (R code)  \tabularnewline
Raw Output & view raw output of R engine  \tabularnewline
Computing time & 1 seconds \tabularnewline
R Server & 'George Udny Yule' @ 72.249.76.132 \tabularnewline
\hline
\end{tabular}
%Source: https://freestatistics.org/blog/index.php?pk=22958&T=0

[TABLE]
[ROW][C]Summary of computational transaction[/C][/ROW]
[ROW][C]Raw Input[/C][C]view raw input (R code) [/C][/ROW]
[ROW][C]Raw Output[/C][C]view raw output of R engine [/C][/ROW]
[ROW][C]Computing time[/C][C]1 seconds[/C][/ROW]
[ROW][C]R Server[/C][C]'George Udny Yule' @ 72.249.76.132[/C][/ROW]
[/TABLE]
Source: https://freestatistics.org/blog/index.php?pk=22958&T=0

Globally Unique Identifier (entire table): ba.freestatistics.org/blog/index.php?pk=22958&T=0

As an alternative you can also use a QR Code:  

The GUIDs for individual cells are displayed in the table below:

Summary of computational transaction
Raw Inputview raw input (R code)
Raw Outputview raw output of R engine
Computing time1 seconds
R Server'George Udny Yule' @ 72.249.76.132


Summary of Dendrogram
LabelHeight
1285.025627795116
2441.262154053574
3557.619563770856
4596.873112311151
5652.676298558481
6765.11022088324
7784.057845506312
8808.132541666279
9809.678234918044
10877.946209855706
111067.32797738090
121139.30996186288
131151.03992055011
141161.76310648944
151249.72071443983
161320.87531572817
171330.84704741003
181431.68510762667
191471.500051614
201486.22383569905
211722.21855999754
221745.58433164943
231853.35419933697
241931.25056732678
252135.14342949133
262158.97652043740
272207.91139985281
282532.70348953445
292659.65795620414
302709.21258047426
312756.33964955337
322964.61063907219
332965.13697744303
343130.20555524713
353153.71387876262
363355.54200805175
373450.09286225748
383795.58353129002
394412.03058300824
405193.89924655841
415339.39673461338
426437.13163714243
437146.01647077587
447199.96822997157
457537.53533095534
467596.75369526352
479326.67083696
4810443.3746492405
4912724.7945991595
5014537.8734836220
5115604.1669331785
5217181.6259290121
5318132.0059149395
5424366.3692505018
5528408.6114237532
5637719.9282280375
5756111.4496471959
5870707.3629209894
59130228.941165144

\begin{tabular}{lllllllll}
\hline
Summary of Dendrogram \tabularnewline
Label & Height \tabularnewline
1 & 285.025627795116 \tabularnewline
2 & 441.262154053574 \tabularnewline
3 & 557.619563770856 \tabularnewline
4 & 596.873112311151 \tabularnewline
5 & 652.676298558481 \tabularnewline
6 & 765.11022088324 \tabularnewline
7 & 784.057845506312 \tabularnewline
8 & 808.132541666279 \tabularnewline
9 & 809.678234918044 \tabularnewline
10 & 877.946209855706 \tabularnewline
11 & 1067.32797738090 \tabularnewline
12 & 1139.30996186288 \tabularnewline
13 & 1151.03992055011 \tabularnewline
14 & 1161.76310648944 \tabularnewline
15 & 1249.72071443983 \tabularnewline
16 & 1320.87531572817 \tabularnewline
17 & 1330.84704741003 \tabularnewline
18 & 1431.68510762667 \tabularnewline
19 & 1471.500051614 \tabularnewline
20 & 1486.22383569905 \tabularnewline
21 & 1722.21855999754 \tabularnewline
22 & 1745.58433164943 \tabularnewline
23 & 1853.35419933697 \tabularnewline
24 & 1931.25056732678 \tabularnewline
25 & 2135.14342949133 \tabularnewline
26 & 2158.97652043740 \tabularnewline
27 & 2207.91139985281 \tabularnewline
28 & 2532.70348953445 \tabularnewline
29 & 2659.65795620414 \tabularnewline
30 & 2709.21258047426 \tabularnewline
31 & 2756.33964955337 \tabularnewline
32 & 2964.61063907219 \tabularnewline
33 & 2965.13697744303 \tabularnewline
34 & 3130.20555524713 \tabularnewline
35 & 3153.71387876262 \tabularnewline
36 & 3355.54200805175 \tabularnewline
37 & 3450.09286225748 \tabularnewline
38 & 3795.58353129002 \tabularnewline
39 & 4412.03058300824 \tabularnewline
40 & 5193.89924655841 \tabularnewline
41 & 5339.39673461338 \tabularnewline
42 & 6437.13163714243 \tabularnewline
43 & 7146.01647077587 \tabularnewline
44 & 7199.96822997157 \tabularnewline
45 & 7537.53533095534 \tabularnewline
46 & 7596.75369526352 \tabularnewline
47 & 9326.67083696 \tabularnewline
48 & 10443.3746492405 \tabularnewline
49 & 12724.7945991595 \tabularnewline
50 & 14537.8734836220 \tabularnewline
51 & 15604.1669331785 \tabularnewline
52 & 17181.6259290121 \tabularnewline
53 & 18132.0059149395 \tabularnewline
54 & 24366.3692505018 \tabularnewline
55 & 28408.6114237532 \tabularnewline
56 & 37719.9282280375 \tabularnewline
57 & 56111.4496471959 \tabularnewline
58 & 70707.3629209894 \tabularnewline
59 & 130228.941165144 \tabularnewline
\hline
\end{tabular}
%Source: https://freestatistics.org/blog/index.php?pk=22958&T=1

[TABLE]
[ROW][C]Summary of Dendrogram[/C][/ROW]
[ROW][C]Label[/C][C]Height[/C][/ROW]
[ROW][C]1[/C][C]285.025627795116[/C][/ROW]
[ROW][C]2[/C][C]441.262154053574[/C][/ROW]
[ROW][C]3[/C][C]557.619563770856[/C][/ROW]
[ROW][C]4[/C][C]596.873112311151[/C][/ROW]
[ROW][C]5[/C][C]652.676298558481[/C][/ROW]
[ROW][C]6[/C][C]765.11022088324[/C][/ROW]
[ROW][C]7[/C][C]784.057845506312[/C][/ROW]
[ROW][C]8[/C][C]808.132541666279[/C][/ROW]
[ROW][C]9[/C][C]809.678234918044[/C][/ROW]
[ROW][C]10[/C][C]877.946209855706[/C][/ROW]
[ROW][C]11[/C][C]1067.32797738090[/C][/ROW]
[ROW][C]12[/C][C]1139.30996186288[/C][/ROW]
[ROW][C]13[/C][C]1151.03992055011[/C][/ROW]
[ROW][C]14[/C][C]1161.76310648944[/C][/ROW]
[ROW][C]15[/C][C]1249.72071443983[/C][/ROW]
[ROW][C]16[/C][C]1320.87531572817[/C][/ROW]
[ROW][C]17[/C][C]1330.84704741003[/C][/ROW]
[ROW][C]18[/C][C]1431.68510762667[/C][/ROW]
[ROW][C]19[/C][C]1471.500051614[/C][/ROW]
[ROW][C]20[/C][C]1486.22383569905[/C][/ROW]
[ROW][C]21[/C][C]1722.21855999754[/C][/ROW]
[ROW][C]22[/C][C]1745.58433164943[/C][/ROW]
[ROW][C]23[/C][C]1853.35419933697[/C][/ROW]
[ROW][C]24[/C][C]1931.25056732678[/C][/ROW]
[ROW][C]25[/C][C]2135.14342949133[/C][/ROW]
[ROW][C]26[/C][C]2158.97652043740[/C][/ROW]
[ROW][C]27[/C][C]2207.91139985281[/C][/ROW]
[ROW][C]28[/C][C]2532.70348953445[/C][/ROW]
[ROW][C]29[/C][C]2659.65795620414[/C][/ROW]
[ROW][C]30[/C][C]2709.21258047426[/C][/ROW]
[ROW][C]31[/C][C]2756.33964955337[/C][/ROW]
[ROW][C]32[/C][C]2964.61063907219[/C][/ROW]
[ROW][C]33[/C][C]2965.13697744303[/C][/ROW]
[ROW][C]34[/C][C]3130.20555524713[/C][/ROW]
[ROW][C]35[/C][C]3153.71387876262[/C][/ROW]
[ROW][C]36[/C][C]3355.54200805175[/C][/ROW]
[ROW][C]37[/C][C]3450.09286225748[/C][/ROW]
[ROW][C]38[/C][C]3795.58353129002[/C][/ROW]
[ROW][C]39[/C][C]4412.03058300824[/C][/ROW]
[ROW][C]40[/C][C]5193.89924655841[/C][/ROW]
[ROW][C]41[/C][C]5339.39673461338[/C][/ROW]
[ROW][C]42[/C][C]6437.13163714243[/C][/ROW]
[ROW][C]43[/C][C]7146.01647077587[/C][/ROW]
[ROW][C]44[/C][C]7199.96822997157[/C][/ROW]
[ROW][C]45[/C][C]7537.53533095534[/C][/ROW]
[ROW][C]46[/C][C]7596.75369526352[/C][/ROW]
[ROW][C]47[/C][C]9326.67083696[/C][/ROW]
[ROW][C]48[/C][C]10443.3746492405[/C][/ROW]
[ROW][C]49[/C][C]12724.7945991595[/C][/ROW]
[ROW][C]50[/C][C]14537.8734836220[/C][/ROW]
[ROW][C]51[/C][C]15604.1669331785[/C][/ROW]
[ROW][C]52[/C][C]17181.6259290121[/C][/ROW]
[ROW][C]53[/C][C]18132.0059149395[/C][/ROW]
[ROW][C]54[/C][C]24366.3692505018[/C][/ROW]
[ROW][C]55[/C][C]28408.6114237532[/C][/ROW]
[ROW][C]56[/C][C]37719.9282280375[/C][/ROW]
[ROW][C]57[/C][C]56111.4496471959[/C][/ROW]
[ROW][C]58[/C][C]70707.3629209894[/C][/ROW]
[ROW][C]59[/C][C]130228.941165144[/C][/ROW]
[/TABLE]
Source: https://freestatistics.org/blog/index.php?pk=22958&T=1

Globally Unique Identifier (entire table): ba.freestatistics.org/blog/index.php?pk=22958&T=1

As an alternative you can also use a QR Code:  

The GUIDs for individual cells are displayed in the table below:

Summary of Dendrogram
LabelHeight
1285.025627795116
2441.262154053574
3557.619563770856
4596.873112311151
5652.676298558481
6765.11022088324
7784.057845506312
8808.132541666279
9809.678234918044
10877.946209855706
111067.32797738090
121139.30996186288
131151.03992055011
141161.76310648944
151249.72071443983
161320.87531572817
171330.84704741003
181431.68510762667
191471.500051614
201486.22383569905
211722.21855999754
221745.58433164943
231853.35419933697
241931.25056732678
252135.14342949133
262158.97652043740
272207.91139985281
282532.70348953445
292659.65795620414
302709.21258047426
312756.33964955337
322964.61063907219
332965.13697744303
343130.20555524713
353153.71387876262
363355.54200805175
373450.09286225748
383795.58353129002
394412.03058300824
405193.89924655841
415339.39673461338
426437.13163714243
437146.01647077587
447199.96822997157
457537.53533095534
467596.75369526352
479326.67083696
4810443.3746492405
4912724.7945991595
5014537.8734836220
5115604.1669331785
5217181.6259290121
5318132.0059149395
5424366.3692505018
5528408.6114237532
5637719.9282280375
5756111.4496471959
5870707.3629209894
59130228.941165144


Parameters (Session):
par1 = complete ; par2 = ALL ; par3 = FALSE ; par4 = FALSE ;
Parameters (R input):
par1 = complete ; par2 = ALL ; par3 = FALSE ; par4 = FALSE ;
R code (references can be found in the software module):
par3 <- as.logical(par3)
par4 <- as.logical(par4)
if (par3 == 'TRUE'){
dum = xlab
xlab = ylab
ylab = dum
}
x <- t(y)
hc <- hclust(dist(x),method=par1)
d <- as.dendrogram(hc)
str(d)
mysub <- paste('Method: ',par1)
bitmap(file='test1.png')
if (par4 == 'TRUE'){
plot(d,main=main,ylab=ylab,xlab=xlab,horiz=par3, nodePar=list(pch = c(1,NA), cex=0.8, lab.cex = 0.8),type='t',center=T, sub=mysub)
} else {
plot(d,main=main,ylab=ylab,xlab=xlab,horiz=par3, nodePar=list(pch = c(1,NA), cex=0.8, lab.cex = 0.8), sub=mysub)
}
dev.off()
if (par2 != 'ALL'){
if (par3 == 'TRUE'){
ylab = 'cluster'
} else {
xlab = 'cluster'
}
par2 <- as.numeric(par2)
memb <- cutree(hc, k = par2)
cent <- NULL
for(k in 1:par2){
cent <- rbind(cent, colMeans(x[memb == k, , drop = FALSE]))
}
hc1 <- hclust(dist(cent),method=par1, members = table(memb))
de <- as.dendrogram(hc1)
bitmap(file='test2.png')
if (par4 == 'TRUE'){
plot(de,main=main,ylab=ylab,xlab=xlab,horiz=par3, nodePar=list(pch = c(1,NA), cex=0.8, lab.cex = 0.8),type='t',center=T, sub=mysub)
} else {
plot(de,main=main,ylab=ylab,xlab=xlab,horiz=par3, nodePar=list(pch = c(1,NA), cex=0.8, lab.cex = 0.8), sub=mysub)
}
dev.off()
str(de)
}
load(file='createtable')
a<-table.start()
a<-table.row.start(a)
a<-table.element(a,'Summary of Dendrogram',2,TRUE)
a<-table.row.end(a)
a<-table.row.start(a)
a<-table.element(a,'Label',header=TRUE)
a<-table.element(a,'Height',header=TRUE)
a<-table.row.end(a)
num <- length(x[,1])-1
for (i in 1:num)
{
a<-table.row.start(a)
a<-table.element(a,hc$labels[i])
a<-table.element(a,hc$height[i])
a<-table.row.end(a)
}
a<-table.end(a)
table.save(a,file='mytable1.tab')
if (par2 != 'ALL'){
a<-table.start()
a<-table.row.start(a)
a<-table.element(a,'Summary of Cut Dendrogram',2,TRUE)
a<-table.row.end(a)
a<-table.row.start(a)
a<-table.element(a,'Label',header=TRUE)
a<-table.element(a,'Height',header=TRUE)
a<-table.row.end(a)
num <- par2-1
for (i in 1:num)
{
a<-table.row.start(a)
a<-table.element(a,i)
a<-table.element(a,hc1$height[i])
a<-table.row.end(a)
}
a<-table.end(a)
table.save(a,file='mytable2.tab')
}