Free Statistics

of Irreproducible Research!

Author's title

Author*The author of this computation has been verified*
R Software Modulerwasp_hierarchicalclustering.wasp
Title produced by softwareHierarchical Clustering
Date of computationMon, 10 Nov 2008 10:36:33 -0700
Cite this page as followsStatistical Computations at FreeStatistics.org, Office for Research Development and Education, URL https://freestatistics.org/blog/index.php?v=date/2008/Nov/10/t1226338684tg6ca8cagl6455y.htm/, Retrieved Sun, 19 May 2024 04:28:34 +0000
Statistical Computations at FreeStatistics.org, Office for Research Development and Education, URL https://freestatistics.org/blog/index.php?pk=23150, Retrieved Sun, 19 May 2024 04:28:34 +0000
QR Codes:

Original text written by user:
IsPrivate?No (this computation is public)
User-defined keywords
Estimated Impact168
Family? (F = Feedback message, R = changed R code, M = changed R Module, P = changed Parameters, D = changed Data)
F     [Bivariate Kernel Density Estimation] [Bivariate Kernel ...] [2008-11-10 16:53:50] [819b576fab25b35cfda70f80599828ec]
F    D  [Bivariate Kernel Density Estimation] [Bivaritae Kernel ...] [2008-11-10 16:58:43] [819b576fab25b35cfda70f80599828ec]
F RMPD    [Partial Correlation] [Partial Correlati...] [2008-11-10 17:08:28] [819b576fab25b35cfda70f80599828ec]
- RMPD      [Trivariate Scatterplots] [Trivariate Scatte...] [2008-11-10 17:21:24] [819b576fab25b35cfda70f80599828ec]
F RMPD          [Hierarchical Clustering] [Hierarchical Clus...] [2008-11-10 17:36:33] [e08fee3874f3333d6b7a377a061b860d] [Current]
F RM D            [Box-Cox Linearity Plot] [Box-Cox linearity...] [2008-11-11 14:51:35] [6fea0e9a9b3b29a63badf2c274e82506]
Feedback Forum
2008-11-14 11:00:10 [Ciska Tanghe] [reply
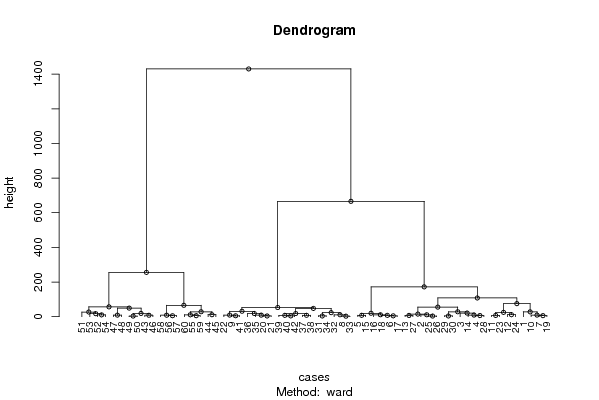
Hier gaan we kijken welke observaties als gemeenschappelijk kunnen gezien worden. De observaties worden opgesplitst in twee taken en verder onderverdeeld tot je bij 1 obervatie komt. Hier zijn we dat er inderdaad enkele observaties zijn die als gemeenschappelijk kunnen gezien worden. Toch zien we dat er heel wat opsplitsingen zijn, waardoor veel observaties ook als niet gemeenschappelijk kunnen gezien worden.
2008-11-14 18:22:26 [Kevin Neelen] [reply
Hier wordt er gebruik gemaakt van Hierarchical Clustering. Aan elk van de punten wordt een volgnummer gegeven en nadien wordt er gekeken welke observaties als gemeenschappelijk kunnen worden gezien.
We kunnen hier zien dat de gegevens worden opgedeeld in twee verschillende groepen of clusters die stees verder opgesplitst worden,totdat slechts 1 gegeven overblijft. We kunnen hier steleen dat er vrij veel 'takken' zijn waardoor de gegevens niet echt 'geclusterd' kunnen worden.
Deze methode wordt echter meestal gebruikt voor niet-tijdreeksen.
2008-11-21 17:09:19 [Michael Van Spaandonck] [reply
Hierarchical clustering geeft de clustering van de verschillende maandresultaten weer.
Deze techniek geeft iedere observatie een volgnummer en laat toe na te gaan welke van de verschillende observaties als gemeenschappelijk beschouwd kunnen worden.
Deze methode wordt veelal toegepast op niet-tijdreeksen.

We kunnen hier zien dat de gegevens worden opgedeeld in twee verschillende categoriën die stees verder opgesplitst worden. We kunnen concluderen dat er in deze tijdreeks niet echt sprake is van een bijzondere mate van clustering, gezien het vrij grote aantal vertakkingen.
2008-11-22 15:22:31 [Jeroen Michel] [reply
Een dendrogram toont ons aan waar de clusters zich bevinden. We merken hier eerst en vooral op dat de observaties uit elkaar vallen in 2 stukken. Je kan elk onderdeel blijven opsplitsen tot je uiteindelijk aan 1 observatie komt.
Meestal wordt deze methode niet gebruikt voor tijdreeksen. Maar om bijvoorbeeld het samenhoren van verschillende producten te onderzoeken.

Post a new message
Dataseries X:
0.771	493.000	58.972	54.281
0.751	481.000	59.249	63.654
0.766	462.000	63.955	68.918
0.754	457.000	53.785	58.686
0.773	442.000	52.760	67.074
0.781	439.000	44.795	60.183
0.793	488.000	37.348	54.326
0.791	521.000	32.370	54.085
0.878	501.000	32.717	53.564
0.873	485.000	40.974	60.873
0.897	464.000	33.591	53.398
0.885	460.000	21.124	45.164
0.796	467.000	58.608	59.672
0.776	460.000	46.865	56.298
0.788	448.000	51.378	62.361
0.786	443.000	46.235	56.930
0.801	436.000	47.206	62.954
0.811	431.000	45.382	62.431
0.801	484.000	41.227	52.528
0.781	510.000	33.795	54.060
0.778	513.000	31.295	53.093
0.759	503.000	42.625	52.695
0.764	471.000	33.625	52.333
0.754	471.000	21.538	41.747
0.749	476.000	56.421	58.576
0.729	475.000	53.152	57.851
0.740	470.000	53.536	63.721
0.781	461.000	52.408	63.384
0.768	455.000	41.454	61.141
0.754	456.000	38.271	59.231
0.754	517.000	35.306	63.472
0.754	525.000	26.414	49.214
0.779	523.000	31.917	55.816
0.799	519.000	38.030	61.713
0.780	509.000	27.534	48.664
0.769	512.000	18.387	45.351
0.801	519.000	50.556	57.888
0.792	517.000	43.901	54.091
0.852	510.000	48.572	59.098
0.807	509.000	43.899	58.962
0.797	501.000	37.532	55.433
0.783	507.000	40.357	60.403
0.779	569.000	35.489	60.721
0.785	580.000	29.027	48.440
0.817	578.000	34.485	57.981
0.810	565.000	42.598	60.258
0.798	547.000	30.306	47.312
0.795	555.000	26.451	46.980
0.785	562.000	47.460	54.846
0.785	561.000	50.104	56.824
0.785	555.000	61.465	67.744
0.805	544.000	53.726	62.849
0.824	537.000	39.477	54.691
0.819	543.000	43.895	65.461
0.827	594.000	31.481	53.724
0.826	611.000	29.896	54.560
0.829	613.000	33.842	57.722
0.830	611.000	39.120	55.458
0.825	594.000	33.702	48.490
0.817	595.000	25.094	46.362


Summary of computational transaction
Raw Inputview raw input (R code)
Raw Outputview raw output of R engine
Computing time3 seconds
R Server'Sir Ronald Aylmer Fisher' @ 193.190.124.24

\begin{tabular}{lllllllll}
\hline
Summary of computational transaction \tabularnewline
Raw Input & view raw input (R code)  \tabularnewline
Raw Output & view raw output of R engine  \tabularnewline
Computing time & 3 seconds \tabularnewline
R Server & 'Sir Ronald Aylmer Fisher' @ 193.190.124.24 \tabularnewline
\hline
\end{tabular}
%Source: https://freestatistics.org/blog/index.php?pk=23150&T=0

[TABLE]
[ROW][C]Summary of computational transaction[/C][/ROW]
[ROW][C]Raw Input[/C][C]view raw input (R code) [/C][/ROW]
[ROW][C]Raw Output[/C][C]view raw output of R engine [/C][/ROW]
[ROW][C]Computing time[/C][C]3 seconds[/C][/ROW]
[ROW][C]R Server[/C][C]'Sir Ronald Aylmer Fisher' @ 193.190.124.24[/C][/ROW]
[/TABLE]
Source: https://freestatistics.org/blog/index.php?pk=23150&T=0

Globally Unique Identifier (entire table): ba.freestatistics.org/blog/index.php?pk=23150&T=0

As an alternative you can also use a QR Code:  

The GUIDs for individual cells are displayed in the table below:

Summary of computational transaction
Raw Inputview raw input (R code)
Raw Outputview raw output of R engine
Computing time3 seconds
R Server'Sir Ronald Aylmer Fisher' @ 193.190.124.24


Summary of Dendrogram
LabelHeight
12.68360093903695
23.45010434624810
33.49462244026447
43.81002388443957
53.84444859505235
64.02307071774782
74.31541666586206
84.74254804930852
95.16565068505411
105.43775404004263
115.68573662773786
125.85487053657039
136.32202989553197
147.0818832241149
157.15001545452875
167.53818928139692
177.64398398723878
187.75387116220021
197.91873190605667
208.17026382682958
218.42006429606043
228.88657740640343
238.91220237002537
249.02981643500039
259.12103831338205
269.20146577187764
2710.2211203397671
2810.5853836340681
2910.7696701584471
3010.8376696156994
3110.8635880706086
3211.1723528855832
3311.5266840851999
3414.8887021729892
3517.2231334292400
3617.9883519042991
3718.3047268619375
3818.7965400411813
3919.5653309502943
4020.8443791383316
4123.0173968537588
4224.6111718138985
4326.6301328390295
4427.7481017895351
4528.0438335878613
4628.247326017384
4731.0579806909072
4847.5334075996199
4949.3582113442747
5052.589329644168
5155.0050141045101
5256.5174414681639
5365.5434140673495
5475.2067027962923
55107.749790094624
56171.893523138693
57255.504315386055
58665.819492536056
591430.04846785453

\begin{tabular}{lllllllll}
\hline
Summary of Dendrogram \tabularnewline
Label & Height \tabularnewline
1 & 2.68360093903695 \tabularnewline
2 & 3.45010434624810 \tabularnewline
3 & 3.49462244026447 \tabularnewline
4 & 3.81002388443957 \tabularnewline
5 & 3.84444859505235 \tabularnewline
6 & 4.02307071774782 \tabularnewline
7 & 4.31541666586206 \tabularnewline
8 & 4.74254804930852 \tabularnewline
9 & 5.16565068505411 \tabularnewline
10 & 5.43775404004263 \tabularnewline
11 & 5.68573662773786 \tabularnewline
12 & 5.85487053657039 \tabularnewline
13 & 6.32202989553197 \tabularnewline
14 & 7.0818832241149 \tabularnewline
15 & 7.15001545452875 \tabularnewline
16 & 7.53818928139692 \tabularnewline
17 & 7.64398398723878 \tabularnewline
18 & 7.75387116220021 \tabularnewline
19 & 7.91873190605667 \tabularnewline
20 & 8.17026382682958 \tabularnewline
21 & 8.42006429606043 \tabularnewline
22 & 8.88657740640343 \tabularnewline
23 & 8.91220237002537 \tabularnewline
24 & 9.02981643500039 \tabularnewline
25 & 9.12103831338205 \tabularnewline
26 & 9.20146577187764 \tabularnewline
27 & 10.2211203397671 \tabularnewline
28 & 10.5853836340681 \tabularnewline
29 & 10.7696701584471 \tabularnewline
30 & 10.8376696156994 \tabularnewline
31 & 10.8635880706086 \tabularnewline
32 & 11.1723528855832 \tabularnewline
33 & 11.5266840851999 \tabularnewline
34 & 14.8887021729892 \tabularnewline
35 & 17.2231334292400 \tabularnewline
36 & 17.9883519042991 \tabularnewline
37 & 18.3047268619375 \tabularnewline
38 & 18.7965400411813 \tabularnewline
39 & 19.5653309502943 \tabularnewline
40 & 20.8443791383316 \tabularnewline
41 & 23.0173968537588 \tabularnewline
42 & 24.6111718138985 \tabularnewline
43 & 26.6301328390295 \tabularnewline
44 & 27.7481017895351 \tabularnewline
45 & 28.0438335878613 \tabularnewline
46 & 28.247326017384 \tabularnewline
47 & 31.0579806909072 \tabularnewline
48 & 47.5334075996199 \tabularnewline
49 & 49.3582113442747 \tabularnewline
50 & 52.589329644168 \tabularnewline
51 & 55.0050141045101 \tabularnewline
52 & 56.5174414681639 \tabularnewline
53 & 65.5434140673495 \tabularnewline
54 & 75.2067027962923 \tabularnewline
55 & 107.749790094624 \tabularnewline
56 & 171.893523138693 \tabularnewline
57 & 255.504315386055 \tabularnewline
58 & 665.819492536056 \tabularnewline
59 & 1430.04846785453 \tabularnewline
\hline
\end{tabular}
%Source: https://freestatistics.org/blog/index.php?pk=23150&T=1

[TABLE]
[ROW][C]Summary of Dendrogram[/C][/ROW]
[ROW][C]Label[/C][C]Height[/C][/ROW]
[ROW][C]1[/C][C]2.68360093903695[/C][/ROW]
[ROW][C]2[/C][C]3.45010434624810[/C][/ROW]
[ROW][C]3[/C][C]3.49462244026447[/C][/ROW]
[ROW][C]4[/C][C]3.81002388443957[/C][/ROW]
[ROW][C]5[/C][C]3.84444859505235[/C][/ROW]
[ROW][C]6[/C][C]4.02307071774782[/C][/ROW]
[ROW][C]7[/C][C]4.31541666586206[/C][/ROW]
[ROW][C]8[/C][C]4.74254804930852[/C][/ROW]
[ROW][C]9[/C][C]5.16565068505411[/C][/ROW]
[ROW][C]10[/C][C]5.43775404004263[/C][/ROW]
[ROW][C]11[/C][C]5.68573662773786[/C][/ROW]
[ROW][C]12[/C][C]5.85487053657039[/C][/ROW]
[ROW][C]13[/C][C]6.32202989553197[/C][/ROW]
[ROW][C]14[/C][C]7.0818832241149[/C][/ROW]
[ROW][C]15[/C][C]7.15001545452875[/C][/ROW]
[ROW][C]16[/C][C]7.53818928139692[/C][/ROW]
[ROW][C]17[/C][C]7.64398398723878[/C][/ROW]
[ROW][C]18[/C][C]7.75387116220021[/C][/ROW]
[ROW][C]19[/C][C]7.91873190605667[/C][/ROW]
[ROW][C]20[/C][C]8.17026382682958[/C][/ROW]
[ROW][C]21[/C][C]8.42006429606043[/C][/ROW]
[ROW][C]22[/C][C]8.88657740640343[/C][/ROW]
[ROW][C]23[/C][C]8.91220237002537[/C][/ROW]
[ROW][C]24[/C][C]9.02981643500039[/C][/ROW]
[ROW][C]25[/C][C]9.12103831338205[/C][/ROW]
[ROW][C]26[/C][C]9.20146577187764[/C][/ROW]
[ROW][C]27[/C][C]10.2211203397671[/C][/ROW]
[ROW][C]28[/C][C]10.5853836340681[/C][/ROW]
[ROW][C]29[/C][C]10.7696701584471[/C][/ROW]
[ROW][C]30[/C][C]10.8376696156994[/C][/ROW]
[ROW][C]31[/C][C]10.8635880706086[/C][/ROW]
[ROW][C]32[/C][C]11.1723528855832[/C][/ROW]
[ROW][C]33[/C][C]11.5266840851999[/C][/ROW]
[ROW][C]34[/C][C]14.8887021729892[/C][/ROW]
[ROW][C]35[/C][C]17.2231334292400[/C][/ROW]
[ROW][C]36[/C][C]17.9883519042991[/C][/ROW]
[ROW][C]37[/C][C]18.3047268619375[/C][/ROW]
[ROW][C]38[/C][C]18.7965400411813[/C][/ROW]
[ROW][C]39[/C][C]19.5653309502943[/C][/ROW]
[ROW][C]40[/C][C]20.8443791383316[/C][/ROW]
[ROW][C]41[/C][C]23.0173968537588[/C][/ROW]
[ROW][C]42[/C][C]24.6111718138985[/C][/ROW]
[ROW][C]43[/C][C]26.6301328390295[/C][/ROW]
[ROW][C]44[/C][C]27.7481017895351[/C][/ROW]
[ROW][C]45[/C][C]28.0438335878613[/C][/ROW]
[ROW][C]46[/C][C]28.247326017384[/C][/ROW]
[ROW][C]47[/C][C]31.0579806909072[/C][/ROW]
[ROW][C]48[/C][C]47.5334075996199[/C][/ROW]
[ROW][C]49[/C][C]49.3582113442747[/C][/ROW]
[ROW][C]50[/C][C]52.589329644168[/C][/ROW]
[ROW][C]51[/C][C]55.0050141045101[/C][/ROW]
[ROW][C]52[/C][C]56.5174414681639[/C][/ROW]
[ROW][C]53[/C][C]65.5434140673495[/C][/ROW]
[ROW][C]54[/C][C]75.2067027962923[/C][/ROW]
[ROW][C]55[/C][C]107.749790094624[/C][/ROW]
[ROW][C]56[/C][C]171.893523138693[/C][/ROW]
[ROW][C]57[/C][C]255.504315386055[/C][/ROW]
[ROW][C]58[/C][C]665.819492536056[/C][/ROW]
[ROW][C]59[/C][C]1430.04846785453[/C][/ROW]
[/TABLE]
Source: https://freestatistics.org/blog/index.php?pk=23150&T=1

Globally Unique Identifier (entire table): ba.freestatistics.org/blog/index.php?pk=23150&T=1

As an alternative you can also use a QR Code:  

The GUIDs for individual cells are displayed in the table below:

Summary of Dendrogram
LabelHeight
12.68360093903695
23.45010434624810
33.49462244026447
43.81002388443957
53.84444859505235
64.02307071774782
74.31541666586206
84.74254804930852
95.16565068505411
105.43775404004263
115.68573662773786
125.85487053657039
136.32202989553197
147.0818832241149
157.15001545452875
167.53818928139692
177.64398398723878
187.75387116220021
197.91873190605667
208.17026382682958
218.42006429606043
228.88657740640343
238.91220237002537
249.02981643500039
259.12103831338205
269.20146577187764
2710.2211203397671
2810.5853836340681
2910.7696701584471
3010.8376696156994
3110.8635880706086
3211.1723528855832
3311.5266840851999
3414.8887021729892
3517.2231334292400
3617.9883519042991
3718.3047268619375
3818.7965400411813
3919.5653309502943
4020.8443791383316
4123.0173968537588
4224.6111718138985
4326.6301328390295
4427.7481017895351
4528.0438335878613
4628.247326017384
4731.0579806909072
4847.5334075996199
4949.3582113442747
5052.589329644168
5155.0050141045101
5256.5174414681639
5365.5434140673495
5475.2067027962923
55107.749790094624
56171.893523138693
57255.504315386055
58665.819492536056
591430.04846785453


Parameters (Session):
Parameters (R input):
par1 = ward ; par2 = ALL ; par3 = FALSE ; par4 = FALSE ;
R code (references can be found in the software module):
par3 <- as.logical(par3)
par4 <- as.logical(par4)
if (par3 == 'TRUE'){
dum = xlab
xlab = ylab
ylab = dum
}
x <- t(y)
hc <- hclust(dist(x),method=par1)
d <- as.dendrogram(hc)
str(d)
mysub <- paste('Method: ',par1)
bitmap(file='test1.png')
if (par4 == 'TRUE'){
plot(d,main=main,ylab=ylab,xlab=xlab,horiz=par3, nodePar=list(pch = c(1,NA), cex=0.8, lab.cex = 0.8),type='t',center=T, sub=mysub)
} else {
plot(d,main=main,ylab=ylab,xlab=xlab,horiz=par3, nodePar=list(pch = c(1,NA), cex=0.8, lab.cex = 0.8), sub=mysub)
}
dev.off()
if (par2 != 'ALL'){
if (par3 == 'TRUE'){
ylab = 'cluster'
} else {
xlab = 'cluster'
}
par2 <- as.numeric(par2)
memb <- cutree(hc, k = par2)
cent <- NULL
for(k in 1:par2){
cent <- rbind(cent, colMeans(x[memb == k, , drop = FALSE]))
}
hc1 <- hclust(dist(cent),method=par1, members = table(memb))
de <- as.dendrogram(hc1)
bitmap(file='test2.png')
if (par4 == 'TRUE'){
plot(de,main=main,ylab=ylab,xlab=xlab,horiz=par3, nodePar=list(pch = c(1,NA), cex=0.8, lab.cex = 0.8),type='t',center=T, sub=mysub)
} else {
plot(de,main=main,ylab=ylab,xlab=xlab,horiz=par3, nodePar=list(pch = c(1,NA), cex=0.8, lab.cex = 0.8), sub=mysub)
}
dev.off()
str(de)
}
load(file='createtable')
a<-table.start()
a<-table.row.start(a)
a<-table.element(a,'Summary of Dendrogram',2,TRUE)
a<-table.row.end(a)
a<-table.row.start(a)
a<-table.element(a,'Label',header=TRUE)
a<-table.element(a,'Height',header=TRUE)
a<-table.row.end(a)
num <- length(x[,1])-1
for (i in 1:num)
{
a<-table.row.start(a)
a<-table.element(a,hc$labels[i])
a<-table.element(a,hc$height[i])
a<-table.row.end(a)
}
a<-table.end(a)
table.save(a,file='mytable1.tab')
if (par2 != 'ALL'){
a<-table.start()
a<-table.row.start(a)
a<-table.element(a,'Summary of Cut Dendrogram',2,TRUE)
a<-table.row.end(a)
a<-table.row.start(a)
a<-table.element(a,'Label',header=TRUE)
a<-table.element(a,'Height',header=TRUE)
a<-table.row.end(a)
num <- par2-1
for (i in 1:num)
{
a<-table.row.start(a)
a<-table.element(a,i)
a<-table.element(a,hc1$height[i])
a<-table.row.end(a)
}
a<-table.end(a)
table.save(a,file='mytable2.tab')
}