Free Statistics

of Irreproducible Research!

Author's title

Author*The author of this computation has been verified*
R Software Modulerwasp_autocorrelation.wasp
Title produced by software(Partial) Autocorrelation Function
Date of computationWed, 02 Dec 2009 07:58:25 -0700
Cite this page as followsStatistical Computations at FreeStatistics.org, Office for Research Development and Education, URL https://freestatistics.org/blog/index.php?v=date/2009/Dec/02/t1259765929mqai7gfxj4sp6eh.htm/, Retrieved Sun, 28 Apr 2024 00:53:51 +0000
Statistical Computations at FreeStatistics.org, Office for Research Development and Education, URL https://freestatistics.org/blog/index.php?pk=62364, Retrieved Sun, 28 Apr 2024 00:53:51 +0000
QR Codes:

Original text written by user:
IsPrivate?No (this computation is public)
User-defined keywords
Estimated Impact163
Family? (F = Feedback message, R = changed R code, M = changed R Module, P = changed Parameters, D = changed Data)
-     [Multiple Regression] [Q1 The Seatbeltlaw] [2007-11-14 19:27:43] [8cd6641b921d30ebe00b648d1481bba0]
- RMPD  [Multiple Regression] [Seatbelt] [2009-11-12 13:54:52] [b98453cac15ba1066b407e146608df68]
-   PD    [Multiple Regression] [W7] [2009-11-18 21:32:41] [315ba876df544ad397193b5931d5f354]
- RMPD      [(Partial) Autocorrelation Function] [] [2009-11-27 13:34:22] [5482608004c1d7bbf873930172393a2d]
-   P           [(Partial) Autocorrelation Function] [] [2009-12-02 14:58:25] [efdfe680cd785c4af09f858b30f777ec] [Current]
Feedback Forum

Post a new message
Dataseries X:
6539
6699
6962
6981
7024
6940
6774
6671
6965
6969
6822
6878
6691
6837
7018
7167
7076
7171
7093
6971
7142
7047
6999
6650
6475
6437
6639
6422
6272
6232
6003
5673
6050
5977
5796
5752
5609
5839
6069
6006
5809
5797
5502
5568
5864
5764
5615
5615
5681
5915
6334
6494
6620
6578
6495
6538
6737
6651
6530
6563


Summary of computational transaction
Raw Inputview raw input (R code)
Raw Outputview raw output of R engine
Computing time1 seconds
R Server'Gwilym Jenkins' @ 72.249.127.135

\begin{tabular}{lllllllll}
\hline
Summary of computational transaction \tabularnewline
Raw Input & view raw input (R code)  \tabularnewline
Raw Output & view raw output of R engine  \tabularnewline
Computing time & 1 seconds \tabularnewline
R Server & 'Gwilym Jenkins' @ 72.249.127.135 \tabularnewline
\hline
\end{tabular}
%Source: https://freestatistics.org/blog/index.php?pk=62364&T=0

[TABLE]
[ROW][C]Summary of computational transaction[/C][/ROW]
[ROW][C]Raw Input[/C][C]view raw input (R code) [/C][/ROW]
[ROW][C]Raw Output[/C][C]view raw output of R engine [/C][/ROW]
[ROW][C]Computing time[/C][C]1 seconds[/C][/ROW]
[ROW][C]R Server[/C][C]'Gwilym Jenkins' @ 72.249.127.135[/C][/ROW]
[/TABLE]
Source: https://freestatistics.org/blog/index.php?pk=62364&T=0

Globally Unique Identifier (entire table): ba.freestatistics.org/blog/index.php?pk=62364&T=0

As an alternative you can also use a QR Code:  

The GUIDs for individual cells are displayed in the table below:

Summary of computational transaction
Raw Inputview raw input (R code)
Raw Outputview raw output of R engine
Computing time1 seconds
R Server'Gwilym Jenkins' @ 72.249.127.135


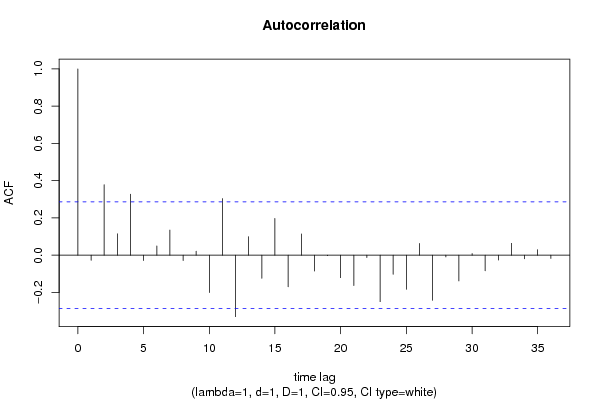
Autocorrelation Function
Time lag kACF(k)T-STATP-value
1-0.027614-0.18930.425333
20.3782142.59290.006323
30.1144960.78490.218212
40.3271912.24310.014822
5-0.029249-0.20050.420969
60.0498690.34190.36698
70.1346120.92290.180399
8-0.028859-0.19780.422009
90.0211260.14480.442731
10-0.200754-1.37630.087625
110.3043062.08620.021206
12-0.330168-2.26350.014131
130.0994910.68210.249269
14-0.124561-0.85390.198732
150.1972321.35220.091398
16-0.170265-1.16730.124493
170.1139730.78140.219254
18-0.08565-0.58720.279945
19-0.002969-0.02040.491924
20-0.120693-0.82740.206088
21-0.163207-1.11890.134436
22-0.01301-0.08920.464654
23-0.250031-1.71410.046547
24-0.1031-0.70680.241585
25-0.183634-1.25890.107136
260.0629510.43160.334012
27-0.242707-1.66390.051392
28-0.009748-0.06680.4735
29-0.138647-0.95050.173356
300.0085610.05870.476724
31-0.083731-0.5740.284341
32-0.026465-0.18140.428404
330.0634320.43490.332825
34-0.019757-0.13540.446419
350.029640.20320.419928
36-0.01727-0.11840.453129

\begin{tabular}{lllllllll}
\hline
Autocorrelation Function \tabularnewline
Time lag k & ACF(k) & T-STAT & P-value \tabularnewline
1 & -0.027614 & -0.1893 & 0.425333 \tabularnewline
2 & 0.378214 & 2.5929 & 0.006323 \tabularnewline
3 & 0.114496 & 0.7849 & 0.218212 \tabularnewline
4 & 0.327191 & 2.2431 & 0.014822 \tabularnewline
5 & -0.029249 & -0.2005 & 0.420969 \tabularnewline
6 & 0.049869 & 0.3419 & 0.36698 \tabularnewline
7 & 0.134612 & 0.9229 & 0.180399 \tabularnewline
8 & -0.028859 & -0.1978 & 0.422009 \tabularnewline
9 & 0.021126 & 0.1448 & 0.442731 \tabularnewline
10 & -0.200754 & -1.3763 & 0.087625 \tabularnewline
11 & 0.304306 & 2.0862 & 0.021206 \tabularnewline
12 & -0.330168 & -2.2635 & 0.014131 \tabularnewline
13 & 0.099491 & 0.6821 & 0.249269 \tabularnewline
14 & -0.124561 & -0.8539 & 0.198732 \tabularnewline
15 & 0.197232 & 1.3522 & 0.091398 \tabularnewline
16 & -0.170265 & -1.1673 & 0.124493 \tabularnewline
17 & 0.113973 & 0.7814 & 0.219254 \tabularnewline
18 & -0.08565 & -0.5872 & 0.279945 \tabularnewline
19 & -0.002969 & -0.0204 & 0.491924 \tabularnewline
20 & -0.120693 & -0.8274 & 0.206088 \tabularnewline
21 & -0.163207 & -1.1189 & 0.134436 \tabularnewline
22 & -0.01301 & -0.0892 & 0.464654 \tabularnewline
23 & -0.250031 & -1.7141 & 0.046547 \tabularnewline
24 & -0.1031 & -0.7068 & 0.241585 \tabularnewline
25 & -0.183634 & -1.2589 & 0.107136 \tabularnewline
26 & 0.062951 & 0.4316 & 0.334012 \tabularnewline
27 & -0.242707 & -1.6639 & 0.051392 \tabularnewline
28 & -0.009748 & -0.0668 & 0.4735 \tabularnewline
29 & -0.138647 & -0.9505 & 0.173356 \tabularnewline
30 & 0.008561 & 0.0587 & 0.476724 \tabularnewline
31 & -0.083731 & -0.574 & 0.284341 \tabularnewline
32 & -0.026465 & -0.1814 & 0.428404 \tabularnewline
33 & 0.063432 & 0.4349 & 0.332825 \tabularnewline
34 & -0.019757 & -0.1354 & 0.446419 \tabularnewline
35 & 0.02964 & 0.2032 & 0.419928 \tabularnewline
36 & -0.01727 & -0.1184 & 0.453129 \tabularnewline
\hline
\end{tabular}
%Source: https://freestatistics.org/blog/index.php?pk=62364&T=1

[TABLE]
[ROW][C]Autocorrelation Function[/C][/ROW]
[ROW][C]Time lag k[/C][C]ACF(k)[/C][C]T-STAT[/C][C]P-value[/C][/ROW]
[ROW][C]1[/C][C]-0.027614[/C][C]-0.1893[/C][C]0.425333[/C][/ROW]
[ROW][C]2[/C][C]0.378214[/C][C]2.5929[/C][C]0.006323[/C][/ROW]
[ROW][C]3[/C][C]0.114496[/C][C]0.7849[/C][C]0.218212[/C][/ROW]
[ROW][C]4[/C][C]0.327191[/C][C]2.2431[/C][C]0.014822[/C][/ROW]
[ROW][C]5[/C][C]-0.029249[/C][C]-0.2005[/C][C]0.420969[/C][/ROW]
[ROW][C]6[/C][C]0.049869[/C][C]0.3419[/C][C]0.36698[/C][/ROW]
[ROW][C]7[/C][C]0.134612[/C][C]0.9229[/C][C]0.180399[/C][/ROW]
[ROW][C]8[/C][C]-0.028859[/C][C]-0.1978[/C][C]0.422009[/C][/ROW]
[ROW][C]9[/C][C]0.021126[/C][C]0.1448[/C][C]0.442731[/C][/ROW]
[ROW][C]10[/C][C]-0.200754[/C][C]-1.3763[/C][C]0.087625[/C][/ROW]
[ROW][C]11[/C][C]0.304306[/C][C]2.0862[/C][C]0.021206[/C][/ROW]
[ROW][C]12[/C][C]-0.330168[/C][C]-2.2635[/C][C]0.014131[/C][/ROW]
[ROW][C]13[/C][C]0.099491[/C][C]0.6821[/C][C]0.249269[/C][/ROW]
[ROW][C]14[/C][C]-0.124561[/C][C]-0.8539[/C][C]0.198732[/C][/ROW]
[ROW][C]15[/C][C]0.197232[/C][C]1.3522[/C][C]0.091398[/C][/ROW]
[ROW][C]16[/C][C]-0.170265[/C][C]-1.1673[/C][C]0.124493[/C][/ROW]
[ROW][C]17[/C][C]0.113973[/C][C]0.7814[/C][C]0.219254[/C][/ROW]
[ROW][C]18[/C][C]-0.08565[/C][C]-0.5872[/C][C]0.279945[/C][/ROW]
[ROW][C]19[/C][C]-0.002969[/C][C]-0.0204[/C][C]0.491924[/C][/ROW]
[ROW][C]20[/C][C]-0.120693[/C][C]-0.8274[/C][C]0.206088[/C][/ROW]
[ROW][C]21[/C][C]-0.163207[/C][C]-1.1189[/C][C]0.134436[/C][/ROW]
[ROW][C]22[/C][C]-0.01301[/C][C]-0.0892[/C][C]0.464654[/C][/ROW]
[ROW][C]23[/C][C]-0.250031[/C][C]-1.7141[/C][C]0.046547[/C][/ROW]
[ROW][C]24[/C][C]-0.1031[/C][C]-0.7068[/C][C]0.241585[/C][/ROW]
[ROW][C]25[/C][C]-0.183634[/C][C]-1.2589[/C][C]0.107136[/C][/ROW]
[ROW][C]26[/C][C]0.062951[/C][C]0.4316[/C][C]0.334012[/C][/ROW]
[ROW][C]27[/C][C]-0.242707[/C][C]-1.6639[/C][C]0.051392[/C][/ROW]
[ROW][C]28[/C][C]-0.009748[/C][C]-0.0668[/C][C]0.4735[/C][/ROW]
[ROW][C]29[/C][C]-0.138647[/C][C]-0.9505[/C][C]0.173356[/C][/ROW]
[ROW][C]30[/C][C]0.008561[/C][C]0.0587[/C][C]0.476724[/C][/ROW]
[ROW][C]31[/C][C]-0.083731[/C][C]-0.574[/C][C]0.284341[/C][/ROW]
[ROW][C]32[/C][C]-0.026465[/C][C]-0.1814[/C][C]0.428404[/C][/ROW]
[ROW][C]33[/C][C]0.063432[/C][C]0.4349[/C][C]0.332825[/C][/ROW]
[ROW][C]34[/C][C]-0.019757[/C][C]-0.1354[/C][C]0.446419[/C][/ROW]
[ROW][C]35[/C][C]0.02964[/C][C]0.2032[/C][C]0.419928[/C][/ROW]
[ROW][C]36[/C][C]-0.01727[/C][C]-0.1184[/C][C]0.453129[/C][/ROW]
[/TABLE]
Source: https://freestatistics.org/blog/index.php?pk=62364&T=1

Globally Unique Identifier (entire table): ba.freestatistics.org/blog/index.php?pk=62364&T=1

As an alternative you can also use a QR Code:  

The GUIDs for individual cells are displayed in the table below:

Autocorrelation Function
Time lag kACF(k)T-STATP-value
1-0.027614-0.18930.425333
20.3782142.59290.006323
30.1144960.78490.218212
40.3271912.24310.014822
5-0.029249-0.20050.420969
60.0498690.34190.36698
70.1346120.92290.180399
8-0.028859-0.19780.422009
90.0211260.14480.442731
10-0.200754-1.37630.087625
110.3043062.08620.021206
12-0.330168-2.26350.014131
130.0994910.68210.249269
14-0.124561-0.85390.198732
150.1972321.35220.091398
16-0.170265-1.16730.124493
170.1139730.78140.219254
18-0.08565-0.58720.279945
19-0.002969-0.02040.491924
20-0.120693-0.82740.206088
21-0.163207-1.11890.134436
22-0.01301-0.08920.464654
23-0.250031-1.71410.046547
24-0.1031-0.70680.241585
25-0.183634-1.25890.107136
260.0629510.43160.334012
27-0.242707-1.66390.051392
28-0.009748-0.06680.4735
29-0.138647-0.95050.173356
300.0085610.05870.476724
31-0.083731-0.5740.284341
32-0.026465-0.18140.428404
330.0634320.43490.332825
34-0.019757-0.13540.446419
350.029640.20320.419928
36-0.01727-0.11840.453129


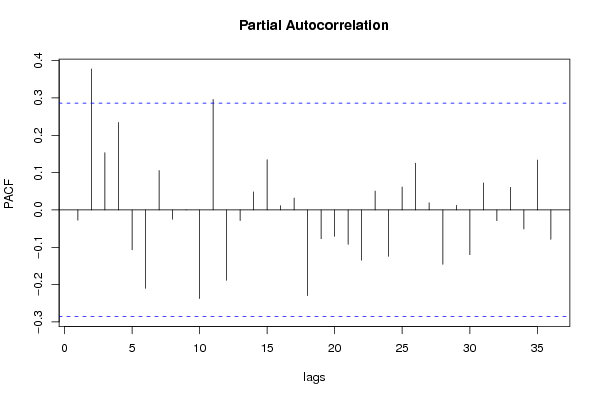
Partial Autocorrelation Function
Time lag kPACF(k)T-STATP-value
1-0.027614-0.18930.425333
20.3777392.58960.006375
30.1534161.05180.149141
40.234511.60770.057297
5-0.106826-0.73240.233793
6-0.21011-1.44040.078186
70.1056410.72420.236254
8-0.024915-0.17080.432553
90.0004240.00290.498847
10-0.237281-1.62670.055242
110.2961312.03020.02401
12-0.188439-1.29190.101359
13-0.028482-0.19530.423014
140.0482430.33070.371155
150.1345450.92240.180517
160.0114720.07860.468823
170.0317850.21790.414223
18-0.229493-1.57330.061176
19-0.076967-0.52770.30011
20-0.070581-0.48390.315359
21-0.092044-0.6310.265541
22-0.134766-0.92390.180127
230.0506120.3470.365078
24-0.12425-0.85180.199318
250.0612840.42010.338149
260.1253080.85910.197332
270.0190460.13060.448335
28-0.145532-0.99770.161763
290.012240.08390.46674
30-0.120038-0.82290.207349
310.0724860.49690.310773
32-0.028893-0.19810.421919
330.0605870.41540.339882
34-0.050909-0.3490.364318
350.1336630.91630.182081
36-0.078626-0.5390.296204

\begin{tabular}{lllllllll}
\hline
Partial Autocorrelation Function \tabularnewline
Time lag k & PACF(k) & T-STAT & P-value \tabularnewline
1 & -0.027614 & -0.1893 & 0.425333 \tabularnewline
2 & 0.377739 & 2.5896 & 0.006375 \tabularnewline
3 & 0.153416 & 1.0518 & 0.149141 \tabularnewline
4 & 0.23451 & 1.6077 & 0.057297 \tabularnewline
5 & -0.106826 & -0.7324 & 0.233793 \tabularnewline
6 & -0.21011 & -1.4404 & 0.078186 \tabularnewline
7 & 0.105641 & 0.7242 & 0.236254 \tabularnewline
8 & -0.024915 & -0.1708 & 0.432553 \tabularnewline
9 & 0.000424 & 0.0029 & 0.498847 \tabularnewline
10 & -0.237281 & -1.6267 & 0.055242 \tabularnewline
11 & 0.296131 & 2.0302 & 0.02401 \tabularnewline
12 & -0.188439 & -1.2919 & 0.101359 \tabularnewline
13 & -0.028482 & -0.1953 & 0.423014 \tabularnewline
14 & 0.048243 & 0.3307 & 0.371155 \tabularnewline
15 & 0.134545 & 0.9224 & 0.180517 \tabularnewline
16 & 0.011472 & 0.0786 & 0.468823 \tabularnewline
17 & 0.031785 & 0.2179 & 0.414223 \tabularnewline
18 & -0.229493 & -1.5733 & 0.061176 \tabularnewline
19 & -0.076967 & -0.5277 & 0.30011 \tabularnewline
20 & -0.070581 & -0.4839 & 0.315359 \tabularnewline
21 & -0.092044 & -0.631 & 0.265541 \tabularnewline
22 & -0.134766 & -0.9239 & 0.180127 \tabularnewline
23 & 0.050612 & 0.347 & 0.365078 \tabularnewline
24 & -0.12425 & -0.8518 & 0.199318 \tabularnewline
25 & 0.061284 & 0.4201 & 0.338149 \tabularnewline
26 & 0.125308 & 0.8591 & 0.197332 \tabularnewline
27 & 0.019046 & 0.1306 & 0.448335 \tabularnewline
28 & -0.145532 & -0.9977 & 0.161763 \tabularnewline
29 & 0.01224 & 0.0839 & 0.46674 \tabularnewline
30 & -0.120038 & -0.8229 & 0.207349 \tabularnewline
31 & 0.072486 & 0.4969 & 0.310773 \tabularnewline
32 & -0.028893 & -0.1981 & 0.421919 \tabularnewline
33 & 0.060587 & 0.4154 & 0.339882 \tabularnewline
34 & -0.050909 & -0.349 & 0.364318 \tabularnewline
35 & 0.133663 & 0.9163 & 0.182081 \tabularnewline
36 & -0.078626 & -0.539 & 0.296204 \tabularnewline
\hline
\end{tabular}
%Source: https://freestatistics.org/blog/index.php?pk=62364&T=2

[TABLE]
[ROW][C]Partial Autocorrelation Function[/C][/ROW]
[ROW][C]Time lag k[/C][C]PACF(k)[/C][C]T-STAT[/C][C]P-value[/C][/ROW]
[ROW][C]1[/C][C]-0.027614[/C][C]-0.1893[/C][C]0.425333[/C][/ROW]
[ROW][C]2[/C][C]0.377739[/C][C]2.5896[/C][C]0.006375[/C][/ROW]
[ROW][C]3[/C][C]0.153416[/C][C]1.0518[/C][C]0.149141[/C][/ROW]
[ROW][C]4[/C][C]0.23451[/C][C]1.6077[/C][C]0.057297[/C][/ROW]
[ROW][C]5[/C][C]-0.106826[/C][C]-0.7324[/C][C]0.233793[/C][/ROW]
[ROW][C]6[/C][C]-0.21011[/C][C]-1.4404[/C][C]0.078186[/C][/ROW]
[ROW][C]7[/C][C]0.105641[/C][C]0.7242[/C][C]0.236254[/C][/ROW]
[ROW][C]8[/C][C]-0.024915[/C][C]-0.1708[/C][C]0.432553[/C][/ROW]
[ROW][C]9[/C][C]0.000424[/C][C]0.0029[/C][C]0.498847[/C][/ROW]
[ROW][C]10[/C][C]-0.237281[/C][C]-1.6267[/C][C]0.055242[/C][/ROW]
[ROW][C]11[/C][C]0.296131[/C][C]2.0302[/C][C]0.02401[/C][/ROW]
[ROW][C]12[/C][C]-0.188439[/C][C]-1.2919[/C][C]0.101359[/C][/ROW]
[ROW][C]13[/C][C]-0.028482[/C][C]-0.1953[/C][C]0.423014[/C][/ROW]
[ROW][C]14[/C][C]0.048243[/C][C]0.3307[/C][C]0.371155[/C][/ROW]
[ROW][C]15[/C][C]0.134545[/C][C]0.9224[/C][C]0.180517[/C][/ROW]
[ROW][C]16[/C][C]0.011472[/C][C]0.0786[/C][C]0.468823[/C][/ROW]
[ROW][C]17[/C][C]0.031785[/C][C]0.2179[/C][C]0.414223[/C][/ROW]
[ROW][C]18[/C][C]-0.229493[/C][C]-1.5733[/C][C]0.061176[/C][/ROW]
[ROW][C]19[/C][C]-0.076967[/C][C]-0.5277[/C][C]0.30011[/C][/ROW]
[ROW][C]20[/C][C]-0.070581[/C][C]-0.4839[/C][C]0.315359[/C][/ROW]
[ROW][C]21[/C][C]-0.092044[/C][C]-0.631[/C][C]0.265541[/C][/ROW]
[ROW][C]22[/C][C]-0.134766[/C][C]-0.9239[/C][C]0.180127[/C][/ROW]
[ROW][C]23[/C][C]0.050612[/C][C]0.347[/C][C]0.365078[/C][/ROW]
[ROW][C]24[/C][C]-0.12425[/C][C]-0.8518[/C][C]0.199318[/C][/ROW]
[ROW][C]25[/C][C]0.061284[/C][C]0.4201[/C][C]0.338149[/C][/ROW]
[ROW][C]26[/C][C]0.125308[/C][C]0.8591[/C][C]0.197332[/C][/ROW]
[ROW][C]27[/C][C]0.019046[/C][C]0.1306[/C][C]0.448335[/C][/ROW]
[ROW][C]28[/C][C]-0.145532[/C][C]-0.9977[/C][C]0.161763[/C][/ROW]
[ROW][C]29[/C][C]0.01224[/C][C]0.0839[/C][C]0.46674[/C][/ROW]
[ROW][C]30[/C][C]-0.120038[/C][C]-0.8229[/C][C]0.207349[/C][/ROW]
[ROW][C]31[/C][C]0.072486[/C][C]0.4969[/C][C]0.310773[/C][/ROW]
[ROW][C]32[/C][C]-0.028893[/C][C]-0.1981[/C][C]0.421919[/C][/ROW]
[ROW][C]33[/C][C]0.060587[/C][C]0.4154[/C][C]0.339882[/C][/ROW]
[ROW][C]34[/C][C]-0.050909[/C][C]-0.349[/C][C]0.364318[/C][/ROW]
[ROW][C]35[/C][C]0.133663[/C][C]0.9163[/C][C]0.182081[/C][/ROW]
[ROW][C]36[/C][C]-0.078626[/C][C]-0.539[/C][C]0.296204[/C][/ROW]
[/TABLE]
Source: https://freestatistics.org/blog/index.php?pk=62364&T=2

Globally Unique Identifier (entire table): ba.freestatistics.org/blog/index.php?pk=62364&T=2

As an alternative you can also use a QR Code:  

The GUIDs for individual cells are displayed in the table below:

Partial Autocorrelation Function
Time lag kPACF(k)T-STATP-value
1-0.027614-0.18930.425333
20.3777392.58960.006375
30.1534161.05180.149141
40.234511.60770.057297
5-0.106826-0.73240.233793
6-0.21011-1.44040.078186
70.1056410.72420.236254
8-0.024915-0.17080.432553
90.0004240.00290.498847
10-0.237281-1.62670.055242
110.2961312.03020.02401
12-0.188439-1.29190.101359
13-0.028482-0.19530.423014
140.0482430.33070.371155
150.1345450.92240.180517
160.0114720.07860.468823
170.0317850.21790.414223
18-0.229493-1.57330.061176
19-0.076967-0.52770.30011
20-0.070581-0.48390.315359
21-0.092044-0.6310.265541
22-0.134766-0.92390.180127
230.0506120.3470.365078
24-0.12425-0.85180.199318
250.0612840.42010.338149
260.1253080.85910.197332
270.0190460.13060.448335
28-0.145532-0.99770.161763
290.012240.08390.46674
30-0.120038-0.82290.207349
310.0724860.49690.310773
32-0.028893-0.19810.421919
330.0605870.41540.339882
34-0.050909-0.3490.364318
350.1336630.91630.182081
36-0.078626-0.5390.296204


Parameters (Session):
par1 = 36 ; par2 = 1 ; par3 = 1 ; par4 = 1 ; par5 = 12 ; par6 = White Noise ; par7 = 0.95 ;
Parameters (R input):
par1 = 36 ; par2 = 1 ; par3 = 1 ; par4 = 1 ; par5 = 12 ; par6 = White Noise ; par7 = 0.95 ;
R code (references can be found in the software module):
if (par1 == 'Default') {
par1 = 10*log10(length(x))
} else {
par1 <- as.numeric(par1)
}
par2 <- as.numeric(par2)
par3 <- as.numeric(par3)
par4 <- as.numeric(par4)
par5 <- as.numeric(par5)
if (par6 == 'White Noise') par6 <- 'white' else par6 <- 'ma'
par7 <- as.numeric(par7)
if (par2 == 0) {
x <- log(x)
} else {
x <- (x ^ par2 - 1) / par2
}
if (par3 > 0) x <- diff(x,lag=1,difference=par3)
if (par4 > 0) x <- diff(x,lag=par5,difference=par4)
bitmap(file='pic1.png')
racf <- acf(x, par1, main='Autocorrelation', xlab='time lag', ylab='ACF', ci.type=par6, ci=par7, sub=paste('(lambda=',par2,', d=',par3,', D=',par4,', CI=', par7, ', CI type=',par6,')',sep=''))
dev.off()
bitmap(file='pic2.png')
rpacf <- pacf(x,par1,main='Partial Autocorrelation',xlab='lags',ylab='PACF')
dev.off()
(myacf <- c(racf$acf))
(mypacf <- c(rpacf$acf))
lengthx <- length(x)
sqrtn <- sqrt(lengthx)
load(file='createtable')
a<-table.start()
a<-table.row.start(a)
a<-table.element(a,'Autocorrelation Function',4,TRUE)
a<-table.row.end(a)
a<-table.row.start(a)
a<-table.element(a,'Time lag k',header=TRUE)
a<-table.element(a,hyperlink('basics.htm','ACF(k)','click here for more information about the Autocorrelation Function'),header=TRUE)
a<-table.element(a,'T-STAT',header=TRUE)
a<-table.element(a,'P-value',header=TRUE)
a<-table.row.end(a)
for (i in 2:(par1+1)) {
a<-table.row.start(a)
a<-table.element(a,i-1,header=TRUE)
a<-table.element(a,round(myacf[i],6))
mytstat <- myacf[i]*sqrtn
a<-table.element(a,round(mytstat,4))
a<-table.element(a,round(1-pt(abs(mytstat),lengthx),6))
a<-table.row.end(a)
}
a<-table.end(a)
table.save(a,file='mytable.tab')
a<-table.start()
a<-table.row.start(a)
a<-table.element(a,'Partial Autocorrelation Function',4,TRUE)
a<-table.row.end(a)
a<-table.row.start(a)
a<-table.element(a,'Time lag k',header=TRUE)
a<-table.element(a,hyperlink('basics.htm','PACF(k)','click here for more information about the Partial Autocorrelation Function'),header=TRUE)
a<-table.element(a,'T-STAT',header=TRUE)
a<-table.element(a,'P-value',header=TRUE)
a<-table.row.end(a)
for (i in 1:par1) {
a<-table.row.start(a)
a<-table.element(a,i,header=TRUE)
a<-table.element(a,round(mypacf[i],6))
mytstat <- mypacf[i]*sqrtn
a<-table.element(a,round(mytstat,4))
a<-table.element(a,round(1-pt(abs(mytstat),lengthx),6))
a<-table.row.end(a)
}
a<-table.end(a)
table.save(a,file='mytable1.tab')