Free Statistics

of Irreproducible Research!

Author's title

Author*The author of this computation has been verified*
R Software Modulerwasp_exponentialsmoothing.wasp
Title produced by softwareExponential Smoothing
Date of computationFri, 04 Dec 2009 06:41:32 -0700
Cite this page as followsStatistical Computations at FreeStatistics.org, Office for Research Development and Education, URL https://freestatistics.org/blog/index.php?v=date/2009/Dec/04/t1259934144hzokm2ccp9ks52o.htm/, Retrieved Sat, 27 Apr 2024 20:25:42 +0000
Statistical Computations at FreeStatistics.org, Office for Research Development and Education, URL https://freestatistics.org/blog/index.php?pk=63501, Retrieved Sat, 27 Apr 2024 20:25:42 +0000
QR Codes:

Original text written by user:
IsPrivate?No (this computation is public)
User-defined keywordsWorkshop 9 - Populaire technieken 2
Estimated Impact149
Family? (F = Feedback message, R = changed R code, M = changed R Module, P = changed Parameters, D = changed Data)
-     [Univariate Data Series] [data set] [2008-12-01 19:54:57] [b98453cac15ba1066b407e146608df68]
- RMP   [Exponential Smoothing] [] [2009-11-27 15:04:36] [b98453cac15ba1066b407e146608df68]
-   PD    [Exponential Smoothing] [BBWS9-exponential...] [2009-12-01 20:49:49] [408e92805dcb18620260f240a7fb9d53]
-   PD        [Exponential Smoothing] [shw-ws9] [2009-12-04 13:41:32] [5b5bced41faf164488f2c271c918b21f] [Current]
-   PD          [Exponential Smoothing] [ws 9 theorie 2] [2009-12-04 19:32:15] [134dc66689e3d457a82860db6471d419]
Feedback Forum

Post a new message
Dataseries X:
1178
2141
2238
2685
4341
5376
4478
6404
4617
3024
1897
2075
1351
2211
2453
3042
4765
4992
4601
6266
4812
3159
1916
2237
1595
2453
2226
3597
4706
4974
5756
5493
5004
3225
2006
2291
1588
2105
2191
3591
4668
4885
5822
5599
5340
3082
2010
2301
1514
1979
2480
3499
4676
5585
5610
5796
6199
3030
1930
2552


Summary of computational transaction
Raw Inputview raw input (R code)
Raw Outputview raw output of R engine
Computing time1 seconds
R Server'Gwilym Jenkins' @ 72.249.127.135

\begin{tabular}{lllllllll}
\hline
Summary of computational transaction \tabularnewline
Raw Input & view raw input (R code)  \tabularnewline
Raw Output & view raw output of R engine  \tabularnewline
Computing time & 1 seconds \tabularnewline
R Server & 'Gwilym Jenkins' @ 72.249.127.135 \tabularnewline
\hline
\end{tabular}
%Source: https://freestatistics.org/blog/index.php?pk=63501&T=0

[TABLE]
[ROW][C]Summary of computational transaction[/C][/ROW]
[ROW][C]Raw Input[/C][C]view raw input (R code) [/C][/ROW]
[ROW][C]Raw Output[/C][C]view raw output of R engine [/C][/ROW]
[ROW][C]Computing time[/C][C]1 seconds[/C][/ROW]
[ROW][C]R Server[/C][C]'Gwilym Jenkins' @ 72.249.127.135[/C][/ROW]
[/TABLE]
Source: https://freestatistics.org/blog/index.php?pk=63501&T=0

Globally Unique Identifier (entire table): ba.freestatistics.org/blog/index.php?pk=63501&T=0

As an alternative you can also use a QR Code:  

The GUIDs for individual cells are displayed in the table below:

Summary of computational transaction
Raw Inputview raw input (R code)
Raw Outputview raw output of R engine
Computing time1 seconds
R Server'Gwilym Jenkins' @ 72.249.127.135


Estimated Parameters of Exponential Smoothing
ParameterValue
alpha0
beta0
gamma1

\begin{tabular}{lllllllll}
\hline
Estimated Parameters of Exponential Smoothing \tabularnewline
Parameter & Value \tabularnewline
alpha & 0 \tabularnewline
beta & 0 \tabularnewline
gamma & 1 \tabularnewline
\hline
\end{tabular}
%Source: https://freestatistics.org/blog/index.php?pk=63501&T=1

[TABLE]
[ROW][C]Estimated Parameters of Exponential Smoothing[/C][/ROW]
[ROW][C]Parameter[/C][C]Value[/C][/ROW]
[ROW][C]alpha[/C][C]0[/C][/ROW]
[ROW][C]beta[/C][C]0[/C][/ROW]
[ROW][C]gamma[/C][C]1[/C][/ROW]
[/TABLE]
Source: https://freestatistics.org/blog/index.php?pk=63501&T=1

Globally Unique Identifier (entire table): ba.freestatistics.org/blog/index.php?pk=63501&T=1

As an alternative you can also use a QR Code:  

The GUIDs for individual cells are displayed in the table below:

Estimated Parameters of Exponential Smoothing
ParameterValue
alpha0
beta0
gamma1


Interpolation Forecasts of Exponential Smoothing
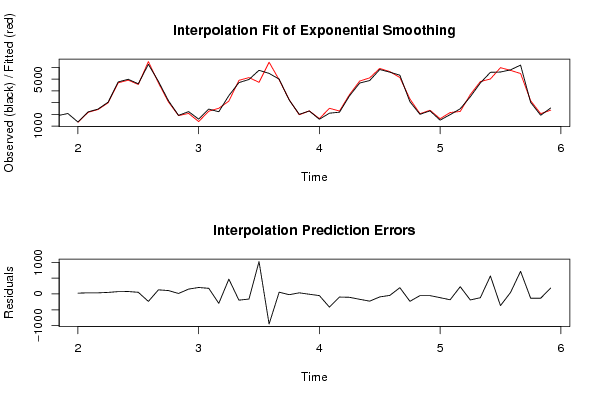
tObservedFittedResiduals
1313511325.6731484395625.3268515604386
1422112175.1700760297935.8299239702087
1524532417.3804787052435.619521294755
1630422993.0812069117248.9187930882804
1747654690.891404157474.1085958426038
1849924915.398223226976.6017767730964
1946014548.8044748479152.1955251520876
2062666501.21656954778-235.216569547776
2148124681.78202297392130.217977026077
2231593052.28190202208106.718097977923
2319161901.1872187203314.8127812796731
2422372083.46592721638153.534072783622
2515951390.04234789620204.957652103798
2624532274.74185435041178.258145649585
2722262523.54908394488-297.549083944876
2835973129.2797341701467.720265829899
2947064901.38919535208-195.389195352082
3049745134.54663409665-160.546634096650
3157564732.069731781631023.93026821837
3254936444.07821864397-951.078218643966
3350044948.4327714712955.5672285287146
3432253248.35478283920-23.3547828391957
3520061970.0681102350535.9318897649521
3622912299.97839372023-8.97839372023054
3715881639.79902715819-51.7990271581941
3821052521.73692872997-416.736928729972
3921912288.23071382301-97.2307138230103
4035913697.32506853949-106.325068539491
4146684836.95217044497-168.952170444973
4248855112.08949621537-227.089496215372
4358225915.43073937987-93.4307393798745
4455995644.79574515114-45.795745151142
4553405141.96481026847198.035189731531
4630823313.71234637878-231.712346378783
4720102061.05425348902-51.054253489016
4823012353.73254583912-52.7325458391233
4915141631.38388665256-117.383886652562
5019792162.37760879342-183.377608793421
5124802250.58642769829229.413572301713
5234993688.43999092501-189.439990925013
5346764794.37808067904-118.378080679036
5455855016.95527768273568.044722317265
5556105978.91262488975-368.912624889754
5657965749.5642392519346.4357607480651
5761995483.27832142343715.721678576568
5830303164.5091085043-134.509108504300
5919302063.69050781928-133.690507819285
6025522362.32709862512189.672901374883

\begin{tabular}{lllllllll}
\hline
Interpolation Forecasts of Exponential Smoothing \tabularnewline
t & Observed & Fitted & Residuals \tabularnewline
13 & 1351 & 1325.67314843956 & 25.3268515604386 \tabularnewline
14 & 2211 & 2175.17007602979 & 35.8299239702087 \tabularnewline
15 & 2453 & 2417.38047870524 & 35.619521294755 \tabularnewline
16 & 3042 & 2993.08120691172 & 48.9187930882804 \tabularnewline
17 & 4765 & 4690.8914041574 & 74.1085958426038 \tabularnewline
18 & 4992 & 4915.3982232269 & 76.6017767730964 \tabularnewline
19 & 4601 & 4548.80447484791 & 52.1955251520876 \tabularnewline
20 & 6266 & 6501.21656954778 & -235.216569547776 \tabularnewline
21 & 4812 & 4681.78202297392 & 130.217977026077 \tabularnewline
22 & 3159 & 3052.28190202208 & 106.718097977923 \tabularnewline
23 & 1916 & 1901.18721872033 & 14.8127812796731 \tabularnewline
24 & 2237 & 2083.46592721638 & 153.534072783622 \tabularnewline
25 & 1595 & 1390.04234789620 & 204.957652103798 \tabularnewline
26 & 2453 & 2274.74185435041 & 178.258145649585 \tabularnewline
27 & 2226 & 2523.54908394488 & -297.549083944876 \tabularnewline
28 & 3597 & 3129.2797341701 & 467.720265829899 \tabularnewline
29 & 4706 & 4901.38919535208 & -195.389195352082 \tabularnewline
30 & 4974 & 5134.54663409665 & -160.546634096650 \tabularnewline
31 & 5756 & 4732.06973178163 & 1023.93026821837 \tabularnewline
32 & 5493 & 6444.07821864397 & -951.078218643966 \tabularnewline
33 & 5004 & 4948.43277147129 & 55.5672285287146 \tabularnewline
34 & 3225 & 3248.35478283920 & -23.3547828391957 \tabularnewline
35 & 2006 & 1970.06811023505 & 35.9318897649521 \tabularnewline
36 & 2291 & 2299.97839372023 & -8.97839372023054 \tabularnewline
37 & 1588 & 1639.79902715819 & -51.7990271581941 \tabularnewline
38 & 2105 & 2521.73692872997 & -416.736928729972 \tabularnewline
39 & 2191 & 2288.23071382301 & -97.2307138230103 \tabularnewline
40 & 3591 & 3697.32506853949 & -106.325068539491 \tabularnewline
41 & 4668 & 4836.95217044497 & -168.952170444973 \tabularnewline
42 & 4885 & 5112.08949621537 & -227.089496215372 \tabularnewline
43 & 5822 & 5915.43073937987 & -93.4307393798745 \tabularnewline
44 & 5599 & 5644.79574515114 & -45.795745151142 \tabularnewline
45 & 5340 & 5141.96481026847 & 198.035189731531 \tabularnewline
46 & 3082 & 3313.71234637878 & -231.712346378783 \tabularnewline
47 & 2010 & 2061.05425348902 & -51.054253489016 \tabularnewline
48 & 2301 & 2353.73254583912 & -52.7325458391233 \tabularnewline
49 & 1514 & 1631.38388665256 & -117.383886652562 \tabularnewline
50 & 1979 & 2162.37760879342 & -183.377608793421 \tabularnewline
51 & 2480 & 2250.58642769829 & 229.413572301713 \tabularnewline
52 & 3499 & 3688.43999092501 & -189.439990925013 \tabularnewline
53 & 4676 & 4794.37808067904 & -118.378080679036 \tabularnewline
54 & 5585 & 5016.95527768273 & 568.044722317265 \tabularnewline
55 & 5610 & 5978.91262488975 & -368.912624889754 \tabularnewline
56 & 5796 & 5749.56423925193 & 46.4357607480651 \tabularnewline
57 & 6199 & 5483.27832142343 & 715.721678576568 \tabularnewline
58 & 3030 & 3164.5091085043 & -134.509108504300 \tabularnewline
59 & 1930 & 2063.69050781928 & -133.690507819285 \tabularnewline
60 & 2552 & 2362.32709862512 & 189.672901374883 \tabularnewline
\hline
\end{tabular}
%Source: https://freestatistics.org/blog/index.php?pk=63501&T=2

[TABLE]
[ROW][C]Interpolation Forecasts of Exponential Smoothing[/C][/ROW]
[ROW][C]t[/C][C]Observed[/C][C]Fitted[/C][C]Residuals[/C][/ROW]
[ROW][C]13[/C][C]1351[/C][C]1325.67314843956[/C][C]25.3268515604386[/C][/ROW]
[ROW][C]14[/C][C]2211[/C][C]2175.17007602979[/C][C]35.8299239702087[/C][/ROW]
[ROW][C]15[/C][C]2453[/C][C]2417.38047870524[/C][C]35.619521294755[/C][/ROW]
[ROW][C]16[/C][C]3042[/C][C]2993.08120691172[/C][C]48.9187930882804[/C][/ROW]
[ROW][C]17[/C][C]4765[/C][C]4690.8914041574[/C][C]74.1085958426038[/C][/ROW]
[ROW][C]18[/C][C]4992[/C][C]4915.3982232269[/C][C]76.6017767730964[/C][/ROW]
[ROW][C]19[/C][C]4601[/C][C]4548.80447484791[/C][C]52.1955251520876[/C][/ROW]
[ROW][C]20[/C][C]6266[/C][C]6501.21656954778[/C][C]-235.216569547776[/C][/ROW]
[ROW][C]21[/C][C]4812[/C][C]4681.78202297392[/C][C]130.217977026077[/C][/ROW]
[ROW][C]22[/C][C]3159[/C][C]3052.28190202208[/C][C]106.718097977923[/C][/ROW]
[ROW][C]23[/C][C]1916[/C][C]1901.18721872033[/C][C]14.8127812796731[/C][/ROW]
[ROW][C]24[/C][C]2237[/C][C]2083.46592721638[/C][C]153.534072783622[/C][/ROW]
[ROW][C]25[/C][C]1595[/C][C]1390.04234789620[/C][C]204.957652103798[/C][/ROW]
[ROW][C]26[/C][C]2453[/C][C]2274.74185435041[/C][C]178.258145649585[/C][/ROW]
[ROW][C]27[/C][C]2226[/C][C]2523.54908394488[/C][C]-297.549083944876[/C][/ROW]
[ROW][C]28[/C][C]3597[/C][C]3129.2797341701[/C][C]467.720265829899[/C][/ROW]
[ROW][C]29[/C][C]4706[/C][C]4901.38919535208[/C][C]-195.389195352082[/C][/ROW]
[ROW][C]30[/C][C]4974[/C][C]5134.54663409665[/C][C]-160.546634096650[/C][/ROW]
[ROW][C]31[/C][C]5756[/C][C]4732.06973178163[/C][C]1023.93026821837[/C][/ROW]
[ROW][C]32[/C][C]5493[/C][C]6444.07821864397[/C][C]-951.078218643966[/C][/ROW]
[ROW][C]33[/C][C]5004[/C][C]4948.43277147129[/C][C]55.5672285287146[/C][/ROW]
[ROW][C]34[/C][C]3225[/C][C]3248.35478283920[/C][C]-23.3547828391957[/C][/ROW]
[ROW][C]35[/C][C]2006[/C][C]1970.06811023505[/C][C]35.9318897649521[/C][/ROW]
[ROW][C]36[/C][C]2291[/C][C]2299.97839372023[/C][C]-8.97839372023054[/C][/ROW]
[ROW][C]37[/C][C]1588[/C][C]1639.79902715819[/C][C]-51.7990271581941[/C][/ROW]
[ROW][C]38[/C][C]2105[/C][C]2521.73692872997[/C][C]-416.736928729972[/C][/ROW]
[ROW][C]39[/C][C]2191[/C][C]2288.23071382301[/C][C]-97.2307138230103[/C][/ROW]
[ROW][C]40[/C][C]3591[/C][C]3697.32506853949[/C][C]-106.325068539491[/C][/ROW]
[ROW][C]41[/C][C]4668[/C][C]4836.95217044497[/C][C]-168.952170444973[/C][/ROW]
[ROW][C]42[/C][C]4885[/C][C]5112.08949621537[/C][C]-227.089496215372[/C][/ROW]
[ROW][C]43[/C][C]5822[/C][C]5915.43073937987[/C][C]-93.4307393798745[/C][/ROW]
[ROW][C]44[/C][C]5599[/C][C]5644.79574515114[/C][C]-45.795745151142[/C][/ROW]
[ROW][C]45[/C][C]5340[/C][C]5141.96481026847[/C][C]198.035189731531[/C][/ROW]
[ROW][C]46[/C][C]3082[/C][C]3313.71234637878[/C][C]-231.712346378783[/C][/ROW]
[ROW][C]47[/C][C]2010[/C][C]2061.05425348902[/C][C]-51.054253489016[/C][/ROW]
[ROW][C]48[/C][C]2301[/C][C]2353.73254583912[/C][C]-52.7325458391233[/C][/ROW]
[ROW][C]49[/C][C]1514[/C][C]1631.38388665256[/C][C]-117.383886652562[/C][/ROW]
[ROW][C]50[/C][C]1979[/C][C]2162.37760879342[/C][C]-183.377608793421[/C][/ROW]
[ROW][C]51[/C][C]2480[/C][C]2250.58642769829[/C][C]229.413572301713[/C][/ROW]
[ROW][C]52[/C][C]3499[/C][C]3688.43999092501[/C][C]-189.439990925013[/C][/ROW]
[ROW][C]53[/C][C]4676[/C][C]4794.37808067904[/C][C]-118.378080679036[/C][/ROW]
[ROW][C]54[/C][C]5585[/C][C]5016.95527768273[/C][C]568.044722317265[/C][/ROW]
[ROW][C]55[/C][C]5610[/C][C]5978.91262488975[/C][C]-368.912624889754[/C][/ROW]
[ROW][C]56[/C][C]5796[/C][C]5749.56423925193[/C][C]46.4357607480651[/C][/ROW]
[ROW][C]57[/C][C]6199[/C][C]5483.27832142343[/C][C]715.721678576568[/C][/ROW]
[ROW][C]58[/C][C]3030[/C][C]3164.5091085043[/C][C]-134.509108504300[/C][/ROW]
[ROW][C]59[/C][C]1930[/C][C]2063.69050781928[/C][C]-133.690507819285[/C][/ROW]
[ROW][C]60[/C][C]2552[/C][C]2362.32709862512[/C][C]189.672901374883[/C][/ROW]
[/TABLE]
Source: https://freestatistics.org/blog/index.php?pk=63501&T=2

Globally Unique Identifier (entire table): ba.freestatistics.org/blog/index.php?pk=63501&T=2

As an alternative you can also use a QR Code:  

The GUIDs for individual cells are displayed in the table below:

Interpolation Forecasts of Exponential Smoothing
tObservedFittedResiduals
1313511325.6731484395625.3268515604386
1422112175.1700760297935.8299239702087
1524532417.3804787052435.619521294755
1630422993.0812069117248.9187930882804
1747654690.891404157474.1085958426038
1849924915.398223226976.6017767730964
1946014548.8044748479152.1955251520876
2062666501.21656954778-235.216569547776
2148124681.78202297392130.217977026077
2231593052.28190202208106.718097977923
2319161901.1872187203314.8127812796731
2422372083.46592721638153.534072783622
2515951390.04234789620204.957652103798
2624532274.74185435041178.258145649585
2722262523.54908394488-297.549083944876
2835973129.2797341701467.720265829899
2947064901.38919535208-195.389195352082
3049745134.54663409665-160.546634096650
3157564732.069731781631023.93026821837
3254936444.07821864397-951.078218643966
3350044948.4327714712955.5672285287146
3432253248.35478283920-23.3547828391957
3520061970.0681102350535.9318897649521
3622912299.97839372023-8.97839372023054
3715881639.79902715819-51.7990271581941
3821052521.73692872997-416.736928729972
3921912288.23071382301-97.2307138230103
4035913697.32506853949-106.325068539491
4146684836.95217044497-168.952170444973
4248855112.08949621537-227.089496215372
4358225915.43073937987-93.4307393798745
4455995644.79574515114-45.795745151142
4553405141.96481026847198.035189731531
4630823313.71234637878-231.712346378783
4720102061.05425348902-51.054253489016
4823012353.73254583912-52.7325458391233
4915141631.38388665256-117.383886652562
5019792162.37760879342-183.377608793421
5124802250.58642769829229.413572301713
5234993688.43999092501-189.439990925013
5346764794.37808067904-118.378080679036
5455855016.95527768273568.044722317265
5556105978.91262488975-368.912624889754
5657965749.5642392519346.4357607480651
5761995483.27832142343715.721678576568
5830303164.5091085043-134.509108504300
5919302063.69050781928-133.690507819285
6025522362.32709862512189.672901374883


Extrapolation Forecasts of Exponential Smoothing
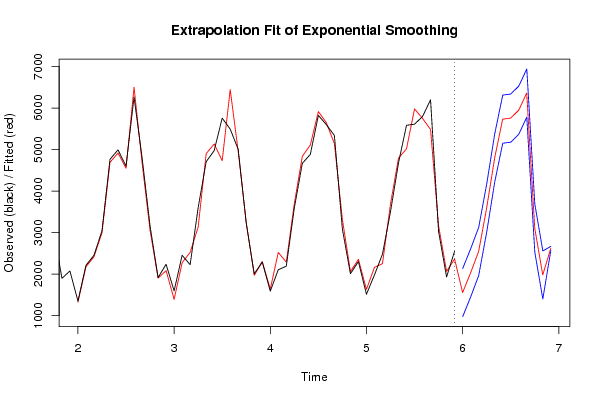
tForecast95% Lower Bound95% Upper Bound
611554.26226134105974.5627144291452133.96180825295
622031.511775621621451.812228709722611.21132253352
632545.660371391681965.960824479783125.35991830359
643591.435427737873011.735880825974171.13497464977
654799.257677077374219.558130165475378.95722398928
665731.895912972635152.196366060736311.59545988453
675757.23075596845177.53120905656336.9303028803
685947.780255753395368.080708841496527.47980266529
696360.980162676355781.280615764456940.67970958825
703109.002015856482529.302468944583688.70156276838
711980.212316090321400.512769178422559.91186300222
722618.251094432432570.327212904932666.17497595992

\begin{tabular}{lllllllll}
\hline
Extrapolation Forecasts of Exponential Smoothing \tabularnewline
t & Forecast & 95% Lower Bound & 95% Upper Bound \tabularnewline
61 & 1554.26226134105 & 974.562714429145 & 2133.96180825295 \tabularnewline
62 & 2031.51177562162 & 1451.81222870972 & 2611.21132253352 \tabularnewline
63 & 2545.66037139168 & 1965.96082447978 & 3125.35991830359 \tabularnewline
64 & 3591.43542773787 & 3011.73588082597 & 4171.13497464977 \tabularnewline
65 & 4799.25767707737 & 4219.55813016547 & 5378.95722398928 \tabularnewline
66 & 5731.89591297263 & 5152.19636606073 & 6311.59545988453 \tabularnewline
67 & 5757.2307559684 & 5177.5312090565 & 6336.9303028803 \tabularnewline
68 & 5947.78025575339 & 5368.08070884149 & 6527.47980266529 \tabularnewline
69 & 6360.98016267635 & 5781.28061576445 & 6940.67970958825 \tabularnewline
70 & 3109.00201585648 & 2529.30246894458 & 3688.70156276838 \tabularnewline
71 & 1980.21231609032 & 1400.51276917842 & 2559.91186300222 \tabularnewline
72 & 2618.25109443243 & 2570.32721290493 & 2666.17497595992 \tabularnewline
\hline
\end{tabular}
%Source: https://freestatistics.org/blog/index.php?pk=63501&T=3

[TABLE]
[ROW][C]Extrapolation Forecasts of Exponential Smoothing[/C][/ROW]
[ROW][C]t[/C][C]Forecast[/C][C]95% Lower Bound[/C][C]95% Upper Bound[/C][/ROW]
[ROW][C]61[/C][C]1554.26226134105[/C][C]974.562714429145[/C][C]2133.96180825295[/C][/ROW]
[ROW][C]62[/C][C]2031.51177562162[/C][C]1451.81222870972[/C][C]2611.21132253352[/C][/ROW]
[ROW][C]63[/C][C]2545.66037139168[/C][C]1965.96082447978[/C][C]3125.35991830359[/C][/ROW]
[ROW][C]64[/C][C]3591.43542773787[/C][C]3011.73588082597[/C][C]4171.13497464977[/C][/ROW]
[ROW][C]65[/C][C]4799.25767707737[/C][C]4219.55813016547[/C][C]5378.95722398928[/C][/ROW]
[ROW][C]66[/C][C]5731.89591297263[/C][C]5152.19636606073[/C][C]6311.59545988453[/C][/ROW]
[ROW][C]67[/C][C]5757.2307559684[/C][C]5177.5312090565[/C][C]6336.9303028803[/C][/ROW]
[ROW][C]68[/C][C]5947.78025575339[/C][C]5368.08070884149[/C][C]6527.47980266529[/C][/ROW]
[ROW][C]69[/C][C]6360.98016267635[/C][C]5781.28061576445[/C][C]6940.67970958825[/C][/ROW]
[ROW][C]70[/C][C]3109.00201585648[/C][C]2529.30246894458[/C][C]3688.70156276838[/C][/ROW]
[ROW][C]71[/C][C]1980.21231609032[/C][C]1400.51276917842[/C][C]2559.91186300222[/C][/ROW]
[ROW][C]72[/C][C]2618.25109443243[/C][C]2570.32721290493[/C][C]2666.17497595992[/C][/ROW]
[/TABLE]
Source: https://freestatistics.org/blog/index.php?pk=63501&T=3

Globally Unique Identifier (entire table): ba.freestatistics.org/blog/index.php?pk=63501&T=3

As an alternative you can also use a QR Code:  

The GUIDs for individual cells are displayed in the table below:

Extrapolation Forecasts of Exponential Smoothing
tForecast95% Lower Bound95% Upper Bound
611554.26226134105974.5627144291452133.96180825295
622031.511775621621451.812228709722611.21132253352
632545.660371391681965.960824479783125.35991830359
643591.435427737873011.735880825974171.13497464977
654799.257677077374219.558130165475378.95722398928
665731.895912972635152.196366060736311.59545988453
675757.23075596845177.53120905656336.9303028803
685947.780255753395368.080708841496527.47980266529
696360.980162676355781.280615764456940.67970958825
703109.002015856482529.302468944583688.70156276838
711980.212316090321400.512769178422559.91186300222
722618.251094432432570.327212904932666.17497595992


Parameters (Session):
par1 = 0.01 ; par2 = 0.99 ; par3 = 0.005 ;
Parameters (R input):
par1 = 12 ; par2 = Triple ; par3 = multiplicative ;
R code (references can be found in the software module):
par1 <- as.numeric(par1)
if (par2 == 'Single') K <- 1
if (par2 == 'Double') K <- 2
if (par2 == 'Triple') K <- par1
nx <- length(x)
nxmK <- nx - K
x <- ts(x, frequency = par1)
if (par2 == 'Single') fit <- HoltWinters(x, gamma=0, beta=0)
if (par2 == 'Double') fit <- HoltWinters(x, gamma=0)
if (par2 == 'Triple') fit <- HoltWinters(x, seasonal=par3)
fit
myresid <- x - fit$fitted[,'xhat']
bitmap(file='test1.png')
op <- par(mfrow=c(2,1))
plot(fit,ylab='Observed (black) / Fitted (red)',main='Interpolation Fit of Exponential Smoothing')
plot(myresid,ylab='Residuals',main='Interpolation Prediction Errors')
par(op)
dev.off()
bitmap(file='test2.png')
p <- predict(fit, par1, prediction.interval=TRUE)
np <- length(p[,1])
plot(fit,p,ylab='Observed (black) / Fitted (red)',main='Extrapolation Fit of Exponential Smoothing')
dev.off()
bitmap(file='test3.png')
op <- par(mfrow = c(2,2))
acf(as.numeric(myresid),lag.max = nx/2,main='Residual ACF')
spectrum(myresid,main='Residals Periodogram')
cpgram(myresid,main='Residal Cumulative Periodogram')
qqnorm(myresid,main='Residual Normal QQ Plot')
qqline(myresid)
par(op)
dev.off()
load(file='createtable')
a<-table.start()
a<-table.row.start(a)
a<-table.element(a,'Estimated Parameters of Exponential Smoothing',2,TRUE)
a<-table.row.end(a)
a<-table.row.start(a)
a<-table.element(a,'Parameter',header=TRUE)
a<-table.element(a,'Value',header=TRUE)
a<-table.row.end(a)
a<-table.row.start(a)
a<-table.element(a,'alpha',header=TRUE)
a<-table.element(a,fit$alpha)
a<-table.row.end(a)
a<-table.row.start(a)
a<-table.element(a,'beta',header=TRUE)
a<-table.element(a,fit$beta)
a<-table.row.end(a)
a<-table.row.start(a)
a<-table.element(a,'gamma',header=TRUE)
a<-table.element(a,fit$gamma)
a<-table.row.end(a)
a<-table.end(a)
table.save(a,file='mytable.tab')
a<-table.start()
a<-table.row.start(a)
a<-table.element(a,'Interpolation Forecasts of Exponential Smoothing',4,TRUE)
a<-table.row.end(a)
a<-table.row.start(a)
a<-table.element(a,'t',header=TRUE)
a<-table.element(a,'Observed',header=TRUE)
a<-table.element(a,'Fitted',header=TRUE)
a<-table.element(a,'Residuals',header=TRUE)
a<-table.row.end(a)
for (i in 1:nxmK) {
a<-table.row.start(a)
a<-table.element(a,i+K,header=TRUE)
a<-table.element(a,x[i+K])
a<-table.element(a,fit$fitted[i,'xhat'])
a<-table.element(a,myresid[i])
a<-table.row.end(a)
}
a<-table.end(a)
table.save(a,file='mytable1.tab')
a<-table.start()
a<-table.row.start(a)
a<-table.element(a,'Extrapolation Forecasts of Exponential Smoothing',4,TRUE)
a<-table.row.end(a)
a<-table.row.start(a)
a<-table.element(a,'t',header=TRUE)
a<-table.element(a,'Forecast',header=TRUE)
a<-table.element(a,'95% Lower Bound',header=TRUE)
a<-table.element(a,'95% Upper Bound',header=TRUE)
a<-table.row.end(a)
for (i in 1:np) {
a<-table.row.start(a)
a<-table.element(a,nx+i,header=TRUE)
a<-table.element(a,p[i,'fit'])
a<-table.element(a,p[i,'lwr'])
a<-table.element(a,p[i,'upr'])
a<-table.row.end(a)
}
a<-table.end(a)
table.save(a,file='mytable2.tab')