Free Statistics

of Irreproducible Research!

Author's title

Author*The author of this computation has been verified*
R Software Modulerwasp_arimabackwardselection.wasp
Title produced by softwareARIMA Backward Selection
Date of computationFri, 04 Dec 2009 10:03:38 -0700
Cite this page as followsStatistical Computations at FreeStatistics.org, Office for Research Development and Education, URL https://freestatistics.org/blog/index.php?v=date/2009/Dec/04/t1259946334kadtdic82eu0q30.htm/, Retrieved Sat, 27 Apr 2024 22:27:55 +0000
Statistical Computations at FreeStatistics.org, Office for Research Development and Education, URL https://freestatistics.org/blog/index.php?pk=63914, Retrieved Sat, 27 Apr 2024 22:27:55 +0000
QR Codes:

Original text written by user:
IsPrivate?No (this computation is public)
User-defined keywords
Estimated Impact126
Family? (F = Feedback message, R = changed R code, M = changed R Module, P = changed Parameters, D = changed Data)
-     [Univariate Explorative Data Analysis] [Run Sequence gebo...] [2008-12-12 13:32:37] [76963dc1903f0f612b6153510a3818cf]
- R  D  [Univariate Explorative Data Analysis] [Run Sequence gebo...] [2008-12-17 12:14:40] [76963dc1903f0f612b6153510a3818cf]
-         [Univariate Explorative Data Analysis] [Run Sequence Plot...] [2008-12-22 18:19:51] [1ce0d16c8f4225c977b42c8fa93bc163]
- RMP       [(Partial) Autocorrelation Function] [Identifying Integ...] [2009-11-22 12:26:39] [b98453cac15ba1066b407e146608df68]
-    D        [(Partial) Autocorrelation Function] [workshop 8] [2009-11-27 08:53:19] [f1a50df816abcbb519e7637ff6b72fa0]
-   PD          [(Partial) Autocorrelation Function] [workshop 9 - 4] [2009-12-04 09:23:46] [f1a50df816abcbb519e7637ff6b72fa0]
-   PD            [(Partial) Autocorrelation Function] [WS9.4] [2009-12-04 16:34:14] [d31db4f83c6a129f6d3e47077769e868]
- RMP                 [ARIMA Backward Selection] [WS9.5] [2009-12-04 17:03:38] [852eae237d08746109043531619a60c9] [Current]
Feedback Forum

Post a new message
Dataseries X:
474605
470390
461251
454724
455626
516847
525192
522975
518585
509239
512238
519164
517009
509933
509127
500875
506971
569323
579714
577992
565644
547344
554788
562325
560854
555332
543599
536662
542722
593530
610763
612613
611324
594167
595454
590865
589379
584428
573100
567456
569028
620735
628884
628232
612117
595404
597141
593408
590072
579799
574205
572775
572942
619567
625809
619916
587625
565724
557274
560576
548854
531673
525919
511038
498662
555362
564591
541667
527070
509846
514258
516922
507561
492622
490243
469357
477580
528379
533590
517945
506174
501866
516441
528222
532638


Summary of computational transaction
Raw Inputview raw input (R code)
Raw Outputview raw output of R engine
Computing time5 seconds
R Server'Gwilym Jenkins' @ 72.249.127.135

\begin{tabular}{lllllllll}
\hline
Summary of computational transaction \tabularnewline
Raw Input & view raw input (R code)  \tabularnewline
Raw Output & view raw output of R engine  \tabularnewline
Computing time & 5 seconds \tabularnewline
R Server & 'Gwilym Jenkins' @ 72.249.127.135 \tabularnewline
\hline
\end{tabular}
%Source: https://freestatistics.org/blog/index.php?pk=63914&T=0

[TABLE]
[ROW][C]Summary of computational transaction[/C][/ROW]
[ROW][C]Raw Input[/C][C]view raw input (R code) [/C][/ROW]
[ROW][C]Raw Output[/C][C]view raw output of R engine [/C][/ROW]
[ROW][C]Computing time[/C][C]5 seconds[/C][/ROW]
[ROW][C]R Server[/C][C]'Gwilym Jenkins' @ 72.249.127.135[/C][/ROW]
[/TABLE]
Source: https://freestatistics.org/blog/index.php?pk=63914&T=0

Globally Unique Identifier (entire table): ba.freestatistics.org/blog/index.php?pk=63914&T=0

As an alternative you can also use a QR Code:  

The GUIDs for individual cells are displayed in the table below:

Summary of computational transaction
Raw Inputview raw input (R code)
Raw Outputview raw output of R engine
Computing time5 seconds
R Server'Gwilym Jenkins' @ 72.249.127.135


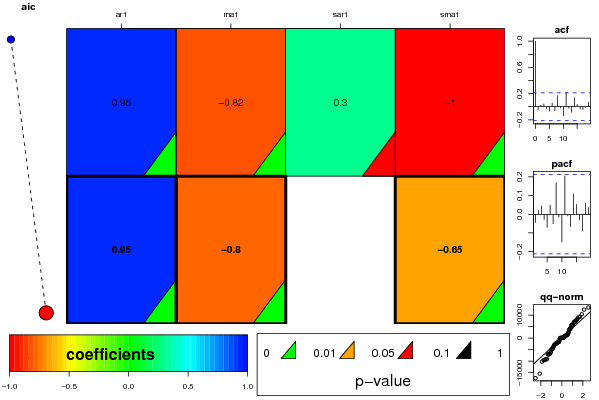
ARIMA Parameter Estimation and Backward Selection
Iterationar1ma1sar1sma1
Estimates ( 1 )0.9519-0.81890.3031-0.9999
(p-val)(0 )(0 )(0.0556 )(6e-04 )
Estimates ( 2 )0.9458-0.79630-0.6511
(p-val)(0 )(0 )(NA )(0.0027 )
Estimates ( 3 )NANANANA
(p-val)(NA )(NA )(NA )(NA )
Estimates ( 4 )NANANANA
(p-val)(NA )(NA )(NA )(NA )
Estimates ( 5 )NANANANA
(p-val)(NA )(NA )(NA )(NA )
Estimates ( 6 )NANANANA
(p-val)(NA )(NA )(NA )(NA )
Estimates ( 7 )NANANANA
(p-val)(NA )(NA )(NA )(NA )

\begin{tabular}{lllllllll}
\hline
ARIMA Parameter Estimation and Backward Selection \tabularnewline
Iteration & ar1 & ma1 & sar1 & sma1 \tabularnewline
Estimates ( 1 ) & 0.9519 & -0.8189 & 0.3031 & -0.9999 \tabularnewline
(p-val) & (0 ) & (0 ) & (0.0556 ) & (6e-04 ) \tabularnewline
Estimates ( 2 ) & 0.9458 & -0.7963 & 0 & -0.6511 \tabularnewline
(p-val) & (0 ) & (0 ) & (NA ) & (0.0027 ) \tabularnewline
Estimates ( 3 ) & NA & NA & NA & NA \tabularnewline
(p-val) & (NA ) & (NA ) & (NA ) & (NA ) \tabularnewline
Estimates ( 4 ) & NA & NA & NA & NA \tabularnewline
(p-val) & (NA ) & (NA ) & (NA ) & (NA ) \tabularnewline
Estimates ( 5 ) & NA & NA & NA & NA \tabularnewline
(p-val) & (NA ) & (NA ) & (NA ) & (NA ) \tabularnewline
Estimates ( 6 ) & NA & NA & NA & NA \tabularnewline
(p-val) & (NA ) & (NA ) & (NA ) & (NA ) \tabularnewline
Estimates ( 7 ) & NA & NA & NA & NA \tabularnewline
(p-val) & (NA ) & (NA ) & (NA ) & (NA ) \tabularnewline
\hline
\end{tabular}
%Source: https://freestatistics.org/blog/index.php?pk=63914&T=1

[TABLE]
[ROW][C]ARIMA Parameter Estimation and Backward Selection[/C][/ROW]
[ROW][C]Iteration[/C][C]ar1[/C][C]ma1[/C][C]sar1[/C][C]sma1[/C][/ROW]
[ROW][C]Estimates ( 1 )[/C][C]0.9519[/C][C]-0.8189[/C][C]0.3031[/C][C]-0.9999[/C][/ROW]
[ROW][C](p-val)[/C][C](0 )[/C][C](0 )[/C][C](0.0556 )[/C][C](6e-04 )[/C][/ROW]
[ROW][C]Estimates ( 2 )[/C][C]0.9458[/C][C]-0.7963[/C][C]0[/C][C]-0.6511[/C][/ROW]
[ROW][C](p-val)[/C][C](0 )[/C][C](0 )[/C][C](NA )[/C][C](0.0027 )[/C][/ROW]
[ROW][C]Estimates ( 3 )[/C][C]NA[/C][C]NA[/C][C]NA[/C][C]NA[/C][/ROW]
[ROW][C](p-val)[/C][C](NA )[/C][C](NA )[/C][C](NA )[/C][C](NA )[/C][/ROW]
[ROW][C]Estimates ( 4 )[/C][C]NA[/C][C]NA[/C][C]NA[/C][C]NA[/C][/ROW]
[ROW][C](p-val)[/C][C](NA )[/C][C](NA )[/C][C](NA )[/C][C](NA )[/C][/ROW]
[ROW][C]Estimates ( 5 )[/C][C]NA[/C][C]NA[/C][C]NA[/C][C]NA[/C][/ROW]
[ROW][C](p-val)[/C][C](NA )[/C][C](NA )[/C][C](NA )[/C][C](NA )[/C][/ROW]
[ROW][C]Estimates ( 6 )[/C][C]NA[/C][C]NA[/C][C]NA[/C][C]NA[/C][/ROW]
[ROW][C](p-val)[/C][C](NA )[/C][C](NA )[/C][C](NA )[/C][C](NA )[/C][/ROW]
[ROW][C]Estimates ( 7 )[/C][C]NA[/C][C]NA[/C][C]NA[/C][C]NA[/C][/ROW]
[ROW][C](p-val)[/C][C](NA )[/C][C](NA )[/C][C](NA )[/C][C](NA )[/C][/ROW]
[/TABLE]
Source: https://freestatistics.org/blog/index.php?pk=63914&T=1

Globally Unique Identifier (entire table): ba.freestatistics.org/blog/index.php?pk=63914&T=1

As an alternative you can also use a QR Code:  

The GUIDs for individual cells are displayed in the table below:

ARIMA Parameter Estimation and Backward Selection
Iterationar1ma1sar1sma1
Estimates ( 1 )0.9519-0.81890.3031-0.9999
(p-val)(0 )(0 )(0.0556 )(6e-04 )
Estimates ( 2 )0.9458-0.79630-0.6511
(p-val)(0 )(0 )(NA )(0.0027 )
Estimates ( 3 )NANANANA
(p-val)(NA )(NA )(NA )(NA )
Estimates ( 4 )NANANANA
(p-val)(NA )(NA )(NA )(NA )
Estimates ( 5 )NANANANA
(p-val)(NA )(NA )(NA )(NA )
Estimates ( 6 )NANANANA
(p-val)(NA )(NA )(NA )(NA )
Estimates ( 7 )NANANANA
(p-val)(NA )(NA )(NA )(NA )


Estimated ARIMA Residuals
Value
-1575.00887827752
-2263.82750005582
7045.75768165492
-2035.83149854133
3886.02985519469
158.539675832947
960.457190377358
-337.841379165606
-7109.61280621946
-7043.92461948593
4685.51755601771
977.408177407792
918.328545859417
589.375354065341
-6891.67878957285
1533.64184150137
2210.55324487903
-9280.29800578057
8034.36112956057
3659.22886246375
7117.41595284467
-2633.18383716224
-4523.01908028135
-10249.2788035485
1517.80356687876
1484.15119995578
-1214.46781890457
2169.24845396691
-2253.92155265332
-2631.74888936717
-3849.26121145593
821.620255775573
-9408.87260464867
1241.88804485160
1179.93724525252
-1962.37832237001
516.653311386494
-2767.97210236296
5629.81911313198
5803.53000967108
-1873.10106680445
-7023.12305076338
-1722.94778568371
-3011.92640473933
-17439.1442995944
-1770.63103827571
-6148.68941133731
7691.62364275427
-4994.18050152824
-4899.69881288656
5524.45031429093
-6451.65580766626
-9155.30558471285
9268.49118895307
4067.36942971564
-15460.4752115729
9214.1160150789
4009.46524142609
8598.3415209042
1171.18094385286
-1585.96191465526
-2329.27119138406
5674.43930504972
-9680.56803374957
13269.3191881056
-4706.51689196404
-3552.85443447458
-3123.75770966460
2912.26032459412
12338.9131048695
10340.0965258702
6543.69991954822
7116.01012281237

\begin{tabular}{lllllllll}
\hline
Estimated ARIMA Residuals \tabularnewline
Value \tabularnewline
-1575.00887827752 \tabularnewline
-2263.82750005582 \tabularnewline
7045.75768165492 \tabularnewline
-2035.83149854133 \tabularnewline
3886.02985519469 \tabularnewline
158.539675832947 \tabularnewline
960.457190377358 \tabularnewline
-337.841379165606 \tabularnewline
-7109.61280621946 \tabularnewline
-7043.92461948593 \tabularnewline
4685.51755601771 \tabularnewline
977.408177407792 \tabularnewline
918.328545859417 \tabularnewline
589.375354065341 \tabularnewline
-6891.67878957285 \tabularnewline
1533.64184150137 \tabularnewline
2210.55324487903 \tabularnewline
-9280.29800578057 \tabularnewline
8034.36112956057 \tabularnewline
3659.22886246375 \tabularnewline
7117.41595284467 \tabularnewline
-2633.18383716224 \tabularnewline
-4523.01908028135 \tabularnewline
-10249.2788035485 \tabularnewline
1517.80356687876 \tabularnewline
1484.15119995578 \tabularnewline
-1214.46781890457 \tabularnewline
2169.24845396691 \tabularnewline
-2253.92155265332 \tabularnewline
-2631.74888936717 \tabularnewline
-3849.26121145593 \tabularnewline
821.620255775573 \tabularnewline
-9408.87260464867 \tabularnewline
1241.88804485160 \tabularnewline
1179.93724525252 \tabularnewline
-1962.37832237001 \tabularnewline
516.653311386494 \tabularnewline
-2767.97210236296 \tabularnewline
5629.81911313198 \tabularnewline
5803.53000967108 \tabularnewline
-1873.10106680445 \tabularnewline
-7023.12305076338 \tabularnewline
-1722.94778568371 \tabularnewline
-3011.92640473933 \tabularnewline
-17439.1442995944 \tabularnewline
-1770.63103827571 \tabularnewline
-6148.68941133731 \tabularnewline
7691.62364275427 \tabularnewline
-4994.18050152824 \tabularnewline
-4899.69881288656 \tabularnewline
5524.45031429093 \tabularnewline
-6451.65580766626 \tabularnewline
-9155.30558471285 \tabularnewline
9268.49118895307 \tabularnewline
4067.36942971564 \tabularnewline
-15460.4752115729 \tabularnewline
9214.1160150789 \tabularnewline
4009.46524142609 \tabularnewline
8598.3415209042 \tabularnewline
1171.18094385286 \tabularnewline
-1585.96191465526 \tabularnewline
-2329.27119138406 \tabularnewline
5674.43930504972 \tabularnewline
-9680.56803374957 \tabularnewline
13269.3191881056 \tabularnewline
-4706.51689196404 \tabularnewline
-3552.85443447458 \tabularnewline
-3123.75770966460 \tabularnewline
2912.26032459412 \tabularnewline
12338.9131048695 \tabularnewline
10340.0965258702 \tabularnewline
6543.69991954822 \tabularnewline
7116.01012281237 \tabularnewline
\hline
\end{tabular}
%Source: https://freestatistics.org/blog/index.php?pk=63914&T=2

[TABLE]
[ROW][C]Estimated ARIMA Residuals[/C][/ROW]
[ROW][C]Value[/C][/ROW]
[ROW][C]-1575.00887827752[/C][/ROW]
[ROW][C]-2263.82750005582[/C][/ROW]
[ROW][C]7045.75768165492[/C][/ROW]
[ROW][C]-2035.83149854133[/C][/ROW]
[ROW][C]3886.02985519469[/C][/ROW]
[ROW][C]158.539675832947[/C][/ROW]
[ROW][C]960.457190377358[/C][/ROW]
[ROW][C]-337.841379165606[/C][/ROW]
[ROW][C]-7109.61280621946[/C][/ROW]
[ROW][C]-7043.92461948593[/C][/ROW]
[ROW][C]4685.51755601771[/C][/ROW]
[ROW][C]977.408177407792[/C][/ROW]
[ROW][C]918.328545859417[/C][/ROW]
[ROW][C]589.375354065341[/C][/ROW]
[ROW][C]-6891.67878957285[/C][/ROW]
[ROW][C]1533.64184150137[/C][/ROW]
[ROW][C]2210.55324487903[/C][/ROW]
[ROW][C]-9280.29800578057[/C][/ROW]
[ROW][C]8034.36112956057[/C][/ROW]
[ROW][C]3659.22886246375[/C][/ROW]
[ROW][C]7117.41595284467[/C][/ROW]
[ROW][C]-2633.18383716224[/C][/ROW]
[ROW][C]-4523.01908028135[/C][/ROW]
[ROW][C]-10249.2788035485[/C][/ROW]
[ROW][C]1517.80356687876[/C][/ROW]
[ROW][C]1484.15119995578[/C][/ROW]
[ROW][C]-1214.46781890457[/C][/ROW]
[ROW][C]2169.24845396691[/C][/ROW]
[ROW][C]-2253.92155265332[/C][/ROW]
[ROW][C]-2631.74888936717[/C][/ROW]
[ROW][C]-3849.26121145593[/C][/ROW]
[ROW][C]821.620255775573[/C][/ROW]
[ROW][C]-9408.87260464867[/C][/ROW]
[ROW][C]1241.88804485160[/C][/ROW]
[ROW][C]1179.93724525252[/C][/ROW]
[ROW][C]-1962.37832237001[/C][/ROW]
[ROW][C]516.653311386494[/C][/ROW]
[ROW][C]-2767.97210236296[/C][/ROW]
[ROW][C]5629.81911313198[/C][/ROW]
[ROW][C]5803.53000967108[/C][/ROW]
[ROW][C]-1873.10106680445[/C][/ROW]
[ROW][C]-7023.12305076338[/C][/ROW]
[ROW][C]-1722.94778568371[/C][/ROW]
[ROW][C]-3011.92640473933[/C][/ROW]
[ROW][C]-17439.1442995944[/C][/ROW]
[ROW][C]-1770.63103827571[/C][/ROW]
[ROW][C]-6148.68941133731[/C][/ROW]
[ROW][C]7691.62364275427[/C][/ROW]
[ROW][C]-4994.18050152824[/C][/ROW]
[ROW][C]-4899.69881288656[/C][/ROW]
[ROW][C]5524.45031429093[/C][/ROW]
[ROW][C]-6451.65580766626[/C][/ROW]
[ROW][C]-9155.30558471285[/C][/ROW]
[ROW][C]9268.49118895307[/C][/ROW]
[ROW][C]4067.36942971564[/C][/ROW]
[ROW][C]-15460.4752115729[/C][/ROW]
[ROW][C]9214.1160150789[/C][/ROW]
[ROW][C]4009.46524142609[/C][/ROW]
[ROW][C]8598.3415209042[/C][/ROW]
[ROW][C]1171.18094385286[/C][/ROW]
[ROW][C]-1585.96191465526[/C][/ROW]
[ROW][C]-2329.27119138406[/C][/ROW]
[ROW][C]5674.43930504972[/C][/ROW]
[ROW][C]-9680.56803374957[/C][/ROW]
[ROW][C]13269.3191881056[/C][/ROW]
[ROW][C]-4706.51689196404[/C][/ROW]
[ROW][C]-3552.85443447458[/C][/ROW]
[ROW][C]-3123.75770966460[/C][/ROW]
[ROW][C]2912.26032459412[/C][/ROW]
[ROW][C]12338.9131048695[/C][/ROW]
[ROW][C]10340.0965258702[/C][/ROW]
[ROW][C]6543.69991954822[/C][/ROW]
[ROW][C]7116.01012281237[/C][/ROW]
[/TABLE]
Source: https://freestatistics.org/blog/index.php?pk=63914&T=2

Globally Unique Identifier (entire table): ba.freestatistics.org/blog/index.php?pk=63914&T=2

As an alternative you can also use a QR Code:  

The GUIDs for individual cells are displayed in the table below:

Estimated ARIMA Residuals
Value
-1575.00887827752
-2263.82750005582
7045.75768165492
-2035.83149854133
3886.02985519469
158.539675832947
960.457190377358
-337.841379165606
-7109.61280621946
-7043.92461948593
4685.51755601771
977.408177407792
918.328545859417
589.375354065341
-6891.67878957285
1533.64184150137
2210.55324487903
-9280.29800578057
8034.36112956057
3659.22886246375
7117.41595284467
-2633.18383716224
-4523.01908028135
-10249.2788035485
1517.80356687876
1484.15119995578
-1214.46781890457
2169.24845396691
-2253.92155265332
-2631.74888936717
-3849.26121145593
821.620255775573
-9408.87260464867
1241.88804485160
1179.93724525252
-1962.37832237001
516.653311386494
-2767.97210236296
5629.81911313198
5803.53000967108
-1873.10106680445
-7023.12305076338
-1722.94778568371
-3011.92640473933
-17439.1442995944
-1770.63103827571
-6148.68941133731
7691.62364275427
-4994.18050152824
-4899.69881288656
5524.45031429093
-6451.65580766626
-9155.30558471285
9268.49118895307
4067.36942971564
-15460.4752115729
9214.1160150789
4009.46524142609
8598.3415209042
1171.18094385286
-1585.96191465526
-2329.27119138406
5674.43930504972
-9680.56803374957
13269.3191881056
-4706.51689196404
-3552.85443447458
-3123.75770966460
2912.26032459412
12338.9131048695
10340.0965258702
6543.69991954822
7116.01012281237


Parameters (Session):
par1 = FALSE ; par2 = 1 ; par3 = 1 ; par4 = 1 ; par5 = 12 ; par6 = 1 ; par7 = 1 ; par8 = 1 ; par9 = 1 ;
Parameters (R input):
par1 = FALSE ; par2 = 1 ; par3 = 1 ; par4 = 1 ; par5 = 12 ; par6 = 1 ; par7 = 1 ; par8 = 1 ; par9 = 1 ;
R code (references can be found in the software module):
library(lattice)
if (par1 == 'TRUE') par1 <- TRUE
if (par1 == 'FALSE') par1 <- FALSE
par2 <- as.numeric(par2) #Box-Cox lambda transformation parameter
par3 <- as.numeric(par3) #degree of non-seasonal differencing
par4 <- as.numeric(par4) #degree of seasonal differencing
par5 <- as.numeric(par5) #seasonal period
par6 <- as.numeric(par6) #degree (p) of the non-seasonal AR(p) polynomial
par7 <- as.numeric(par7) #degree (q) of the non-seasonal MA(q) polynomial
par8 <- as.numeric(par8) #degree (P) of the seasonal AR(P) polynomial
par9 <- as.numeric(par9) #degree (Q) of the seasonal MA(Q) polynomial
armaGR <- function(arima.out, names, n){
try1 <- arima.out$coef
try2 <- sqrt(diag(arima.out$var.coef))
try.data.frame <- data.frame(matrix(NA,ncol=4,nrow=length(names)))
dimnames(try.data.frame) <- list(names,c('coef','std','tstat','pv'))
try.data.frame[,1] <- try1
for(i in 1:length(try2)) try.data.frame[which(rownames(try.data.frame)==names(try2)[i]),2] <- try2[i]
try.data.frame[,3] <- try.data.frame[,1] / try.data.frame[,2]
try.data.frame[,4] <- round((1-pt(abs(try.data.frame[,3]),df=n-(length(try2)+1)))*2,5)
vector <- rep(NA,length(names))
vector[is.na(try.data.frame[,4])] <- 0
maxi <- which.max(try.data.frame[,4])
continue <- max(try.data.frame[,4],na.rm=TRUE) > .05
vector[maxi] <- 0
list(summary=try.data.frame,next.vector=vector,continue=continue)
}
arimaSelect <- function(series, order=c(13,0,0), seasonal=list(order=c(2,0,0),period=12), include.mean=F){
nrc <- order[1]+order[3]+seasonal$order[1]+seasonal$order[3]
coeff <- matrix(NA, nrow=nrc*2, ncol=nrc)
pval <- matrix(NA, nrow=nrc*2, ncol=nrc)
mylist <- rep(list(NULL), nrc)
names <- NULL
if(order[1] > 0) names <- paste('ar',1:order[1],sep='')
if(order[3] > 0) names <- c( names , paste('ma',1:order[3],sep='') )
if(seasonal$order[1] > 0) names <- c(names, paste('sar',1:seasonal$order[1],sep=''))
if(seasonal$order[3] > 0) names <- c(names, paste('sma',1:seasonal$order[3],sep=''))
arima.out <- arima(series, order=order, seasonal=seasonal, include.mean=include.mean, method='ML')
mylist[[1]] <- arima.out
last.arma <- armaGR(arima.out, names, length(series))
mystop <- FALSE
i <- 1
coeff[i,] <- last.arma[[1]][,1]
pval [i,] <- last.arma[[1]][,4]
i <- 2
aic <- arima.out$aic
while(!mystop){
mylist[[i]] <- arima.out
arima.out <- arima(series, order=order, seasonal=seasonal, include.mean=include.mean, method='ML', fixed=last.arma$next.vector)
aic <- c(aic, arima.out$aic)
last.arma <- armaGR(arima.out, names, length(series))
mystop <- !last.arma$continue
coeff[i,] <- last.arma[[1]][,1]
pval [i,] <- last.arma[[1]][,4]
i <- i+1
}
list(coeff, pval, mylist, aic=aic)
}
arimaSelectplot <- function(arimaSelect.out,noms,choix){
noms <- names(arimaSelect.out[[3]][[1]]$coef)
coeff <- arimaSelect.out[[1]]
k <- min(which(is.na(coeff[,1])))-1
coeff <- coeff[1:k,]
pval <- arimaSelect.out[[2]][1:k,]
aic <- arimaSelect.out$aic[1:k]
coeff[coeff==0] <- NA
n <- ncol(coeff)
if(missing(choix)) choix <- k
layout(matrix(c(1,1,1,2,
3,3,3,2,
3,3,3,4,
5,6,7,7),nr=4),
widths=c(10,35,45,15),
heights=c(30,30,15,15))
couleurs <- rainbow(75)[1:50]#(50)
ticks <- pretty(coeff)
par(mar=c(1,1,3,1))
plot(aic,k:1-.5,type='o',pch=21,bg='blue',cex=2,axes=F,lty=2,xpd=NA)
points(aic[choix],k-choix+.5,pch=21,cex=4,bg=2,xpd=NA)
title('aic',line=2)
par(mar=c(3,0,0,0))
plot(0,axes=F,xlab='',ylab='',xlim=range(ticks),ylim=c(.1,1))
rect(xleft = min(ticks) + (0:49)/50*(max(ticks)-min(ticks)),
xright = min(ticks) + (1:50)/50*(max(ticks)-min(ticks)),
ytop = rep(1,50),
ybottom= rep(0,50),col=couleurs,border=NA)
axis(1,ticks)
rect(xleft=min(ticks),xright=max(ticks),ytop=1,ybottom=0)
text(mean(coeff,na.rm=T),.5,'coefficients',cex=2,font=2)
par(mar=c(1,1,3,1))
image(1:n,1:k,t(coeff[k:1,]),axes=F,col=couleurs,zlim=range(ticks))
for(i in 1:n) for(j in 1:k) if(!is.na(coeff[j,i])) {
if(pval[j,i]<.01) symb = 'green'
else if( (pval[j,i]<.05) & (pval[j,i]>=.01)) symb = 'orange'
else if( (pval[j,i]<.1) & (pval[j,i]>=.05)) symb = 'red'
else symb = 'black'
polygon(c(i+.5 ,i+.2 ,i+.5 ,i+.5),
c(k-j+0.5,k-j+0.5,k-j+0.8,k-j+0.5),
col=symb)
if(j==choix) {
rect(xleft=i-.5,
xright=i+.5,
ybottom=k-j+1.5,
ytop=k-j+.5,
lwd=4)
text(i,
k-j+1,
round(coeff[j,i],2),
cex=1.2,
font=2)
}
else{
rect(xleft=i-.5,xright=i+.5,ybottom=k-j+1.5,ytop=k-j+.5)
text(i,k-j+1,round(coeff[j,i],2),cex=1.2,font=1)
}
}
axis(3,1:n,noms)
par(mar=c(0.5,0,0,0.5))
plot(0,axes=F,xlab='',ylab='',type='n',xlim=c(0,8),ylim=c(-.2,.8))
cols <- c('green','orange','red','black')
niv <- c('0','0.01','0.05','0.1')
for(i in 0:3){
polygon(c(1+2*i ,1+2*i ,1+2*i-.5 ,1+2*i),
c(.4 ,.7 , .4 , .4),
col=cols[i+1])
text(2*i,0.5,niv[i+1],cex=1.5)
}
text(8,.5,1,cex=1.5)
text(4,0,'p-value',cex=2)
box()
residus <- arimaSelect.out[[3]][[choix]]$res
par(mar=c(1,2,4,1))
acf(residus,main='')
title('acf',line=.5)
par(mar=c(1,2,4,1))
pacf(residus,main='')
title('pacf',line=.5)
par(mar=c(2,2,4,1))
qqnorm(residus,main='')
title('qq-norm',line=.5)
qqline(residus)
residus
}
if (par2 == 0) x <- log(x)
if (par2 != 0) x <- x^par2
(selection <- arimaSelect(x, order=c(par6,par3,par7), seasonal=list(order=c(par8,par4,par9), period=par5)))
bitmap(file='test1.png')
resid <- arimaSelectplot(selection)
dev.off()
resid
bitmap(file='test2.png')
acf(resid,length(resid)/2, main='Residual Autocorrelation Function')
dev.off()
bitmap(file='test3.png')
pacf(resid,length(resid)/2, main='Residual Partial Autocorrelation Function')
dev.off()
bitmap(file='test4.png')
cpgram(resid, main='Residual Cumulative Periodogram')
dev.off()
bitmap(file='test5.png')
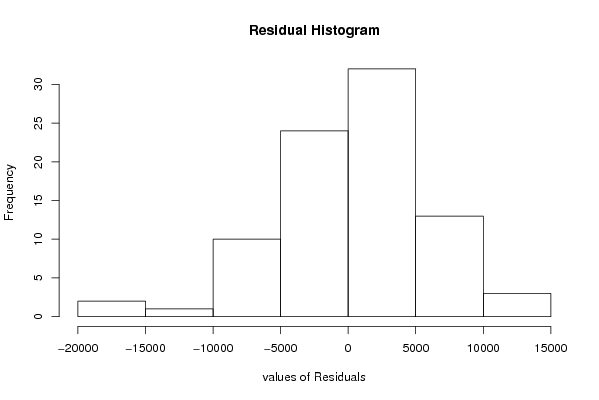
hist(resid, main='Residual Histogram', xlab='values of Residuals')
dev.off()
bitmap(file='test6.png')
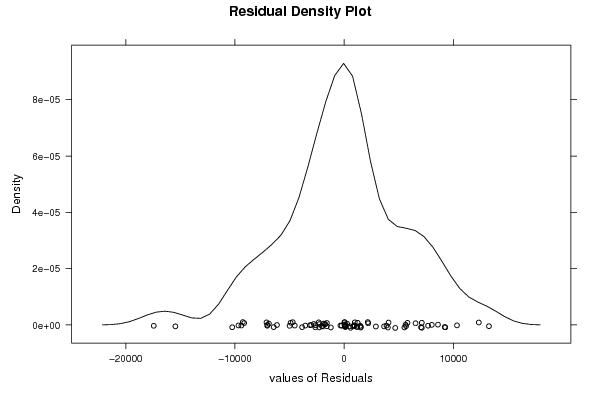
densityplot(~resid,col='black',main='Residual Density Plot', xlab='values of Residuals')
dev.off()
bitmap(file='test7.png')
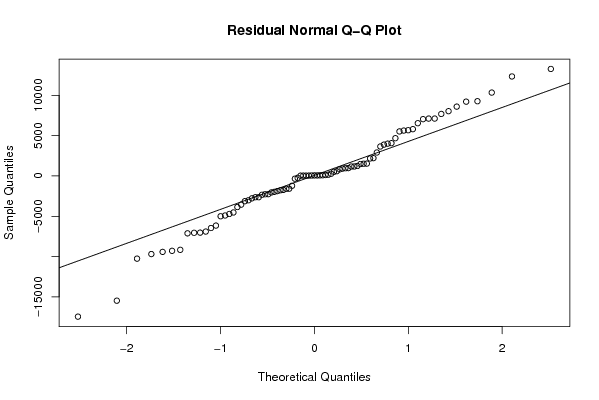
qqnorm(resid, main='Residual Normal Q-Q Plot')
qqline(resid)
dev.off()
ncols <- length(selection[[1]][1,])
nrows <- length(selection[[2]][,1])-1
load(file='createtable')
a<-table.start()
a<-table.row.start(a)
a<-table.element(a,'ARIMA Parameter Estimation and Backward Selection', ncols+1,TRUE)
a<-table.row.end(a)
a<-table.row.start(a)
a<-table.element(a,'Iteration', header=TRUE)
for (i in 1:ncols) {
a<-table.element(a,names(selection[[3]][[1]]$coef)[i],header=TRUE)
}
a<-table.row.end(a)
for (j in 1:nrows) {
a<-table.row.start(a)
mydum <- 'Estimates ('
mydum <- paste(mydum,j)
mydum <- paste(mydum,')')
a<-table.element(a,mydum, header=TRUE)
for (i in 1:ncols) {
a<-table.element(a,round(selection[[1]][j,i],4))
}
a<-table.row.end(a)
a<-table.row.start(a)
a<-table.element(a,'(p-val)', header=TRUE)
for (i in 1:ncols) {
mydum <- '('
mydum <- paste(mydum,round(selection[[2]][j,i],4),sep='')
mydum <- paste(mydum,')')
a<-table.element(a,mydum)
}
a<-table.row.end(a)
}
a<-table.end(a)
table.save(a,file='mytable.tab')
a<-table.start()
a<-table.row.start(a)
a<-table.element(a,'Estimated ARIMA Residuals', 1,TRUE)
a<-table.row.end(a)
a<-table.row.start(a)
a<-table.element(a,'Value', 1,TRUE)
a<-table.row.end(a)
for (i in (par4*par5+par3):length(resid)) {
a<-table.row.start(a)
a<-table.element(a,resid[i])
a<-table.row.end(a)
}
a<-table.end(a)
table.save(a,file='mytable1.tab')