Free Statistics

of Irreproducible Research!

Author's title

Author*The author of this computation has been verified*
R Software Modulerwasp_autocorrelation.wasp
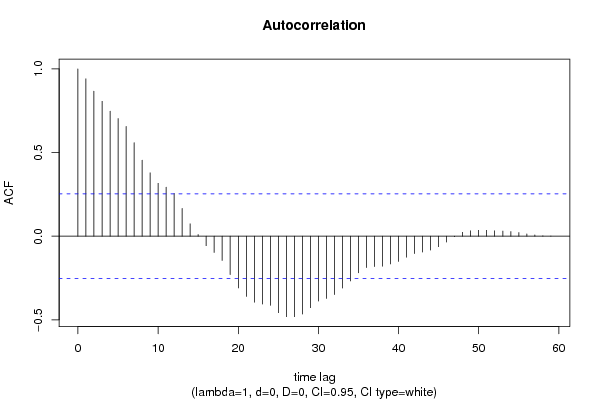
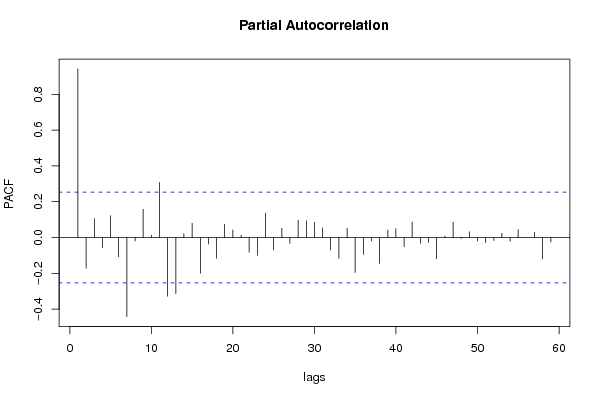
Title produced by software(Partial) Autocorrelation Function
Date of computationFri, 04 Dec 2009 12:00:06 -0700
Cite this page as followsStatistical Computations at FreeStatistics.org, Office for Research Development and Education, URL https://freestatistics.org/blog/index.php?v=date/2009/Dec/04/t1259953275g2qzoydxyy2uawc.htm/, Retrieved Sun, 28 Apr 2024 07:23:50 +0000
Statistical Computations at FreeStatistics.org, Office for Research Development and Education, URL https://freestatistics.org/blog/index.php?pk=64042, Retrieved Sun, 28 Apr 2024 07:23:50 +0000
QR Codes:

Original text written by user:
IsPrivate?No (this computation is public)
User-defined keywords
Estimated Impact111
Family? (F = Feedback message, R = changed R code, M = changed R Module, P = changed Parameters, D = changed Data)
-     [Multiple Regression] [Q1 The Seatbeltlaw] [2007-11-14 19:27:43] [8cd6641b921d30ebe00b648d1481bba0]
- RMPD  [Multiple Regression] [Seatbelt] [2009-11-12 13:54:52] [b98453cac15ba1066b407e146608df68]
-   PD    [Multiple Regression] [W7] [2009-11-18 21:32:41] [315ba876df544ad397193b5931d5f354]
- RMPD      [(Partial) Autocorrelation Function] [] [2009-11-27 13:34:22] [5482608004c1d7bbf873930172393a2d]
-   P           [(Partial) Autocorrelation Function] [ws8: acf verbetering] [2009-12-04 19:00:06] [a315839f8c359622c3a1e6ed387dd5cd] [Current]
Feedback Forum

Post a new message
Dataseries X:
6539
6699
6962
6981
7024
6940
6774
6671
6965
6969
6822
6878
6691
6837
7018
7167
7076
7171
7093
6971
7142
7047
6999
6650
6475
6437
6639
6422
6272
6232
6003
5673
6050
5977
5796
5752
5609
5839
6069
6006
5809
5797
5502
5568
5864
5764
5615
5615
5681
5915
6334
6494
6620
6578
6495
6538
6737
6651
6530
6563


Summary of computational transaction
Raw Inputview raw input (R code)
Raw Outputview raw output of R engine
Computing time1 seconds
R Server'Gwilym Jenkins' @ 72.249.127.135

\begin{tabular}{lllllllll}
\hline
Summary of computational transaction \tabularnewline
Raw Input & view raw input (R code)  \tabularnewline
Raw Output & view raw output of R engine  \tabularnewline
Computing time & 1 seconds \tabularnewline
R Server & 'Gwilym Jenkins' @ 72.249.127.135 \tabularnewline
\hline
\end{tabular}
%Source: https://freestatistics.org/blog/index.php?pk=64042&T=0

[TABLE]
[ROW][C]Summary of computational transaction[/C][/ROW]
[ROW][C]Raw Input[/C][C]view raw input (R code) [/C][/ROW]
[ROW][C]Raw Output[/C][C]view raw output of R engine [/C][/ROW]
[ROW][C]Computing time[/C][C]1 seconds[/C][/ROW]
[ROW][C]R Server[/C][C]'Gwilym Jenkins' @ 72.249.127.135[/C][/ROW]
[/TABLE]
Source: https://freestatistics.org/blog/index.php?pk=64042&T=0

Globally Unique Identifier (entire table): ba.freestatistics.org/blog/index.php?pk=64042&T=0

As an alternative you can also use a QR Code:  

The GUIDs for individual cells are displayed in the table below:

Summary of computational transaction
Raw Inputview raw input (R code)
Raw Outputview raw output of R engine
Computing time1 seconds
R Server'Gwilym Jenkins' @ 72.249.127.135


Autocorrelation Function
Time lag kACF(k)T-STATP-value
10.9414037.29210
20.8668096.71430
30.8062126.24490
40.747435.78960
50.7036245.45020
60.6564375.08472e-06
70.5592284.33182.9e-05
80.4545363.52080.000414
90.3788832.93480.002362
100.3160792.44830.008646
110.2932582.27160.013356
120.2559911.98290.025981
130.1663811.28880.101211
140.0743660.5760.283372
150.0097340.07540.470073
16-0.056243-0.43570.332324
17-0.097273-0.75350.227056
18-0.144576-1.11990.133613
19-0.229479-1.77750.040274
20-0.308855-2.39240.009944
21-0.360183-2.790.003528
22-0.394487-3.05570.001674
23-0.405659-3.14220.001302
24-0.413245-3.2010.001095
25-0.456885-3.5390.000391
26-0.480596-3.72270.000219
27-0.480751-3.72390.000218
28-0.464969-3.60160.000321
29-0.427475-3.31120.000788
30-0.387391-3.00070.00196
31-0.371843-2.88030.002751
32-0.348845-2.70210.004473
33-0.309633-2.39840.009796
34-0.267416-2.07140.021315
35-0.21854-1.69280.04784
36-0.187121-1.44940.076212
37-0.18099-1.40190.083042
38-0.179465-1.39010.084813
39-0.16598-1.28570.101748
40-0.150893-1.16880.123551
41-0.125009-0.96830.168387
42-0.103829-0.80430.212213
43-0.094695-0.73350.233053
44-0.082897-0.64210.261622
45-0.062666-0.48540.314577
46-0.03463-0.26820.394717
47-0.002694-0.02090.49171
480.0236680.18330.427578
490.0320380.24820.402426
500.0354970.2750.392145
510.0354340.27450.392332
520.0324280.25120.401266
530.0307190.23790.406367
540.0282520.21880.413759
550.0217490.16850.433391
560.0137080.10620.457896
570.0075780.05870.476693
580.0028860.02240.491118
590.0008850.00690.497276
60NANANA

\begin{tabular}{lllllllll}
\hline
Autocorrelation Function \tabularnewline
Time lag k & ACF(k) & T-STAT & P-value \tabularnewline
1 & 0.941403 & 7.2921 & 0 \tabularnewline
2 & 0.866809 & 6.7143 & 0 \tabularnewline
3 & 0.806212 & 6.2449 & 0 \tabularnewline
4 & 0.74743 & 5.7896 & 0 \tabularnewline
5 & 0.703624 & 5.4502 & 0 \tabularnewline
6 & 0.656437 & 5.0847 & 2e-06 \tabularnewline
7 & 0.559228 & 4.3318 & 2.9e-05 \tabularnewline
8 & 0.454536 & 3.5208 & 0.000414 \tabularnewline
9 & 0.378883 & 2.9348 & 0.002362 \tabularnewline
10 & 0.316079 & 2.4483 & 0.008646 \tabularnewline
11 & 0.293258 & 2.2716 & 0.013356 \tabularnewline
12 & 0.255991 & 1.9829 & 0.025981 \tabularnewline
13 & 0.166381 & 1.2888 & 0.101211 \tabularnewline
14 & 0.074366 & 0.576 & 0.283372 \tabularnewline
15 & 0.009734 & 0.0754 & 0.470073 \tabularnewline
16 & -0.056243 & -0.4357 & 0.332324 \tabularnewline
17 & -0.097273 & -0.7535 & 0.227056 \tabularnewline
18 & -0.144576 & -1.1199 & 0.133613 \tabularnewline
19 & -0.229479 & -1.7775 & 0.040274 \tabularnewline
20 & -0.308855 & -2.3924 & 0.009944 \tabularnewline
21 & -0.360183 & -2.79 & 0.003528 \tabularnewline
22 & -0.394487 & -3.0557 & 0.001674 \tabularnewline
23 & -0.405659 & -3.1422 & 0.001302 \tabularnewline
24 & -0.413245 & -3.201 & 0.001095 \tabularnewline
25 & -0.456885 & -3.539 & 0.000391 \tabularnewline
26 & -0.480596 & -3.7227 & 0.000219 \tabularnewline
27 & -0.480751 & -3.7239 & 0.000218 \tabularnewline
28 & -0.464969 & -3.6016 & 0.000321 \tabularnewline
29 & -0.427475 & -3.3112 & 0.000788 \tabularnewline
30 & -0.387391 & -3.0007 & 0.00196 \tabularnewline
31 & -0.371843 & -2.8803 & 0.002751 \tabularnewline
32 & -0.348845 & -2.7021 & 0.004473 \tabularnewline
33 & -0.309633 & -2.3984 & 0.009796 \tabularnewline
34 & -0.267416 & -2.0714 & 0.021315 \tabularnewline
35 & -0.21854 & -1.6928 & 0.04784 \tabularnewline
36 & -0.187121 & -1.4494 & 0.076212 \tabularnewline
37 & -0.18099 & -1.4019 & 0.083042 \tabularnewline
38 & -0.179465 & -1.3901 & 0.084813 \tabularnewline
39 & -0.16598 & -1.2857 & 0.101748 \tabularnewline
40 & -0.150893 & -1.1688 & 0.123551 \tabularnewline
41 & -0.125009 & -0.9683 & 0.168387 \tabularnewline
42 & -0.103829 & -0.8043 & 0.212213 \tabularnewline
43 & -0.094695 & -0.7335 & 0.233053 \tabularnewline
44 & -0.082897 & -0.6421 & 0.261622 \tabularnewline
45 & -0.062666 & -0.4854 & 0.314577 \tabularnewline
46 & -0.03463 & -0.2682 & 0.394717 \tabularnewline
47 & -0.002694 & -0.0209 & 0.49171 \tabularnewline
48 & 0.023668 & 0.1833 & 0.427578 \tabularnewline
49 & 0.032038 & 0.2482 & 0.402426 \tabularnewline
50 & 0.035497 & 0.275 & 0.392145 \tabularnewline
51 & 0.035434 & 0.2745 & 0.392332 \tabularnewline
52 & 0.032428 & 0.2512 & 0.401266 \tabularnewline
53 & 0.030719 & 0.2379 & 0.406367 \tabularnewline
54 & 0.028252 & 0.2188 & 0.413759 \tabularnewline
55 & 0.021749 & 0.1685 & 0.433391 \tabularnewline
56 & 0.013708 & 0.1062 & 0.457896 \tabularnewline
57 & 0.007578 & 0.0587 & 0.476693 \tabularnewline
58 & 0.002886 & 0.0224 & 0.491118 \tabularnewline
59 & 0.000885 & 0.0069 & 0.497276 \tabularnewline
60 & NA & NA & NA \tabularnewline
\hline
\end{tabular}
%Source: https://freestatistics.org/blog/index.php?pk=64042&T=1

[TABLE]
[ROW][C]Autocorrelation Function[/C][/ROW]
[ROW][C]Time lag k[/C][C]ACF(k)[/C][C]T-STAT[/C][C]P-value[/C][/ROW]
[ROW][C]1[/C][C]0.941403[/C][C]7.2921[/C][C]0[/C][/ROW]
[ROW][C]2[/C][C]0.866809[/C][C]6.7143[/C][C]0[/C][/ROW]
[ROW][C]3[/C][C]0.806212[/C][C]6.2449[/C][C]0[/C][/ROW]
[ROW][C]4[/C][C]0.74743[/C][C]5.7896[/C][C]0[/C][/ROW]
[ROW][C]5[/C][C]0.703624[/C][C]5.4502[/C][C]0[/C][/ROW]
[ROW][C]6[/C][C]0.656437[/C][C]5.0847[/C][C]2e-06[/C][/ROW]
[ROW][C]7[/C][C]0.559228[/C][C]4.3318[/C][C]2.9e-05[/C][/ROW]
[ROW][C]8[/C][C]0.454536[/C][C]3.5208[/C][C]0.000414[/C][/ROW]
[ROW][C]9[/C][C]0.378883[/C][C]2.9348[/C][C]0.002362[/C][/ROW]
[ROW][C]10[/C][C]0.316079[/C][C]2.4483[/C][C]0.008646[/C][/ROW]
[ROW][C]11[/C][C]0.293258[/C][C]2.2716[/C][C]0.013356[/C][/ROW]
[ROW][C]12[/C][C]0.255991[/C][C]1.9829[/C][C]0.025981[/C][/ROW]
[ROW][C]13[/C][C]0.166381[/C][C]1.2888[/C][C]0.101211[/C][/ROW]
[ROW][C]14[/C][C]0.074366[/C][C]0.576[/C][C]0.283372[/C][/ROW]
[ROW][C]15[/C][C]0.009734[/C][C]0.0754[/C][C]0.470073[/C][/ROW]
[ROW][C]16[/C][C]-0.056243[/C][C]-0.4357[/C][C]0.332324[/C][/ROW]
[ROW][C]17[/C][C]-0.097273[/C][C]-0.7535[/C][C]0.227056[/C][/ROW]
[ROW][C]18[/C][C]-0.144576[/C][C]-1.1199[/C][C]0.133613[/C][/ROW]
[ROW][C]19[/C][C]-0.229479[/C][C]-1.7775[/C][C]0.040274[/C][/ROW]
[ROW][C]20[/C][C]-0.308855[/C][C]-2.3924[/C][C]0.009944[/C][/ROW]
[ROW][C]21[/C][C]-0.360183[/C][C]-2.79[/C][C]0.003528[/C][/ROW]
[ROW][C]22[/C][C]-0.394487[/C][C]-3.0557[/C][C]0.001674[/C][/ROW]
[ROW][C]23[/C][C]-0.405659[/C][C]-3.1422[/C][C]0.001302[/C][/ROW]
[ROW][C]24[/C][C]-0.413245[/C][C]-3.201[/C][C]0.001095[/C][/ROW]
[ROW][C]25[/C][C]-0.456885[/C][C]-3.539[/C][C]0.000391[/C][/ROW]
[ROW][C]26[/C][C]-0.480596[/C][C]-3.7227[/C][C]0.000219[/C][/ROW]
[ROW][C]27[/C][C]-0.480751[/C][C]-3.7239[/C][C]0.000218[/C][/ROW]
[ROW][C]28[/C][C]-0.464969[/C][C]-3.6016[/C][C]0.000321[/C][/ROW]
[ROW][C]29[/C][C]-0.427475[/C][C]-3.3112[/C][C]0.000788[/C][/ROW]
[ROW][C]30[/C][C]-0.387391[/C][C]-3.0007[/C][C]0.00196[/C][/ROW]
[ROW][C]31[/C][C]-0.371843[/C][C]-2.8803[/C][C]0.002751[/C][/ROW]
[ROW][C]32[/C][C]-0.348845[/C][C]-2.7021[/C][C]0.004473[/C][/ROW]
[ROW][C]33[/C][C]-0.309633[/C][C]-2.3984[/C][C]0.009796[/C][/ROW]
[ROW][C]34[/C][C]-0.267416[/C][C]-2.0714[/C][C]0.021315[/C][/ROW]
[ROW][C]35[/C][C]-0.21854[/C][C]-1.6928[/C][C]0.04784[/C][/ROW]
[ROW][C]36[/C][C]-0.187121[/C][C]-1.4494[/C][C]0.076212[/C][/ROW]
[ROW][C]37[/C][C]-0.18099[/C][C]-1.4019[/C][C]0.083042[/C][/ROW]
[ROW][C]38[/C][C]-0.179465[/C][C]-1.3901[/C][C]0.084813[/C][/ROW]
[ROW][C]39[/C][C]-0.16598[/C][C]-1.2857[/C][C]0.101748[/C][/ROW]
[ROW][C]40[/C][C]-0.150893[/C][C]-1.1688[/C][C]0.123551[/C][/ROW]
[ROW][C]41[/C][C]-0.125009[/C][C]-0.9683[/C][C]0.168387[/C][/ROW]
[ROW][C]42[/C][C]-0.103829[/C][C]-0.8043[/C][C]0.212213[/C][/ROW]
[ROW][C]43[/C][C]-0.094695[/C][C]-0.7335[/C][C]0.233053[/C][/ROW]
[ROW][C]44[/C][C]-0.082897[/C][C]-0.6421[/C][C]0.261622[/C][/ROW]
[ROW][C]45[/C][C]-0.062666[/C][C]-0.4854[/C][C]0.314577[/C][/ROW]
[ROW][C]46[/C][C]-0.03463[/C][C]-0.2682[/C][C]0.394717[/C][/ROW]
[ROW][C]47[/C][C]-0.002694[/C][C]-0.0209[/C][C]0.49171[/C][/ROW]
[ROW][C]48[/C][C]0.023668[/C][C]0.1833[/C][C]0.427578[/C][/ROW]
[ROW][C]49[/C][C]0.032038[/C][C]0.2482[/C][C]0.402426[/C][/ROW]
[ROW][C]50[/C][C]0.035497[/C][C]0.275[/C][C]0.392145[/C][/ROW]
[ROW][C]51[/C][C]0.035434[/C][C]0.2745[/C][C]0.392332[/C][/ROW]
[ROW][C]52[/C][C]0.032428[/C][C]0.2512[/C][C]0.401266[/C][/ROW]
[ROW][C]53[/C][C]0.030719[/C][C]0.2379[/C][C]0.406367[/C][/ROW]
[ROW][C]54[/C][C]0.028252[/C][C]0.2188[/C][C]0.413759[/C][/ROW]
[ROW][C]55[/C][C]0.021749[/C][C]0.1685[/C][C]0.433391[/C][/ROW]
[ROW][C]56[/C][C]0.013708[/C][C]0.1062[/C][C]0.457896[/C][/ROW]
[ROW][C]57[/C][C]0.007578[/C][C]0.0587[/C][C]0.476693[/C][/ROW]
[ROW][C]58[/C][C]0.002886[/C][C]0.0224[/C][C]0.491118[/C][/ROW]
[ROW][C]59[/C][C]0.000885[/C][C]0.0069[/C][C]0.497276[/C][/ROW]
[ROW][C]60[/C][C]NA[/C][C]NA[/C][C]NA[/C][/ROW]
[/TABLE]
Source: https://freestatistics.org/blog/index.php?pk=64042&T=1

Globally Unique Identifier (entire table): ba.freestatistics.org/blog/index.php?pk=64042&T=1

As an alternative you can also use a QR Code:  

The GUIDs for individual cells are displayed in the table below:

Autocorrelation Function
Time lag kACF(k)T-STATP-value
10.9414037.29210
20.8668096.71430
30.8062126.24490
40.747435.78960
50.7036245.45020
60.6564375.08472e-06
70.5592284.33182.9e-05
80.4545363.52080.000414
90.3788832.93480.002362
100.3160792.44830.008646
110.2932582.27160.013356
120.2559911.98290.025981
130.1663811.28880.101211
140.0743660.5760.283372
150.0097340.07540.470073
16-0.056243-0.43570.332324
17-0.097273-0.75350.227056
18-0.144576-1.11990.133613
19-0.229479-1.77750.040274
20-0.308855-2.39240.009944
21-0.360183-2.790.003528
22-0.394487-3.05570.001674
23-0.405659-3.14220.001302
24-0.413245-3.2010.001095
25-0.456885-3.5390.000391
26-0.480596-3.72270.000219
27-0.480751-3.72390.000218
28-0.464969-3.60160.000321
29-0.427475-3.31120.000788
30-0.387391-3.00070.00196
31-0.371843-2.88030.002751
32-0.348845-2.70210.004473
33-0.309633-2.39840.009796
34-0.267416-2.07140.021315
35-0.21854-1.69280.04784
36-0.187121-1.44940.076212
37-0.18099-1.40190.083042
38-0.179465-1.39010.084813
39-0.16598-1.28570.101748
40-0.150893-1.16880.123551
41-0.125009-0.96830.168387
42-0.103829-0.80430.212213
43-0.094695-0.73350.233053
44-0.082897-0.64210.261622
45-0.062666-0.48540.314577
46-0.03463-0.26820.394717
47-0.002694-0.02090.49171
480.0236680.18330.427578
490.0320380.24820.402426
500.0354970.2750.392145
510.0354340.27450.392332
520.0324280.25120.401266
530.0307190.23790.406367
540.0282520.21880.413759
550.0217490.16850.433391
560.0137080.10620.457896
570.0075780.05870.476693
580.0028860.02240.491118
590.0008850.00690.497276
60NANANA


Partial Autocorrelation Function
Time lag kPACF(k)T-STATP-value
10.9414037.29210
2-0.170807-1.32310.095416
30.1051530.81450.209287
4-0.056129-0.43480.332644
50.1220050.9450.174213
6-0.106554-0.82540.206218
7-0.441554-3.42030.000565
8-0.018798-0.14560.442361
90.1579961.22380.1129
100.013460.10430.458655
110.3075812.38250.01019
12-0.327009-2.5330.006971
13-0.312743-2.42250.009225
140.0215170.16670.434095
150.0794030.61510.270422
16-0.198673-1.53890.064541
17-0.035834-0.27760.391148
18-0.114865-0.88970.188579
190.0738850.57230.284624
200.0422910.32760.372182
210.0128710.09970.460458
22-0.081413-0.63060.265342
23-0.100074-0.77520.220643
240.1353561.04850.149316
25-0.069478-0.53820.296224
260.0518290.40150.344751
27-0.032736-0.25360.400346
280.0967550.74950.228255
290.0942620.73020.234069
300.0848980.65760.25665
310.0535840.41510.33979
32-0.068973-0.53430.297567
33-0.115902-0.89780.186448
340.0520220.4030.344206
35-0.194408-1.50590.068673
36-0.093204-0.7220.236564
37-0.019076-0.14780.441514
38-0.144328-1.1180.13402
390.0418140.32390.373575
400.0501320.38830.349577
41-0.050215-0.3890.349339
420.0869730.67370.251548
43-0.032681-0.25310.400511
44-0.027806-0.21540.4151
45-0.117603-0.91090.182984
460.0084770.06570.473931
470.0861810.66760.253489
48-0.005588-0.04330.48281
490.0318220.24650.403071
50-0.018562-0.14380.443078
51-0.028477-0.22060.413085
52-0.016401-0.1270.449665
530.0234860.18190.428128
54-0.020319-0.15740.437734
550.0440040.34090.367201
560.001750.01360.494614
570.0291170.22550.411162
58-0.118493-0.91780.181188
59-0.024963-0.19340.423664
60NANANA

\begin{tabular}{lllllllll}
\hline
Partial Autocorrelation Function \tabularnewline
Time lag k & PACF(k) & T-STAT & P-value \tabularnewline
1 & 0.941403 & 7.2921 & 0 \tabularnewline
2 & -0.170807 & -1.3231 & 0.095416 \tabularnewline
3 & 0.105153 & 0.8145 & 0.209287 \tabularnewline
4 & -0.056129 & -0.4348 & 0.332644 \tabularnewline
5 & 0.122005 & 0.945 & 0.174213 \tabularnewline
6 & -0.106554 & -0.8254 & 0.206218 \tabularnewline
7 & -0.441554 & -3.4203 & 0.000565 \tabularnewline
8 & -0.018798 & -0.1456 & 0.442361 \tabularnewline
9 & 0.157996 & 1.2238 & 0.1129 \tabularnewline
10 & 0.01346 & 0.1043 & 0.458655 \tabularnewline
11 & 0.307581 & 2.3825 & 0.01019 \tabularnewline
12 & -0.327009 & -2.533 & 0.006971 \tabularnewline
13 & -0.312743 & -2.4225 & 0.009225 \tabularnewline
14 & 0.021517 & 0.1667 & 0.434095 \tabularnewline
15 & 0.079403 & 0.6151 & 0.270422 \tabularnewline
16 & -0.198673 & -1.5389 & 0.064541 \tabularnewline
17 & -0.035834 & -0.2776 & 0.391148 \tabularnewline
18 & -0.114865 & -0.8897 & 0.188579 \tabularnewline
19 & 0.073885 & 0.5723 & 0.284624 \tabularnewline
20 & 0.042291 & 0.3276 & 0.372182 \tabularnewline
21 & 0.012871 & 0.0997 & 0.460458 \tabularnewline
22 & -0.081413 & -0.6306 & 0.265342 \tabularnewline
23 & -0.100074 & -0.7752 & 0.220643 \tabularnewline
24 & 0.135356 & 1.0485 & 0.149316 \tabularnewline
25 & -0.069478 & -0.5382 & 0.296224 \tabularnewline
26 & 0.051829 & 0.4015 & 0.344751 \tabularnewline
27 & -0.032736 & -0.2536 & 0.400346 \tabularnewline
28 & 0.096755 & 0.7495 & 0.228255 \tabularnewline
29 & 0.094262 & 0.7302 & 0.234069 \tabularnewline
30 & 0.084898 & 0.6576 & 0.25665 \tabularnewline
31 & 0.053584 & 0.4151 & 0.33979 \tabularnewline
32 & -0.068973 & -0.5343 & 0.297567 \tabularnewline
33 & -0.115902 & -0.8978 & 0.186448 \tabularnewline
34 & 0.052022 & 0.403 & 0.344206 \tabularnewline
35 & -0.194408 & -1.5059 & 0.068673 \tabularnewline
36 & -0.093204 & -0.722 & 0.236564 \tabularnewline
37 & -0.019076 & -0.1478 & 0.441514 \tabularnewline
38 & -0.144328 & -1.118 & 0.13402 \tabularnewline
39 & 0.041814 & 0.3239 & 0.373575 \tabularnewline
40 & 0.050132 & 0.3883 & 0.349577 \tabularnewline
41 & -0.050215 & -0.389 & 0.349339 \tabularnewline
42 & 0.086973 & 0.6737 & 0.251548 \tabularnewline
43 & -0.032681 & -0.2531 & 0.400511 \tabularnewline
44 & -0.027806 & -0.2154 & 0.4151 \tabularnewline
45 & -0.117603 & -0.9109 & 0.182984 \tabularnewline
46 & 0.008477 & 0.0657 & 0.473931 \tabularnewline
47 & 0.086181 & 0.6676 & 0.253489 \tabularnewline
48 & -0.005588 & -0.0433 & 0.48281 \tabularnewline
49 & 0.031822 & 0.2465 & 0.403071 \tabularnewline
50 & -0.018562 & -0.1438 & 0.443078 \tabularnewline
51 & -0.028477 & -0.2206 & 0.413085 \tabularnewline
52 & -0.016401 & -0.127 & 0.449665 \tabularnewline
53 & 0.023486 & 0.1819 & 0.428128 \tabularnewline
54 & -0.020319 & -0.1574 & 0.437734 \tabularnewline
55 & 0.044004 & 0.3409 & 0.367201 \tabularnewline
56 & 0.00175 & 0.0136 & 0.494614 \tabularnewline
57 & 0.029117 & 0.2255 & 0.411162 \tabularnewline
58 & -0.118493 & -0.9178 & 0.181188 \tabularnewline
59 & -0.024963 & -0.1934 & 0.423664 \tabularnewline
60 & NA & NA & NA \tabularnewline
\hline
\end{tabular}
%Source: https://freestatistics.org/blog/index.php?pk=64042&T=2

[TABLE]
[ROW][C]Partial Autocorrelation Function[/C][/ROW]
[ROW][C]Time lag k[/C][C]PACF(k)[/C][C]T-STAT[/C][C]P-value[/C][/ROW]
[ROW][C]1[/C][C]0.941403[/C][C]7.2921[/C][C]0[/C][/ROW]
[ROW][C]2[/C][C]-0.170807[/C][C]-1.3231[/C][C]0.095416[/C][/ROW]
[ROW][C]3[/C][C]0.105153[/C][C]0.8145[/C][C]0.209287[/C][/ROW]
[ROW][C]4[/C][C]-0.056129[/C][C]-0.4348[/C][C]0.332644[/C][/ROW]
[ROW][C]5[/C][C]0.122005[/C][C]0.945[/C][C]0.174213[/C][/ROW]
[ROW][C]6[/C][C]-0.106554[/C][C]-0.8254[/C][C]0.206218[/C][/ROW]
[ROW][C]7[/C][C]-0.441554[/C][C]-3.4203[/C][C]0.000565[/C][/ROW]
[ROW][C]8[/C][C]-0.018798[/C][C]-0.1456[/C][C]0.442361[/C][/ROW]
[ROW][C]9[/C][C]0.157996[/C][C]1.2238[/C][C]0.1129[/C][/ROW]
[ROW][C]10[/C][C]0.01346[/C][C]0.1043[/C][C]0.458655[/C][/ROW]
[ROW][C]11[/C][C]0.307581[/C][C]2.3825[/C][C]0.01019[/C][/ROW]
[ROW][C]12[/C][C]-0.327009[/C][C]-2.533[/C][C]0.006971[/C][/ROW]
[ROW][C]13[/C][C]-0.312743[/C][C]-2.4225[/C][C]0.009225[/C][/ROW]
[ROW][C]14[/C][C]0.021517[/C][C]0.1667[/C][C]0.434095[/C][/ROW]
[ROW][C]15[/C][C]0.079403[/C][C]0.6151[/C][C]0.270422[/C][/ROW]
[ROW][C]16[/C][C]-0.198673[/C][C]-1.5389[/C][C]0.064541[/C][/ROW]
[ROW][C]17[/C][C]-0.035834[/C][C]-0.2776[/C][C]0.391148[/C][/ROW]
[ROW][C]18[/C][C]-0.114865[/C][C]-0.8897[/C][C]0.188579[/C][/ROW]
[ROW][C]19[/C][C]0.073885[/C][C]0.5723[/C][C]0.284624[/C][/ROW]
[ROW][C]20[/C][C]0.042291[/C][C]0.3276[/C][C]0.372182[/C][/ROW]
[ROW][C]21[/C][C]0.012871[/C][C]0.0997[/C][C]0.460458[/C][/ROW]
[ROW][C]22[/C][C]-0.081413[/C][C]-0.6306[/C][C]0.265342[/C][/ROW]
[ROW][C]23[/C][C]-0.100074[/C][C]-0.7752[/C][C]0.220643[/C][/ROW]
[ROW][C]24[/C][C]0.135356[/C][C]1.0485[/C][C]0.149316[/C][/ROW]
[ROW][C]25[/C][C]-0.069478[/C][C]-0.5382[/C][C]0.296224[/C][/ROW]
[ROW][C]26[/C][C]0.051829[/C][C]0.4015[/C][C]0.344751[/C][/ROW]
[ROW][C]27[/C][C]-0.032736[/C][C]-0.2536[/C][C]0.400346[/C][/ROW]
[ROW][C]28[/C][C]0.096755[/C][C]0.7495[/C][C]0.228255[/C][/ROW]
[ROW][C]29[/C][C]0.094262[/C][C]0.7302[/C][C]0.234069[/C][/ROW]
[ROW][C]30[/C][C]0.084898[/C][C]0.6576[/C][C]0.25665[/C][/ROW]
[ROW][C]31[/C][C]0.053584[/C][C]0.4151[/C][C]0.33979[/C][/ROW]
[ROW][C]32[/C][C]-0.068973[/C][C]-0.5343[/C][C]0.297567[/C][/ROW]
[ROW][C]33[/C][C]-0.115902[/C][C]-0.8978[/C][C]0.186448[/C][/ROW]
[ROW][C]34[/C][C]0.052022[/C][C]0.403[/C][C]0.344206[/C][/ROW]
[ROW][C]35[/C][C]-0.194408[/C][C]-1.5059[/C][C]0.068673[/C][/ROW]
[ROW][C]36[/C][C]-0.093204[/C][C]-0.722[/C][C]0.236564[/C][/ROW]
[ROW][C]37[/C][C]-0.019076[/C][C]-0.1478[/C][C]0.441514[/C][/ROW]
[ROW][C]38[/C][C]-0.144328[/C][C]-1.118[/C][C]0.13402[/C][/ROW]
[ROW][C]39[/C][C]0.041814[/C][C]0.3239[/C][C]0.373575[/C][/ROW]
[ROW][C]40[/C][C]0.050132[/C][C]0.3883[/C][C]0.349577[/C][/ROW]
[ROW][C]41[/C][C]-0.050215[/C][C]-0.389[/C][C]0.349339[/C][/ROW]
[ROW][C]42[/C][C]0.086973[/C][C]0.6737[/C][C]0.251548[/C][/ROW]
[ROW][C]43[/C][C]-0.032681[/C][C]-0.2531[/C][C]0.400511[/C][/ROW]
[ROW][C]44[/C][C]-0.027806[/C][C]-0.2154[/C][C]0.4151[/C][/ROW]
[ROW][C]45[/C][C]-0.117603[/C][C]-0.9109[/C][C]0.182984[/C][/ROW]
[ROW][C]46[/C][C]0.008477[/C][C]0.0657[/C][C]0.473931[/C][/ROW]
[ROW][C]47[/C][C]0.086181[/C][C]0.6676[/C][C]0.253489[/C][/ROW]
[ROW][C]48[/C][C]-0.005588[/C][C]-0.0433[/C][C]0.48281[/C][/ROW]
[ROW][C]49[/C][C]0.031822[/C][C]0.2465[/C][C]0.403071[/C][/ROW]
[ROW][C]50[/C][C]-0.018562[/C][C]-0.1438[/C][C]0.443078[/C][/ROW]
[ROW][C]51[/C][C]-0.028477[/C][C]-0.2206[/C][C]0.413085[/C][/ROW]
[ROW][C]52[/C][C]-0.016401[/C][C]-0.127[/C][C]0.449665[/C][/ROW]
[ROW][C]53[/C][C]0.023486[/C][C]0.1819[/C][C]0.428128[/C][/ROW]
[ROW][C]54[/C][C]-0.020319[/C][C]-0.1574[/C][C]0.437734[/C][/ROW]
[ROW][C]55[/C][C]0.044004[/C][C]0.3409[/C][C]0.367201[/C][/ROW]
[ROW][C]56[/C][C]0.00175[/C][C]0.0136[/C][C]0.494614[/C][/ROW]
[ROW][C]57[/C][C]0.029117[/C][C]0.2255[/C][C]0.411162[/C][/ROW]
[ROW][C]58[/C][C]-0.118493[/C][C]-0.9178[/C][C]0.181188[/C][/ROW]
[ROW][C]59[/C][C]-0.024963[/C][C]-0.1934[/C][C]0.423664[/C][/ROW]
[ROW][C]60[/C][C]NA[/C][C]NA[/C][C]NA[/C][/ROW]
[/TABLE]
Source: https://freestatistics.org/blog/index.php?pk=64042&T=2

Globally Unique Identifier (entire table): ba.freestatistics.org/blog/index.php?pk=64042&T=2

As an alternative you can also use a QR Code:  

The GUIDs for individual cells are displayed in the table below:

Partial Autocorrelation Function
Time lag kPACF(k)T-STATP-value
10.9414037.29210
2-0.170807-1.32310.095416
30.1051530.81450.209287
4-0.056129-0.43480.332644
50.1220050.9450.174213
6-0.106554-0.82540.206218
7-0.441554-3.42030.000565
8-0.018798-0.14560.442361
90.1579961.22380.1129
100.013460.10430.458655
110.3075812.38250.01019
12-0.327009-2.5330.006971
13-0.312743-2.42250.009225
140.0215170.16670.434095
150.0794030.61510.270422
16-0.198673-1.53890.064541
17-0.035834-0.27760.391148
18-0.114865-0.88970.188579
190.0738850.57230.284624
200.0422910.32760.372182
210.0128710.09970.460458
22-0.081413-0.63060.265342
23-0.100074-0.77520.220643
240.1353561.04850.149316
25-0.069478-0.53820.296224
260.0518290.40150.344751
27-0.032736-0.25360.400346
280.0967550.74950.228255
290.0942620.73020.234069
300.0848980.65760.25665
310.0535840.41510.33979
32-0.068973-0.53430.297567
33-0.115902-0.89780.186448
340.0520220.4030.344206
35-0.194408-1.50590.068673
36-0.093204-0.7220.236564
37-0.019076-0.14780.441514
38-0.144328-1.1180.13402
390.0418140.32390.373575
400.0501320.38830.349577
41-0.050215-0.3890.349339
420.0869730.67370.251548
43-0.032681-0.25310.400511
44-0.027806-0.21540.4151
45-0.117603-0.91090.182984
460.0084770.06570.473931
470.0861810.66760.253489
48-0.005588-0.04330.48281
490.0318220.24650.403071
50-0.018562-0.14380.443078
51-0.028477-0.22060.413085
52-0.016401-0.1270.449665
530.0234860.18190.428128
54-0.020319-0.15740.437734
550.0440040.34090.367201
560.001750.01360.494614
570.0291170.22550.411162
58-0.118493-0.91780.181188
59-0.024963-0.19340.423664
60NANANA


Parameters (Session):
par1 = 60 ; par2 = 1 ; par3 = 0 ; par4 = 0 ; par5 = 12 ; par6 = White Noise ; par7 = 0.95 ;
Parameters (R input):
par1 = 60 ; par2 = 1 ; par3 = 0 ; par4 = 0 ; par5 = 12 ; par6 = White Noise ; par7 = 0.95 ;
R code (references can be found in the software module):
if (par1 == 'Default') {
par1 = 10*log10(length(x))
} else {
par1 <- as.numeric(par1)
}
par2 <- as.numeric(par2)
par3 <- as.numeric(par3)
par4 <- as.numeric(par4)
par5 <- as.numeric(par5)
if (par6 == 'White Noise') par6 <- 'white' else par6 <- 'ma'
par7 <- as.numeric(par7)
if (par2 == 0) {
x <- log(x)
} else {
x <- (x ^ par2 - 1) / par2
}
if (par3 > 0) x <- diff(x,lag=1,difference=par3)
if (par4 > 0) x <- diff(x,lag=par5,difference=par4)
bitmap(file='pic1.png')
racf <- acf(x, par1, main='Autocorrelation', xlab='time lag', ylab='ACF', ci.type=par6, ci=par7, sub=paste('(lambda=',par2,', d=',par3,', D=',par4,', CI=', par7, ', CI type=',par6,')',sep=''))
dev.off()
bitmap(file='pic2.png')
rpacf <- pacf(x,par1,main='Partial Autocorrelation',xlab='lags',ylab='PACF')
dev.off()
(myacf <- c(racf$acf))
(mypacf <- c(rpacf$acf))
lengthx <- length(x)
sqrtn <- sqrt(lengthx)
load(file='createtable')
a<-table.start()
a<-table.row.start(a)
a<-table.element(a,'Autocorrelation Function',4,TRUE)
a<-table.row.end(a)
a<-table.row.start(a)
a<-table.element(a,'Time lag k',header=TRUE)
a<-table.element(a,hyperlink('basics.htm','ACF(k)','click here for more information about the Autocorrelation Function'),header=TRUE)
a<-table.element(a,'T-STAT',header=TRUE)
a<-table.element(a,'P-value',header=TRUE)
a<-table.row.end(a)
for (i in 2:(par1+1)) {
a<-table.row.start(a)
a<-table.element(a,i-1,header=TRUE)
a<-table.element(a,round(myacf[i],6))
mytstat <- myacf[i]*sqrtn
a<-table.element(a,round(mytstat,4))
a<-table.element(a,round(1-pt(abs(mytstat),lengthx),6))
a<-table.row.end(a)
}
a<-table.end(a)
table.save(a,file='mytable.tab')
a<-table.start()
a<-table.row.start(a)
a<-table.element(a,'Partial Autocorrelation Function',4,TRUE)
a<-table.row.end(a)
a<-table.row.start(a)
a<-table.element(a,'Time lag k',header=TRUE)
a<-table.element(a,hyperlink('basics.htm','PACF(k)','click here for more information about the Partial Autocorrelation Function'),header=TRUE)
a<-table.element(a,'T-STAT',header=TRUE)
a<-table.element(a,'P-value',header=TRUE)
a<-table.row.end(a)
for (i in 1:par1) {
a<-table.row.start(a)
a<-table.element(a,i,header=TRUE)
a<-table.element(a,round(mypacf[i],6))
mytstat <- mypacf[i]*sqrtn
a<-table.element(a,round(mytstat,4))
a<-table.element(a,round(1-pt(abs(mytstat),lengthx),6))
a<-table.row.end(a)
}
a<-table.end(a)
table.save(a,file='mytable1.tab')