Free Statistics

of Irreproducible Research!

Author's title

Author*The author of this computation has been verified*
R Software Modulerwasp_autocorrelation.wasp
Title produced by software(Partial) Autocorrelation Function
Date of computationWed, 09 Dec 2009 12:51:41 -0700
Cite this page as followsStatistical Computations at FreeStatistics.org, Office for Research Development and Education, URL https://freestatistics.org/blog/index.php?v=date/2009/Dec/09/t1260388430saaz6z0tqq6226j.htm/, Retrieved Mon, 29 Apr 2024 10:05:28 +0000
Statistical Computations at FreeStatistics.org, Office for Research Development and Education, URL https://freestatistics.org/blog/index.php?pk=65186, Retrieved Mon, 29 Apr 2024 10:05:28 +0000
QR Codes:

Original text written by user:
IsPrivate?No (this computation is public)
User-defined keywords
Estimated Impact96
Family? (F = Feedback message, R = changed R code, M = changed R Module, P = changed Parameters, D = changed Data)
-     [Univariate Explorative Data Analysis] [Run Sequence gebo...] [2008-12-12 13:32:37] [76963dc1903f0f612b6153510a3818cf]
- R  D  [Univariate Explorative Data Analysis] [Run Sequence gebo...] [2008-12-17 12:14:40] [76963dc1903f0f612b6153510a3818cf]
-         [Univariate Explorative Data Analysis] [Run Sequence Plot...] [2008-12-22 18:19:51] [1ce0d16c8f4225c977b42c8fa93bc163]
- RMP       [(Partial) Autocorrelation Function] [Identifying Integ...] [2009-11-22 12:16:10] [b98453cac15ba1066b407e146608df68]
-   PD          [(Partial) Autocorrelation Function] [paper] [2009-12-09 19:51:41] [d447d4b3e35da686436a520338c962fc] [Current]
Feedback Forum

Post a new message
Dataseries X:
595
591
612
595
597
589
584
573
567
569
621
629
628
593
588
566
557
590
580
574
573
573
620
626
620
561
527
510
514
549
532
526
511
499
555
565
542
517
506
502
516
508
493
490
469
478
528
534
518
528
533
536
537
524
536
587
597
581
564
558


Summary of computational transaction
Raw Inputview raw input (R code)
Raw Outputview raw output of R engine
Computing time2 seconds
R Server'Gwilym Jenkins' @ 72.249.127.135

\begin{tabular}{lllllllll}
\hline
Summary of computational transaction \tabularnewline
Raw Input & view raw input (R code)  \tabularnewline
Raw Output & view raw output of R engine  \tabularnewline
Computing time & 2 seconds \tabularnewline
R Server & 'Gwilym Jenkins' @ 72.249.127.135 \tabularnewline
\hline
\end{tabular}
%Source: https://freestatistics.org/blog/index.php?pk=65186&T=0

[TABLE]
[ROW][C]Summary of computational transaction[/C][/ROW]
[ROW][C]Raw Input[/C][C]view raw input (R code) [/C][/ROW]
[ROW][C]Raw Output[/C][C]view raw output of R engine [/C][/ROW]
[ROW][C]Computing time[/C][C]2 seconds[/C][/ROW]
[ROW][C]R Server[/C][C]'Gwilym Jenkins' @ 72.249.127.135[/C][/ROW]
[/TABLE]
Source: https://freestatistics.org/blog/index.php?pk=65186&T=0

Globally Unique Identifier (entire table): ba.freestatistics.org/blog/index.php?pk=65186&T=0

As an alternative you can also use a QR Code:  

The GUIDs for individual cells are displayed in the table below:

Summary of computational transaction
Raw Inputview raw input (R code)
Raw Outputview raw output of R engine
Computing time2 seconds
R Server'Gwilym Jenkins' @ 72.249.127.135


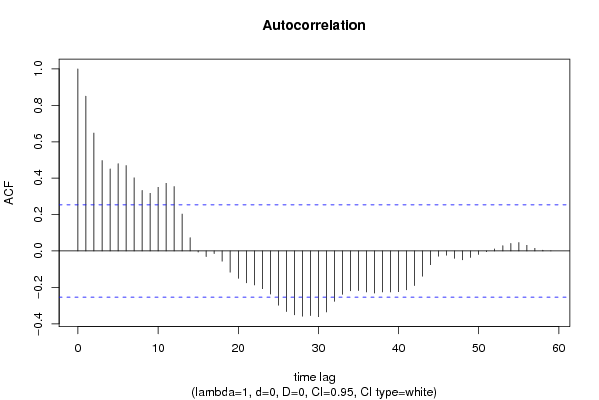
Autocorrelation Function
Time lag kACF(k)T-STATP-value
10.8501746.58540
20.6479685.01912e-06
30.4964223.84530.000147
40.4504183.48890.000457
50.4792413.71220.000226
60.4692163.63450.00029
70.4017133.11170.001424
80.3327242.57730.006217
90.3166792.4530.008546
100.3495352.70750.004409
110.3718932.88070.002748
120.3540862.74270.00401
130.2029841.57230.060569
140.0731040.56630.286665
15-0.006385-0.04950.48036
16-0.030755-0.23820.406259
17-0.014444-0.11190.455645
18-0.055943-0.43330.333164
19-0.116683-0.90380.184852
20-0.150178-1.16330.124662
21-0.17494-1.35510.090236
22-0.186763-1.44670.076598
23-0.207447-1.60690.056666
24-0.236794-1.83420.035792
25-0.298018-2.30840.012219
26-0.332853-2.57830.006201
27-0.351195-2.72030.00426
28-0.358657-2.77810.003643
29-0.354707-2.74750.003959
30-0.361003-2.79630.003467
31-0.335275-2.5970.005905
32-0.276682-2.14320.018082
33-0.238023-1.84370.035082
34-0.218797-1.69480.04765
35-0.217959-1.68830.048272
36-0.225248-1.74480.043073
37-0.23157-1.79370.038948
38-0.225327-1.74540.043019
39-0.225405-1.7460.042967
40-0.223808-1.73360.044062
41-0.213604-1.65460.051617
42-0.190148-1.47290.073005
43-0.138898-1.07590.14314
44-0.07523-0.58270.281131
45-0.028832-0.22330.412018
46-0.023294-0.18040.42871
47-0.040258-0.31180.378122
48-0.049003-0.37960.352799
49-0.035942-0.27840.390829
50-0.019472-0.15080.440308
51-0.004402-0.03410.486457
520.0111010.0860.465881
530.028740.22260.412294
540.0412980.31990.37508
550.0459980.35630.361432
560.0311930.24160.404949
570.0143860.11140.455822
580.0041430.03210.487253
590.0009230.00720.497159
60NANANA

\begin{tabular}{lllllllll}
\hline
Autocorrelation Function \tabularnewline
Time lag k & ACF(k) & T-STAT & P-value \tabularnewline
1 & 0.850174 & 6.5854 & 0 \tabularnewline
2 & 0.647968 & 5.0191 & 2e-06 \tabularnewline
3 & 0.496422 & 3.8453 & 0.000147 \tabularnewline
4 & 0.450418 & 3.4889 & 0.000457 \tabularnewline
5 & 0.479241 & 3.7122 & 0.000226 \tabularnewline
6 & 0.469216 & 3.6345 & 0.00029 \tabularnewline
7 & 0.401713 & 3.1117 & 0.001424 \tabularnewline
8 & 0.332724 & 2.5773 & 0.006217 \tabularnewline
9 & 0.316679 & 2.453 & 0.008546 \tabularnewline
10 & 0.349535 & 2.7075 & 0.004409 \tabularnewline
11 & 0.371893 & 2.8807 & 0.002748 \tabularnewline
12 & 0.354086 & 2.7427 & 0.00401 \tabularnewline
13 & 0.202984 & 1.5723 & 0.060569 \tabularnewline
14 & 0.073104 & 0.5663 & 0.286665 \tabularnewline
15 & -0.006385 & -0.0495 & 0.48036 \tabularnewline
16 & -0.030755 & -0.2382 & 0.406259 \tabularnewline
17 & -0.014444 & -0.1119 & 0.455645 \tabularnewline
18 & -0.055943 & -0.4333 & 0.333164 \tabularnewline
19 & -0.116683 & -0.9038 & 0.184852 \tabularnewline
20 & -0.150178 & -1.1633 & 0.124662 \tabularnewline
21 & -0.17494 & -1.3551 & 0.090236 \tabularnewline
22 & -0.186763 & -1.4467 & 0.076598 \tabularnewline
23 & -0.207447 & -1.6069 & 0.056666 \tabularnewline
24 & -0.236794 & -1.8342 & 0.035792 \tabularnewline
25 & -0.298018 & -2.3084 & 0.012219 \tabularnewline
26 & -0.332853 & -2.5783 & 0.006201 \tabularnewline
27 & -0.351195 & -2.7203 & 0.00426 \tabularnewline
28 & -0.358657 & -2.7781 & 0.003643 \tabularnewline
29 & -0.354707 & -2.7475 & 0.003959 \tabularnewline
30 & -0.361003 & -2.7963 & 0.003467 \tabularnewline
31 & -0.335275 & -2.597 & 0.005905 \tabularnewline
32 & -0.276682 & -2.1432 & 0.018082 \tabularnewline
33 & -0.238023 & -1.8437 & 0.035082 \tabularnewline
34 & -0.218797 & -1.6948 & 0.04765 \tabularnewline
35 & -0.217959 & -1.6883 & 0.048272 \tabularnewline
36 & -0.225248 & -1.7448 & 0.043073 \tabularnewline
37 & -0.23157 & -1.7937 & 0.038948 \tabularnewline
38 & -0.225327 & -1.7454 & 0.043019 \tabularnewline
39 & -0.225405 & -1.746 & 0.042967 \tabularnewline
40 & -0.223808 & -1.7336 & 0.044062 \tabularnewline
41 & -0.213604 & -1.6546 & 0.051617 \tabularnewline
42 & -0.190148 & -1.4729 & 0.073005 \tabularnewline
43 & -0.138898 & -1.0759 & 0.14314 \tabularnewline
44 & -0.07523 & -0.5827 & 0.281131 \tabularnewline
45 & -0.028832 & -0.2233 & 0.412018 \tabularnewline
46 & -0.023294 & -0.1804 & 0.42871 \tabularnewline
47 & -0.040258 & -0.3118 & 0.378122 \tabularnewline
48 & -0.049003 & -0.3796 & 0.352799 \tabularnewline
49 & -0.035942 & -0.2784 & 0.390829 \tabularnewline
50 & -0.019472 & -0.1508 & 0.440308 \tabularnewline
51 & -0.004402 & -0.0341 & 0.486457 \tabularnewline
52 & 0.011101 & 0.086 & 0.465881 \tabularnewline
53 & 0.02874 & 0.2226 & 0.412294 \tabularnewline
54 & 0.041298 & 0.3199 & 0.37508 \tabularnewline
55 & 0.045998 & 0.3563 & 0.361432 \tabularnewline
56 & 0.031193 & 0.2416 & 0.404949 \tabularnewline
57 & 0.014386 & 0.1114 & 0.455822 \tabularnewline
58 & 0.004143 & 0.0321 & 0.487253 \tabularnewline
59 & 0.000923 & 0.0072 & 0.497159 \tabularnewline
60 & NA & NA & NA \tabularnewline
\hline
\end{tabular}
%Source: https://freestatistics.org/blog/index.php?pk=65186&T=1

[TABLE]
[ROW][C]Autocorrelation Function[/C][/ROW]
[ROW][C]Time lag k[/C][C]ACF(k)[/C][C]T-STAT[/C][C]P-value[/C][/ROW]
[ROW][C]1[/C][C]0.850174[/C][C]6.5854[/C][C]0[/C][/ROW]
[ROW][C]2[/C][C]0.647968[/C][C]5.0191[/C][C]2e-06[/C][/ROW]
[ROW][C]3[/C][C]0.496422[/C][C]3.8453[/C][C]0.000147[/C][/ROW]
[ROW][C]4[/C][C]0.450418[/C][C]3.4889[/C][C]0.000457[/C][/ROW]
[ROW][C]5[/C][C]0.479241[/C][C]3.7122[/C][C]0.000226[/C][/ROW]
[ROW][C]6[/C][C]0.469216[/C][C]3.6345[/C][C]0.00029[/C][/ROW]
[ROW][C]7[/C][C]0.401713[/C][C]3.1117[/C][C]0.001424[/C][/ROW]
[ROW][C]8[/C][C]0.332724[/C][C]2.5773[/C][C]0.006217[/C][/ROW]
[ROW][C]9[/C][C]0.316679[/C][C]2.453[/C][C]0.008546[/C][/ROW]
[ROW][C]10[/C][C]0.349535[/C][C]2.7075[/C][C]0.004409[/C][/ROW]
[ROW][C]11[/C][C]0.371893[/C][C]2.8807[/C][C]0.002748[/C][/ROW]
[ROW][C]12[/C][C]0.354086[/C][C]2.7427[/C][C]0.00401[/C][/ROW]
[ROW][C]13[/C][C]0.202984[/C][C]1.5723[/C][C]0.060569[/C][/ROW]
[ROW][C]14[/C][C]0.073104[/C][C]0.5663[/C][C]0.286665[/C][/ROW]
[ROW][C]15[/C][C]-0.006385[/C][C]-0.0495[/C][C]0.48036[/C][/ROW]
[ROW][C]16[/C][C]-0.030755[/C][C]-0.2382[/C][C]0.406259[/C][/ROW]
[ROW][C]17[/C][C]-0.014444[/C][C]-0.1119[/C][C]0.455645[/C][/ROW]
[ROW][C]18[/C][C]-0.055943[/C][C]-0.4333[/C][C]0.333164[/C][/ROW]
[ROW][C]19[/C][C]-0.116683[/C][C]-0.9038[/C][C]0.184852[/C][/ROW]
[ROW][C]20[/C][C]-0.150178[/C][C]-1.1633[/C][C]0.124662[/C][/ROW]
[ROW][C]21[/C][C]-0.17494[/C][C]-1.3551[/C][C]0.090236[/C][/ROW]
[ROW][C]22[/C][C]-0.186763[/C][C]-1.4467[/C][C]0.076598[/C][/ROW]
[ROW][C]23[/C][C]-0.207447[/C][C]-1.6069[/C][C]0.056666[/C][/ROW]
[ROW][C]24[/C][C]-0.236794[/C][C]-1.8342[/C][C]0.035792[/C][/ROW]
[ROW][C]25[/C][C]-0.298018[/C][C]-2.3084[/C][C]0.012219[/C][/ROW]
[ROW][C]26[/C][C]-0.332853[/C][C]-2.5783[/C][C]0.006201[/C][/ROW]
[ROW][C]27[/C][C]-0.351195[/C][C]-2.7203[/C][C]0.00426[/C][/ROW]
[ROW][C]28[/C][C]-0.358657[/C][C]-2.7781[/C][C]0.003643[/C][/ROW]
[ROW][C]29[/C][C]-0.354707[/C][C]-2.7475[/C][C]0.003959[/C][/ROW]
[ROW][C]30[/C][C]-0.361003[/C][C]-2.7963[/C][C]0.003467[/C][/ROW]
[ROW][C]31[/C][C]-0.335275[/C][C]-2.597[/C][C]0.005905[/C][/ROW]
[ROW][C]32[/C][C]-0.276682[/C][C]-2.1432[/C][C]0.018082[/C][/ROW]
[ROW][C]33[/C][C]-0.238023[/C][C]-1.8437[/C][C]0.035082[/C][/ROW]
[ROW][C]34[/C][C]-0.218797[/C][C]-1.6948[/C][C]0.04765[/C][/ROW]
[ROW][C]35[/C][C]-0.217959[/C][C]-1.6883[/C][C]0.048272[/C][/ROW]
[ROW][C]36[/C][C]-0.225248[/C][C]-1.7448[/C][C]0.043073[/C][/ROW]
[ROW][C]37[/C][C]-0.23157[/C][C]-1.7937[/C][C]0.038948[/C][/ROW]
[ROW][C]38[/C][C]-0.225327[/C][C]-1.7454[/C][C]0.043019[/C][/ROW]
[ROW][C]39[/C][C]-0.225405[/C][C]-1.746[/C][C]0.042967[/C][/ROW]
[ROW][C]40[/C][C]-0.223808[/C][C]-1.7336[/C][C]0.044062[/C][/ROW]
[ROW][C]41[/C][C]-0.213604[/C][C]-1.6546[/C][C]0.051617[/C][/ROW]
[ROW][C]42[/C][C]-0.190148[/C][C]-1.4729[/C][C]0.073005[/C][/ROW]
[ROW][C]43[/C][C]-0.138898[/C][C]-1.0759[/C][C]0.14314[/C][/ROW]
[ROW][C]44[/C][C]-0.07523[/C][C]-0.5827[/C][C]0.281131[/C][/ROW]
[ROW][C]45[/C][C]-0.028832[/C][C]-0.2233[/C][C]0.412018[/C][/ROW]
[ROW][C]46[/C][C]-0.023294[/C][C]-0.1804[/C][C]0.42871[/C][/ROW]
[ROW][C]47[/C][C]-0.040258[/C][C]-0.3118[/C][C]0.378122[/C][/ROW]
[ROW][C]48[/C][C]-0.049003[/C][C]-0.3796[/C][C]0.352799[/C][/ROW]
[ROW][C]49[/C][C]-0.035942[/C][C]-0.2784[/C][C]0.390829[/C][/ROW]
[ROW][C]50[/C][C]-0.019472[/C][C]-0.1508[/C][C]0.440308[/C][/ROW]
[ROW][C]51[/C][C]-0.004402[/C][C]-0.0341[/C][C]0.486457[/C][/ROW]
[ROW][C]52[/C][C]0.011101[/C][C]0.086[/C][C]0.465881[/C][/ROW]
[ROW][C]53[/C][C]0.02874[/C][C]0.2226[/C][C]0.412294[/C][/ROW]
[ROW][C]54[/C][C]0.041298[/C][C]0.3199[/C][C]0.37508[/C][/ROW]
[ROW][C]55[/C][C]0.045998[/C][C]0.3563[/C][C]0.361432[/C][/ROW]
[ROW][C]56[/C][C]0.031193[/C][C]0.2416[/C][C]0.404949[/C][/ROW]
[ROW][C]57[/C][C]0.014386[/C][C]0.1114[/C][C]0.455822[/C][/ROW]
[ROW][C]58[/C][C]0.004143[/C][C]0.0321[/C][C]0.487253[/C][/ROW]
[ROW][C]59[/C][C]0.000923[/C][C]0.0072[/C][C]0.497159[/C][/ROW]
[ROW][C]60[/C][C]NA[/C][C]NA[/C][C]NA[/C][/ROW]
[/TABLE]
Source: https://freestatistics.org/blog/index.php?pk=65186&T=1

Globally Unique Identifier (entire table): ba.freestatistics.org/blog/index.php?pk=65186&T=1

As an alternative you can also use a QR Code:  

The GUIDs for individual cells are displayed in the table below:

Autocorrelation Function
Time lag kACF(k)T-STATP-value
10.8501746.58540
20.6479685.01912e-06
30.4964223.84530.000147
40.4504183.48890.000457
50.4792413.71220.000226
60.4692163.63450.00029
70.4017133.11170.001424
80.3327242.57730.006217
90.3166792.4530.008546
100.3495352.70750.004409
110.3718932.88070.002748
120.3540862.74270.00401
130.2029841.57230.060569
140.0731040.56630.286665
15-0.006385-0.04950.48036
16-0.030755-0.23820.406259
17-0.014444-0.11190.455645
18-0.055943-0.43330.333164
19-0.116683-0.90380.184852
20-0.150178-1.16330.124662
21-0.17494-1.35510.090236
22-0.186763-1.44670.076598
23-0.207447-1.60690.056666
24-0.236794-1.83420.035792
25-0.298018-2.30840.012219
26-0.332853-2.57830.006201
27-0.351195-2.72030.00426
28-0.358657-2.77810.003643
29-0.354707-2.74750.003959
30-0.361003-2.79630.003467
31-0.335275-2.5970.005905
32-0.276682-2.14320.018082
33-0.238023-1.84370.035082
34-0.218797-1.69480.04765
35-0.217959-1.68830.048272
36-0.225248-1.74480.043073
37-0.23157-1.79370.038948
38-0.225327-1.74540.043019
39-0.225405-1.7460.042967
40-0.223808-1.73360.044062
41-0.213604-1.65460.051617
42-0.190148-1.47290.073005
43-0.138898-1.07590.14314
44-0.07523-0.58270.281131
45-0.028832-0.22330.412018
46-0.023294-0.18040.42871
47-0.040258-0.31180.378122
48-0.049003-0.37960.352799
49-0.035942-0.27840.390829
50-0.019472-0.15080.440308
51-0.004402-0.03410.486457
520.0111010.0860.465881
530.028740.22260.412294
540.0412980.31990.37508
550.0459980.35630.361432
560.0311930.24160.404949
570.0143860.11140.455822
580.0041430.03210.487253
590.0009230.00720.497159
60NANANA


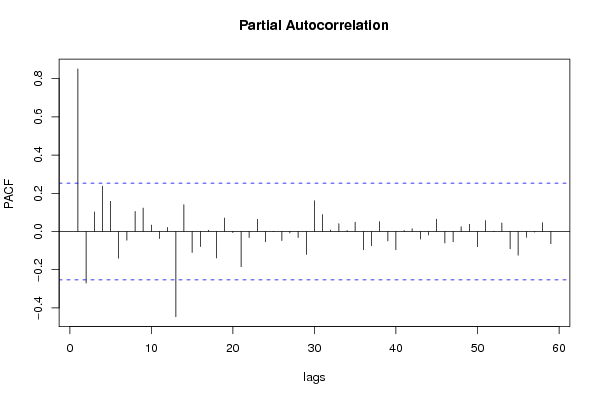
Partial Autocorrelation Function
Time lag kPACF(k)T-STATP-value
10.8501746.58540
2-0.269939-2.09090.020388
30.1024360.79350.215316
40.2367451.83380.035821
50.1574951.21990.113629
6-0.139546-1.08090.14203
7-0.045866-0.35530.361815
80.1048540.81220.209946
90.1222910.94730.173652
100.0335810.26010.397832
11-0.037235-0.28840.387008
120.0211780.1640.435123
13-0.445502-3.45080.000515
140.1402031.0860.14091
15-0.109692-0.84970.199442
16-0.078869-0.61090.271782
170.0067980.05270.47909
18-0.138147-1.07010.144434
190.0700140.54230.294801
20-0.005916-0.04580.4818
21-0.184164-1.42650.07945
22-0.031596-0.24470.403745
230.0639380.49530.311112
24-0.054071-0.41880.338418
25-0.000754-0.00580.497681
26-0.047574-0.36850.356896
27-0.007959-0.06170.475522
28-0.032041-0.24820.402417
29-0.120165-0.93080.177846
300.1609451.24670.108681
310.0887520.68750.247218
320.0077020.05970.476311
330.0405720.31430.377203
340.0048410.03750.485106
350.0484740.37550.354313
36-0.095914-0.74290.230206
37-0.074711-0.57870.282475
380.0509530.39470.34724
39-0.049315-0.3820.351909
40-0.094946-0.73540.232467
410.0045290.03510.486064
420.0147780.11450.454625
43-0.039955-0.30950.379011
44-0.017968-0.13920.444886
450.0643480.49840.309999
46-0.060013-0.46490.321859
47-0.053399-0.41360.340312
480.0253530.19640.422487
490.0378060.29280.385327
50-0.07954-0.61610.270074
510.0567920.43990.330791
520.0013330.01030.495897
530.0448620.34750.364717
54-0.090892-0.7040.242065
55-0.123689-0.95810.170931
56-0.03067-0.23760.406513
57-0.002882-0.02230.491131
580.0461050.35710.361124
59-0.063615-0.49280.311991
60NANANA

\begin{tabular}{lllllllll}
\hline
Partial Autocorrelation Function \tabularnewline
Time lag k & PACF(k) & T-STAT & P-value \tabularnewline
1 & 0.850174 & 6.5854 & 0 \tabularnewline
2 & -0.269939 & -2.0909 & 0.020388 \tabularnewline
3 & 0.102436 & 0.7935 & 0.215316 \tabularnewline
4 & 0.236745 & 1.8338 & 0.035821 \tabularnewline
5 & 0.157495 & 1.2199 & 0.113629 \tabularnewline
6 & -0.139546 & -1.0809 & 0.14203 \tabularnewline
7 & -0.045866 & -0.3553 & 0.361815 \tabularnewline
8 & 0.104854 & 0.8122 & 0.209946 \tabularnewline
9 & 0.122291 & 0.9473 & 0.173652 \tabularnewline
10 & 0.033581 & 0.2601 & 0.397832 \tabularnewline
11 & -0.037235 & -0.2884 & 0.387008 \tabularnewline
12 & 0.021178 & 0.164 & 0.435123 \tabularnewline
13 & -0.445502 & -3.4508 & 0.000515 \tabularnewline
14 & 0.140203 & 1.086 & 0.14091 \tabularnewline
15 & -0.109692 & -0.8497 & 0.199442 \tabularnewline
16 & -0.078869 & -0.6109 & 0.271782 \tabularnewline
17 & 0.006798 & 0.0527 & 0.47909 \tabularnewline
18 & -0.138147 & -1.0701 & 0.144434 \tabularnewline
19 & 0.070014 & 0.5423 & 0.294801 \tabularnewline
20 & -0.005916 & -0.0458 & 0.4818 \tabularnewline
21 & -0.184164 & -1.4265 & 0.07945 \tabularnewline
22 & -0.031596 & -0.2447 & 0.403745 \tabularnewline
23 & 0.063938 & 0.4953 & 0.311112 \tabularnewline
24 & -0.054071 & -0.4188 & 0.338418 \tabularnewline
25 & -0.000754 & -0.0058 & 0.497681 \tabularnewline
26 & -0.047574 & -0.3685 & 0.356896 \tabularnewline
27 & -0.007959 & -0.0617 & 0.475522 \tabularnewline
28 & -0.032041 & -0.2482 & 0.402417 \tabularnewline
29 & -0.120165 & -0.9308 & 0.177846 \tabularnewline
30 & 0.160945 & 1.2467 & 0.108681 \tabularnewline
31 & 0.088752 & 0.6875 & 0.247218 \tabularnewline
32 & 0.007702 & 0.0597 & 0.476311 \tabularnewline
33 & 0.040572 & 0.3143 & 0.377203 \tabularnewline
34 & 0.004841 & 0.0375 & 0.485106 \tabularnewline
35 & 0.048474 & 0.3755 & 0.354313 \tabularnewline
36 & -0.095914 & -0.7429 & 0.230206 \tabularnewline
37 & -0.074711 & -0.5787 & 0.282475 \tabularnewline
38 & 0.050953 & 0.3947 & 0.34724 \tabularnewline
39 & -0.049315 & -0.382 & 0.351909 \tabularnewline
40 & -0.094946 & -0.7354 & 0.232467 \tabularnewline
41 & 0.004529 & 0.0351 & 0.486064 \tabularnewline
42 & 0.014778 & 0.1145 & 0.454625 \tabularnewline
43 & -0.039955 & -0.3095 & 0.379011 \tabularnewline
44 & -0.017968 & -0.1392 & 0.444886 \tabularnewline
45 & 0.064348 & 0.4984 & 0.309999 \tabularnewline
46 & -0.060013 & -0.4649 & 0.321859 \tabularnewline
47 & -0.053399 & -0.4136 & 0.340312 \tabularnewline
48 & 0.025353 & 0.1964 & 0.422487 \tabularnewline
49 & 0.037806 & 0.2928 & 0.385327 \tabularnewline
50 & -0.07954 & -0.6161 & 0.270074 \tabularnewline
51 & 0.056792 & 0.4399 & 0.330791 \tabularnewline
52 & 0.001333 & 0.0103 & 0.495897 \tabularnewline
53 & 0.044862 & 0.3475 & 0.364717 \tabularnewline
54 & -0.090892 & -0.704 & 0.242065 \tabularnewline
55 & -0.123689 & -0.9581 & 0.170931 \tabularnewline
56 & -0.03067 & -0.2376 & 0.406513 \tabularnewline
57 & -0.002882 & -0.0223 & 0.491131 \tabularnewline
58 & 0.046105 & 0.3571 & 0.361124 \tabularnewline
59 & -0.063615 & -0.4928 & 0.311991 \tabularnewline
60 & NA & NA & NA \tabularnewline
\hline
\end{tabular}
%Source: https://freestatistics.org/blog/index.php?pk=65186&T=2

[TABLE]
[ROW][C]Partial Autocorrelation Function[/C][/ROW]
[ROW][C]Time lag k[/C][C]PACF(k)[/C][C]T-STAT[/C][C]P-value[/C][/ROW]
[ROW][C]1[/C][C]0.850174[/C][C]6.5854[/C][C]0[/C][/ROW]
[ROW][C]2[/C][C]-0.269939[/C][C]-2.0909[/C][C]0.020388[/C][/ROW]
[ROW][C]3[/C][C]0.102436[/C][C]0.7935[/C][C]0.215316[/C][/ROW]
[ROW][C]4[/C][C]0.236745[/C][C]1.8338[/C][C]0.035821[/C][/ROW]
[ROW][C]5[/C][C]0.157495[/C][C]1.2199[/C][C]0.113629[/C][/ROW]
[ROW][C]6[/C][C]-0.139546[/C][C]-1.0809[/C][C]0.14203[/C][/ROW]
[ROW][C]7[/C][C]-0.045866[/C][C]-0.3553[/C][C]0.361815[/C][/ROW]
[ROW][C]8[/C][C]0.104854[/C][C]0.8122[/C][C]0.209946[/C][/ROW]
[ROW][C]9[/C][C]0.122291[/C][C]0.9473[/C][C]0.173652[/C][/ROW]
[ROW][C]10[/C][C]0.033581[/C][C]0.2601[/C][C]0.397832[/C][/ROW]
[ROW][C]11[/C][C]-0.037235[/C][C]-0.2884[/C][C]0.387008[/C][/ROW]
[ROW][C]12[/C][C]0.021178[/C][C]0.164[/C][C]0.435123[/C][/ROW]
[ROW][C]13[/C][C]-0.445502[/C][C]-3.4508[/C][C]0.000515[/C][/ROW]
[ROW][C]14[/C][C]0.140203[/C][C]1.086[/C][C]0.14091[/C][/ROW]
[ROW][C]15[/C][C]-0.109692[/C][C]-0.8497[/C][C]0.199442[/C][/ROW]
[ROW][C]16[/C][C]-0.078869[/C][C]-0.6109[/C][C]0.271782[/C][/ROW]
[ROW][C]17[/C][C]0.006798[/C][C]0.0527[/C][C]0.47909[/C][/ROW]
[ROW][C]18[/C][C]-0.138147[/C][C]-1.0701[/C][C]0.144434[/C][/ROW]
[ROW][C]19[/C][C]0.070014[/C][C]0.5423[/C][C]0.294801[/C][/ROW]
[ROW][C]20[/C][C]-0.005916[/C][C]-0.0458[/C][C]0.4818[/C][/ROW]
[ROW][C]21[/C][C]-0.184164[/C][C]-1.4265[/C][C]0.07945[/C][/ROW]
[ROW][C]22[/C][C]-0.031596[/C][C]-0.2447[/C][C]0.403745[/C][/ROW]
[ROW][C]23[/C][C]0.063938[/C][C]0.4953[/C][C]0.311112[/C][/ROW]
[ROW][C]24[/C][C]-0.054071[/C][C]-0.4188[/C][C]0.338418[/C][/ROW]
[ROW][C]25[/C][C]-0.000754[/C][C]-0.0058[/C][C]0.497681[/C][/ROW]
[ROW][C]26[/C][C]-0.047574[/C][C]-0.3685[/C][C]0.356896[/C][/ROW]
[ROW][C]27[/C][C]-0.007959[/C][C]-0.0617[/C][C]0.475522[/C][/ROW]
[ROW][C]28[/C][C]-0.032041[/C][C]-0.2482[/C][C]0.402417[/C][/ROW]
[ROW][C]29[/C][C]-0.120165[/C][C]-0.9308[/C][C]0.177846[/C][/ROW]
[ROW][C]30[/C][C]0.160945[/C][C]1.2467[/C][C]0.108681[/C][/ROW]
[ROW][C]31[/C][C]0.088752[/C][C]0.6875[/C][C]0.247218[/C][/ROW]
[ROW][C]32[/C][C]0.007702[/C][C]0.0597[/C][C]0.476311[/C][/ROW]
[ROW][C]33[/C][C]0.040572[/C][C]0.3143[/C][C]0.377203[/C][/ROW]
[ROW][C]34[/C][C]0.004841[/C][C]0.0375[/C][C]0.485106[/C][/ROW]
[ROW][C]35[/C][C]0.048474[/C][C]0.3755[/C][C]0.354313[/C][/ROW]
[ROW][C]36[/C][C]-0.095914[/C][C]-0.7429[/C][C]0.230206[/C][/ROW]
[ROW][C]37[/C][C]-0.074711[/C][C]-0.5787[/C][C]0.282475[/C][/ROW]
[ROW][C]38[/C][C]0.050953[/C][C]0.3947[/C][C]0.34724[/C][/ROW]
[ROW][C]39[/C][C]-0.049315[/C][C]-0.382[/C][C]0.351909[/C][/ROW]
[ROW][C]40[/C][C]-0.094946[/C][C]-0.7354[/C][C]0.232467[/C][/ROW]
[ROW][C]41[/C][C]0.004529[/C][C]0.0351[/C][C]0.486064[/C][/ROW]
[ROW][C]42[/C][C]0.014778[/C][C]0.1145[/C][C]0.454625[/C][/ROW]
[ROW][C]43[/C][C]-0.039955[/C][C]-0.3095[/C][C]0.379011[/C][/ROW]
[ROW][C]44[/C][C]-0.017968[/C][C]-0.1392[/C][C]0.444886[/C][/ROW]
[ROW][C]45[/C][C]0.064348[/C][C]0.4984[/C][C]0.309999[/C][/ROW]
[ROW][C]46[/C][C]-0.060013[/C][C]-0.4649[/C][C]0.321859[/C][/ROW]
[ROW][C]47[/C][C]-0.053399[/C][C]-0.4136[/C][C]0.340312[/C][/ROW]
[ROW][C]48[/C][C]0.025353[/C][C]0.1964[/C][C]0.422487[/C][/ROW]
[ROW][C]49[/C][C]0.037806[/C][C]0.2928[/C][C]0.385327[/C][/ROW]
[ROW][C]50[/C][C]-0.07954[/C][C]-0.6161[/C][C]0.270074[/C][/ROW]
[ROW][C]51[/C][C]0.056792[/C][C]0.4399[/C][C]0.330791[/C][/ROW]
[ROW][C]52[/C][C]0.001333[/C][C]0.0103[/C][C]0.495897[/C][/ROW]
[ROW][C]53[/C][C]0.044862[/C][C]0.3475[/C][C]0.364717[/C][/ROW]
[ROW][C]54[/C][C]-0.090892[/C][C]-0.704[/C][C]0.242065[/C][/ROW]
[ROW][C]55[/C][C]-0.123689[/C][C]-0.9581[/C][C]0.170931[/C][/ROW]
[ROW][C]56[/C][C]-0.03067[/C][C]-0.2376[/C][C]0.406513[/C][/ROW]
[ROW][C]57[/C][C]-0.002882[/C][C]-0.0223[/C][C]0.491131[/C][/ROW]
[ROW][C]58[/C][C]0.046105[/C][C]0.3571[/C][C]0.361124[/C][/ROW]
[ROW][C]59[/C][C]-0.063615[/C][C]-0.4928[/C][C]0.311991[/C][/ROW]
[ROW][C]60[/C][C]NA[/C][C]NA[/C][C]NA[/C][/ROW]
[/TABLE]
Source: https://freestatistics.org/blog/index.php?pk=65186&T=2

Globally Unique Identifier (entire table): ba.freestatistics.org/blog/index.php?pk=65186&T=2

As an alternative you can also use a QR Code:  

The GUIDs for individual cells are displayed in the table below:

Partial Autocorrelation Function
Time lag kPACF(k)T-STATP-value
10.8501746.58540
2-0.269939-2.09090.020388
30.1024360.79350.215316
40.2367451.83380.035821
50.1574951.21990.113629
6-0.139546-1.08090.14203
7-0.045866-0.35530.361815
80.1048540.81220.209946
90.1222910.94730.173652
100.0335810.26010.397832
11-0.037235-0.28840.387008
120.0211780.1640.435123
13-0.445502-3.45080.000515
140.1402031.0860.14091
15-0.109692-0.84970.199442
16-0.078869-0.61090.271782
170.0067980.05270.47909
18-0.138147-1.07010.144434
190.0700140.54230.294801
20-0.005916-0.04580.4818
21-0.184164-1.42650.07945
22-0.031596-0.24470.403745
230.0639380.49530.311112
24-0.054071-0.41880.338418
25-0.000754-0.00580.497681
26-0.047574-0.36850.356896
27-0.007959-0.06170.475522
28-0.032041-0.24820.402417
29-0.120165-0.93080.177846
300.1609451.24670.108681
310.0887520.68750.247218
320.0077020.05970.476311
330.0405720.31430.377203
340.0048410.03750.485106
350.0484740.37550.354313
36-0.095914-0.74290.230206
37-0.074711-0.57870.282475
380.0509530.39470.34724
39-0.049315-0.3820.351909
40-0.094946-0.73540.232467
410.0045290.03510.486064
420.0147780.11450.454625
43-0.039955-0.30950.379011
44-0.017968-0.13920.444886
450.0643480.49840.309999
46-0.060013-0.46490.321859
47-0.053399-0.41360.340312
480.0253530.19640.422487
490.0378060.29280.385327
50-0.07954-0.61610.270074
510.0567920.43990.330791
520.0013330.01030.495897
530.0448620.34750.364717
54-0.090892-0.7040.242065
55-0.123689-0.95810.170931
56-0.03067-0.23760.406513
57-0.002882-0.02230.491131
580.0461050.35710.361124
59-0.063615-0.49280.311991
60NANANA


Parameters (Session):
par1 = 60 ; par2 = 1 ; par3 = 0 ; par4 = 0 ; par5 = 12 ; par6 = White Noise ; par7 = 0.95 ;
Parameters (R input):
par1 = 60 ; par2 = 1 ; par3 = 0 ; par4 = 0 ; par5 = 12 ; par6 = White Noise ; par7 = 0.95 ;
R code (references can be found in the software module):
if (par1 == 'Default') {
par1 = 10*log10(length(x))
} else {
par1 <- as.numeric(par1)
}
par2 <- as.numeric(par2)
par3 <- as.numeric(par3)
par4 <- as.numeric(par4)
par5 <- as.numeric(par5)
if (par6 == 'White Noise') par6 <- 'white' else par6 <- 'ma'
par7 <- as.numeric(par7)
if (par2 == 0) {
x <- log(x)
} else {
x <- (x ^ par2 - 1) / par2
}
if (par3 > 0) x <- diff(x,lag=1,difference=par3)
if (par4 > 0) x <- diff(x,lag=par5,difference=par4)
bitmap(file='pic1.png')
racf <- acf(x, par1, main='Autocorrelation', xlab='time lag', ylab='ACF', ci.type=par6, ci=par7, sub=paste('(lambda=',par2,', d=',par3,', D=',par4,', CI=', par7, ', CI type=',par6,')',sep=''))
dev.off()
bitmap(file='pic2.png')
rpacf <- pacf(x,par1,main='Partial Autocorrelation',xlab='lags',ylab='PACF')
dev.off()
(myacf <- c(racf$acf))
(mypacf <- c(rpacf$acf))
lengthx <- length(x)
sqrtn <- sqrt(lengthx)
load(file='createtable')
a<-table.start()
a<-table.row.start(a)
a<-table.element(a,'Autocorrelation Function',4,TRUE)
a<-table.row.end(a)
a<-table.row.start(a)
a<-table.element(a,'Time lag k',header=TRUE)
a<-table.element(a,hyperlink('basics.htm','ACF(k)','click here for more information about the Autocorrelation Function'),header=TRUE)
a<-table.element(a,'T-STAT',header=TRUE)
a<-table.element(a,'P-value',header=TRUE)
a<-table.row.end(a)
for (i in 2:(par1+1)) {
a<-table.row.start(a)
a<-table.element(a,i-1,header=TRUE)
a<-table.element(a,round(myacf[i],6))
mytstat <- myacf[i]*sqrtn
a<-table.element(a,round(mytstat,4))
a<-table.element(a,round(1-pt(abs(mytstat),lengthx),6))
a<-table.row.end(a)
}
a<-table.end(a)
table.save(a,file='mytable.tab')
a<-table.start()
a<-table.row.start(a)
a<-table.element(a,'Partial Autocorrelation Function',4,TRUE)
a<-table.row.end(a)
a<-table.row.start(a)
a<-table.element(a,'Time lag k',header=TRUE)
a<-table.element(a,hyperlink('basics.htm','PACF(k)','click here for more information about the Partial Autocorrelation Function'),header=TRUE)
a<-table.element(a,'T-STAT',header=TRUE)
a<-table.element(a,'P-value',header=TRUE)
a<-table.row.end(a)
for (i in 1:par1) {
a<-table.row.start(a)
a<-table.element(a,i,header=TRUE)
a<-table.element(a,round(mypacf[i],6))
mytstat <- mypacf[i]*sqrtn
a<-table.element(a,round(mytstat,4))
a<-table.element(a,round(1-pt(abs(mytstat),lengthx),6))
a<-table.row.end(a)
}
a<-table.end(a)
table.save(a,file='mytable1.tab')