Free Statistics

of Irreproducible Research!

Author's title

Author*The author of this computation has been verified*
R Software Modulerwasp_autocorrelation.wasp
Title produced by software(Partial) Autocorrelation Function
Date of computationWed, 09 Dec 2009 12:58:12 -0700
Cite this page as followsStatistical Computations at FreeStatistics.org, Office for Research Development and Education, URL https://freestatistics.org/blog/index.php?v=date/2009/Dec/09/t1260388748pnmd8lh4x6tq1t1.htm/, Retrieved Mon, 29 Apr 2024 15:17:30 +0000
Statistical Computations at FreeStatistics.org, Office for Research Development and Education, URL https://freestatistics.org/blog/index.php?pk=65189, Retrieved Mon, 29 Apr 2024 15:17:30 +0000
QR Codes:

Original text written by user:
IsPrivate?No (this computation is public)
User-defined keywords
Estimated Impact92
Family? (F = Feedback message, R = changed R code, M = changed R Module, P = changed Parameters, D = changed Data)
-     [Univariate Explorative Data Analysis] [Run Sequence gebo...] [2008-12-12 13:32:37] [76963dc1903f0f612b6153510a3818cf]
- R  D  [Univariate Explorative Data Analysis] [Run Sequence gebo...] [2008-12-17 12:14:40] [76963dc1903f0f612b6153510a3818cf]
-         [Univariate Explorative Data Analysis] [Run Sequence Plot...] [2008-12-22 18:19:51] [1ce0d16c8f4225c977b42c8fa93bc163]
- RMP       [(Partial) Autocorrelation Function] [Identifying Integ...] [2009-11-22 12:16:10] [b98453cac15ba1066b407e146608df68]
-   PD          [(Partial) Autocorrelation Function] [paper] [2009-12-09 19:58:12] [d447d4b3e35da686436a520338c962fc] [Current]
Feedback Forum

Post a new message
Dataseries X:
595
591
612
595
597
589
584
573
567
569
621
629
628
593
588
566
557
590
580
574
573
573
620
626
620
561
527
510
514
549
532
526
511
499
555
565
542
517
506
502
516
508
493
490
469
478
528
534
518
528
533
536
537
524
536
587
597
581
564
558


Summary of computational transaction
Raw Inputview raw input (R code)
Raw Outputview raw output of R engine
Computing time1 seconds
R Server'Gwilym Jenkins' @ 72.249.127.135

\begin{tabular}{lllllllll}
\hline
Summary of computational transaction \tabularnewline
Raw Input & view raw input (R code)  \tabularnewline
Raw Output & view raw output of R engine  \tabularnewline
Computing time & 1 seconds \tabularnewline
R Server & 'Gwilym Jenkins' @ 72.249.127.135 \tabularnewline
\hline
\end{tabular}
%Source: https://freestatistics.org/blog/index.php?pk=65189&T=0

[TABLE]
[ROW][C]Summary of computational transaction[/C][/ROW]
[ROW][C]Raw Input[/C][C]view raw input (R code) [/C][/ROW]
[ROW][C]Raw Output[/C][C]view raw output of R engine [/C][/ROW]
[ROW][C]Computing time[/C][C]1 seconds[/C][/ROW]
[ROW][C]R Server[/C][C]'Gwilym Jenkins' @ 72.249.127.135[/C][/ROW]
[/TABLE]
Source: https://freestatistics.org/blog/index.php?pk=65189&T=0

Globally Unique Identifier (entire table): ba.freestatistics.org/blog/index.php?pk=65189&T=0

As an alternative you can also use a QR Code:  

The GUIDs for individual cells are displayed in the table below:

Summary of computational transaction
Raw Inputview raw input (R code)
Raw Outputview raw output of R engine
Computing time1 seconds
R Server'Gwilym Jenkins' @ 72.249.127.135


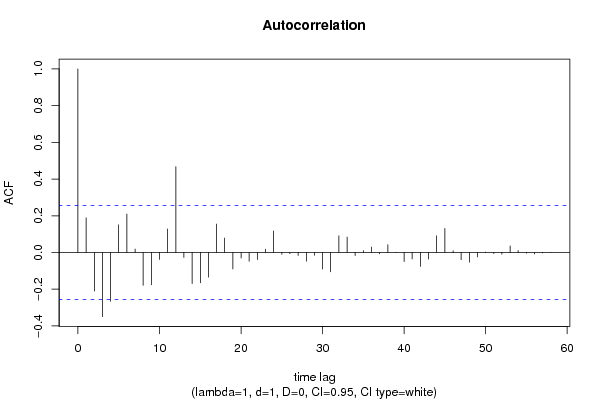
Autocorrelation Function
Time lag kACF(k)T-STATP-value
10.1891371.45280.07579
2-0.210198-1.61460.055871
3-0.349468-2.68430.00471
4-0.266018-2.04330.022747
50.1511331.16090.125184
60.209191.60680.056717
70.0187070.14370.443118
8-0.178918-1.37430.087274
9-0.175865-1.35080.090952
10-0.037839-0.29060.386171
110.1285310.98730.163773
120.4676513.59210.000335
13-0.026787-0.20580.418845
14-0.169126-1.29910.099484
15-0.165027-1.26760.104961
16-0.134219-1.0310.153384
170.1547661.18880.119645
180.0787590.6050.273762
19-0.089836-0.690.246437
20-0.030092-0.23110.409002
21-0.047735-0.36670.357593
22-0.038303-0.29420.384815
230.0178350.1370.44575
240.1173140.90110.185597
25-0.009809-0.07530.470097
26-0.006744-0.05180.479431
27-0.015825-0.12160.451834
28-0.047206-0.36260.3591
29-0.014327-0.110.456373
30-0.090454-0.69480.244958
31-0.105227-0.80830.211092
320.0911910.70050.243199
330.0841110.64610.26037
34-0.01699-0.13050.448307
350.0104570.08030.468127
360.0297750.22870.409944
37-0.006893-0.05290.478977
380.0425830.32710.372379
390.0007570.00580.497691
40-0.049345-0.3790.353014
41-0.034935-0.26830.394686
42-0.076149-0.58490.28042
43-0.035933-0.2760.391754
440.0911820.70040.243221
450.1313961.00930.158482
460.009490.07290.471067
47-0.038849-0.29840.383221
48-0.052664-0.40450.343646
49-0.024003-0.18440.427176
500.0023190.01780.492925
51-0.005595-0.0430.482934
52-0.009355-0.07190.47148
530.0358570.27540.391976
540.010860.08340.466902
55-0.004085-0.03140.487537
56-0.007654-0.05880.476657
57-0.002178-0.01670.493354
580.0006470.0050.498025
59NANANA
60NANANA

\begin{tabular}{lllllllll}
\hline
Autocorrelation Function \tabularnewline
Time lag k & ACF(k) & T-STAT & P-value \tabularnewline
1 & 0.189137 & 1.4528 & 0.07579 \tabularnewline
2 & -0.210198 & -1.6146 & 0.055871 \tabularnewline
3 & -0.349468 & -2.6843 & 0.00471 \tabularnewline
4 & -0.266018 & -2.0433 & 0.022747 \tabularnewline
5 & 0.151133 & 1.1609 & 0.125184 \tabularnewline
6 & 0.20919 & 1.6068 & 0.056717 \tabularnewline
7 & 0.018707 & 0.1437 & 0.443118 \tabularnewline
8 & -0.178918 & -1.3743 & 0.087274 \tabularnewline
9 & -0.175865 & -1.3508 & 0.090952 \tabularnewline
10 & -0.037839 & -0.2906 & 0.386171 \tabularnewline
11 & 0.128531 & 0.9873 & 0.163773 \tabularnewline
12 & 0.467651 & 3.5921 & 0.000335 \tabularnewline
13 & -0.026787 & -0.2058 & 0.418845 \tabularnewline
14 & -0.169126 & -1.2991 & 0.099484 \tabularnewline
15 & -0.165027 & -1.2676 & 0.104961 \tabularnewline
16 & -0.134219 & -1.031 & 0.153384 \tabularnewline
17 & 0.154766 & 1.1888 & 0.119645 \tabularnewline
18 & 0.078759 & 0.605 & 0.273762 \tabularnewline
19 & -0.089836 & -0.69 & 0.246437 \tabularnewline
20 & -0.030092 & -0.2311 & 0.409002 \tabularnewline
21 & -0.047735 & -0.3667 & 0.357593 \tabularnewline
22 & -0.038303 & -0.2942 & 0.384815 \tabularnewline
23 & 0.017835 & 0.137 & 0.44575 \tabularnewline
24 & 0.117314 & 0.9011 & 0.185597 \tabularnewline
25 & -0.009809 & -0.0753 & 0.470097 \tabularnewline
26 & -0.006744 & -0.0518 & 0.479431 \tabularnewline
27 & -0.015825 & -0.1216 & 0.451834 \tabularnewline
28 & -0.047206 & -0.3626 & 0.3591 \tabularnewline
29 & -0.014327 & -0.11 & 0.456373 \tabularnewline
30 & -0.090454 & -0.6948 & 0.244958 \tabularnewline
31 & -0.105227 & -0.8083 & 0.211092 \tabularnewline
32 & 0.091191 & 0.7005 & 0.243199 \tabularnewline
33 & 0.084111 & 0.6461 & 0.26037 \tabularnewline
34 & -0.01699 & -0.1305 & 0.448307 \tabularnewline
35 & 0.010457 & 0.0803 & 0.468127 \tabularnewline
36 & 0.029775 & 0.2287 & 0.409944 \tabularnewline
37 & -0.006893 & -0.0529 & 0.478977 \tabularnewline
38 & 0.042583 & 0.3271 & 0.372379 \tabularnewline
39 & 0.000757 & 0.0058 & 0.497691 \tabularnewline
40 & -0.049345 & -0.379 & 0.353014 \tabularnewline
41 & -0.034935 & -0.2683 & 0.394686 \tabularnewline
42 & -0.076149 & -0.5849 & 0.28042 \tabularnewline
43 & -0.035933 & -0.276 & 0.391754 \tabularnewline
44 & 0.091182 & 0.7004 & 0.243221 \tabularnewline
45 & 0.131396 & 1.0093 & 0.158482 \tabularnewline
46 & 0.00949 & 0.0729 & 0.471067 \tabularnewline
47 & -0.038849 & -0.2984 & 0.383221 \tabularnewline
48 & -0.052664 & -0.4045 & 0.343646 \tabularnewline
49 & -0.024003 & -0.1844 & 0.427176 \tabularnewline
50 & 0.002319 & 0.0178 & 0.492925 \tabularnewline
51 & -0.005595 & -0.043 & 0.482934 \tabularnewline
52 & -0.009355 & -0.0719 & 0.47148 \tabularnewline
53 & 0.035857 & 0.2754 & 0.391976 \tabularnewline
54 & 0.01086 & 0.0834 & 0.466902 \tabularnewline
55 & -0.004085 & -0.0314 & 0.487537 \tabularnewline
56 & -0.007654 & -0.0588 & 0.476657 \tabularnewline
57 & -0.002178 & -0.0167 & 0.493354 \tabularnewline
58 & 0.000647 & 0.005 & 0.498025 \tabularnewline
59 & NA & NA & NA \tabularnewline
60 & NA & NA & NA \tabularnewline
\hline
\end{tabular}
%Source: https://freestatistics.org/blog/index.php?pk=65189&T=1

[TABLE]
[ROW][C]Autocorrelation Function[/C][/ROW]
[ROW][C]Time lag k[/C][C]ACF(k)[/C][C]T-STAT[/C][C]P-value[/C][/ROW]
[ROW][C]1[/C][C]0.189137[/C][C]1.4528[/C][C]0.07579[/C][/ROW]
[ROW][C]2[/C][C]-0.210198[/C][C]-1.6146[/C][C]0.055871[/C][/ROW]
[ROW][C]3[/C][C]-0.349468[/C][C]-2.6843[/C][C]0.00471[/C][/ROW]
[ROW][C]4[/C][C]-0.266018[/C][C]-2.0433[/C][C]0.022747[/C][/ROW]
[ROW][C]5[/C][C]0.151133[/C][C]1.1609[/C][C]0.125184[/C][/ROW]
[ROW][C]6[/C][C]0.20919[/C][C]1.6068[/C][C]0.056717[/C][/ROW]
[ROW][C]7[/C][C]0.018707[/C][C]0.1437[/C][C]0.443118[/C][/ROW]
[ROW][C]8[/C][C]-0.178918[/C][C]-1.3743[/C][C]0.087274[/C][/ROW]
[ROW][C]9[/C][C]-0.175865[/C][C]-1.3508[/C][C]0.090952[/C][/ROW]
[ROW][C]10[/C][C]-0.037839[/C][C]-0.2906[/C][C]0.386171[/C][/ROW]
[ROW][C]11[/C][C]0.128531[/C][C]0.9873[/C][C]0.163773[/C][/ROW]
[ROW][C]12[/C][C]0.467651[/C][C]3.5921[/C][C]0.000335[/C][/ROW]
[ROW][C]13[/C][C]-0.026787[/C][C]-0.2058[/C][C]0.418845[/C][/ROW]
[ROW][C]14[/C][C]-0.169126[/C][C]-1.2991[/C][C]0.099484[/C][/ROW]
[ROW][C]15[/C][C]-0.165027[/C][C]-1.2676[/C][C]0.104961[/C][/ROW]
[ROW][C]16[/C][C]-0.134219[/C][C]-1.031[/C][C]0.153384[/C][/ROW]
[ROW][C]17[/C][C]0.154766[/C][C]1.1888[/C][C]0.119645[/C][/ROW]
[ROW][C]18[/C][C]0.078759[/C][C]0.605[/C][C]0.273762[/C][/ROW]
[ROW][C]19[/C][C]-0.089836[/C][C]-0.69[/C][C]0.246437[/C][/ROW]
[ROW][C]20[/C][C]-0.030092[/C][C]-0.2311[/C][C]0.409002[/C][/ROW]
[ROW][C]21[/C][C]-0.047735[/C][C]-0.3667[/C][C]0.357593[/C][/ROW]
[ROW][C]22[/C][C]-0.038303[/C][C]-0.2942[/C][C]0.384815[/C][/ROW]
[ROW][C]23[/C][C]0.017835[/C][C]0.137[/C][C]0.44575[/C][/ROW]
[ROW][C]24[/C][C]0.117314[/C][C]0.9011[/C][C]0.185597[/C][/ROW]
[ROW][C]25[/C][C]-0.009809[/C][C]-0.0753[/C][C]0.470097[/C][/ROW]
[ROW][C]26[/C][C]-0.006744[/C][C]-0.0518[/C][C]0.479431[/C][/ROW]
[ROW][C]27[/C][C]-0.015825[/C][C]-0.1216[/C][C]0.451834[/C][/ROW]
[ROW][C]28[/C][C]-0.047206[/C][C]-0.3626[/C][C]0.3591[/C][/ROW]
[ROW][C]29[/C][C]-0.014327[/C][C]-0.11[/C][C]0.456373[/C][/ROW]
[ROW][C]30[/C][C]-0.090454[/C][C]-0.6948[/C][C]0.244958[/C][/ROW]
[ROW][C]31[/C][C]-0.105227[/C][C]-0.8083[/C][C]0.211092[/C][/ROW]
[ROW][C]32[/C][C]0.091191[/C][C]0.7005[/C][C]0.243199[/C][/ROW]
[ROW][C]33[/C][C]0.084111[/C][C]0.6461[/C][C]0.26037[/C][/ROW]
[ROW][C]34[/C][C]-0.01699[/C][C]-0.1305[/C][C]0.448307[/C][/ROW]
[ROW][C]35[/C][C]0.010457[/C][C]0.0803[/C][C]0.468127[/C][/ROW]
[ROW][C]36[/C][C]0.029775[/C][C]0.2287[/C][C]0.409944[/C][/ROW]
[ROW][C]37[/C][C]-0.006893[/C][C]-0.0529[/C][C]0.478977[/C][/ROW]
[ROW][C]38[/C][C]0.042583[/C][C]0.3271[/C][C]0.372379[/C][/ROW]
[ROW][C]39[/C][C]0.000757[/C][C]0.0058[/C][C]0.497691[/C][/ROW]
[ROW][C]40[/C][C]-0.049345[/C][C]-0.379[/C][C]0.353014[/C][/ROW]
[ROW][C]41[/C][C]-0.034935[/C][C]-0.2683[/C][C]0.394686[/C][/ROW]
[ROW][C]42[/C][C]-0.076149[/C][C]-0.5849[/C][C]0.28042[/C][/ROW]
[ROW][C]43[/C][C]-0.035933[/C][C]-0.276[/C][C]0.391754[/C][/ROW]
[ROW][C]44[/C][C]0.091182[/C][C]0.7004[/C][C]0.243221[/C][/ROW]
[ROW][C]45[/C][C]0.131396[/C][C]1.0093[/C][C]0.158482[/C][/ROW]
[ROW][C]46[/C][C]0.00949[/C][C]0.0729[/C][C]0.471067[/C][/ROW]
[ROW][C]47[/C][C]-0.038849[/C][C]-0.2984[/C][C]0.383221[/C][/ROW]
[ROW][C]48[/C][C]-0.052664[/C][C]-0.4045[/C][C]0.343646[/C][/ROW]
[ROW][C]49[/C][C]-0.024003[/C][C]-0.1844[/C][C]0.427176[/C][/ROW]
[ROW][C]50[/C][C]0.002319[/C][C]0.0178[/C][C]0.492925[/C][/ROW]
[ROW][C]51[/C][C]-0.005595[/C][C]-0.043[/C][C]0.482934[/C][/ROW]
[ROW][C]52[/C][C]-0.009355[/C][C]-0.0719[/C][C]0.47148[/C][/ROW]
[ROW][C]53[/C][C]0.035857[/C][C]0.2754[/C][C]0.391976[/C][/ROW]
[ROW][C]54[/C][C]0.01086[/C][C]0.0834[/C][C]0.466902[/C][/ROW]
[ROW][C]55[/C][C]-0.004085[/C][C]-0.0314[/C][C]0.487537[/C][/ROW]
[ROW][C]56[/C][C]-0.007654[/C][C]-0.0588[/C][C]0.476657[/C][/ROW]
[ROW][C]57[/C][C]-0.002178[/C][C]-0.0167[/C][C]0.493354[/C][/ROW]
[ROW][C]58[/C][C]0.000647[/C][C]0.005[/C][C]0.498025[/C][/ROW]
[ROW][C]59[/C][C]NA[/C][C]NA[/C][C]NA[/C][/ROW]
[ROW][C]60[/C][C]NA[/C][C]NA[/C][C]NA[/C][/ROW]
[/TABLE]
Source: https://freestatistics.org/blog/index.php?pk=65189&T=1

Globally Unique Identifier (entire table): ba.freestatistics.org/blog/index.php?pk=65189&T=1

As an alternative you can also use a QR Code:  

The GUIDs for individual cells are displayed in the table below:

Autocorrelation Function
Time lag kACF(k)T-STATP-value
10.1891371.45280.07579
2-0.210198-1.61460.055871
3-0.349468-2.68430.00471
4-0.266018-2.04330.022747
50.1511331.16090.125184
60.209191.60680.056717
70.0187070.14370.443118
8-0.178918-1.37430.087274
9-0.175865-1.35080.090952
10-0.037839-0.29060.386171
110.1285310.98730.163773
120.4676513.59210.000335
13-0.026787-0.20580.418845
14-0.169126-1.29910.099484
15-0.165027-1.26760.104961
16-0.134219-1.0310.153384
170.1547661.18880.119645
180.0787590.6050.273762
19-0.089836-0.690.246437
20-0.030092-0.23110.409002
21-0.047735-0.36670.357593
22-0.038303-0.29420.384815
230.0178350.1370.44575
240.1173140.90110.185597
25-0.009809-0.07530.470097
26-0.006744-0.05180.479431
27-0.015825-0.12160.451834
28-0.047206-0.36260.3591
29-0.014327-0.110.456373
30-0.090454-0.69480.244958
31-0.105227-0.80830.211092
320.0911910.70050.243199
330.0841110.64610.26037
34-0.01699-0.13050.448307
350.0104570.08030.468127
360.0297750.22870.409944
37-0.006893-0.05290.478977
380.0425830.32710.372379
390.0007570.00580.497691
40-0.049345-0.3790.353014
41-0.034935-0.26830.394686
42-0.076149-0.58490.28042
43-0.035933-0.2760.391754
440.0911820.70040.243221
450.1313961.00930.158482
460.009490.07290.471067
47-0.038849-0.29840.383221
48-0.052664-0.40450.343646
49-0.024003-0.18440.427176
500.0023190.01780.492925
51-0.005595-0.0430.482934
52-0.009355-0.07190.47148
530.0358570.27540.391976
540.010860.08340.466902
55-0.004085-0.03140.487537
56-0.007654-0.05880.476657
57-0.002178-0.01670.493354
580.0006470.0050.498025
59NANANA
60NANANA


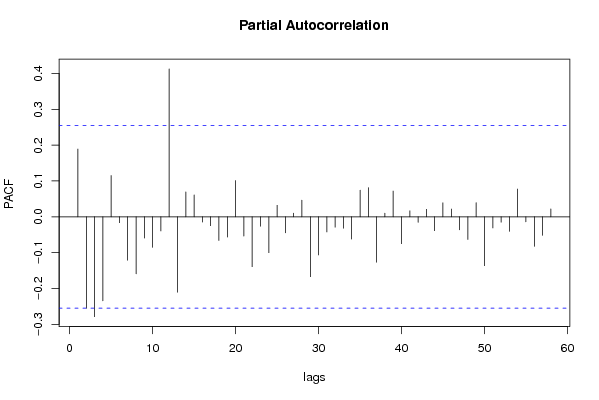
Partial Autocorrelation Function
Time lag kPACF(k)T-STATP-value
10.1891371.45280.07579
2-0.255096-1.95940.027396
3-0.278787-2.14140.018191
4-0.234411-1.80050.038443
50.1150660.88380.190184
6-0.016431-0.12620.449997
7-0.12097-0.92920.178289
8-0.159264-1.22330.113034
9-0.059317-0.45560.325166
10-0.085273-0.6550.257509
11-0.039395-0.30260.38163
120.4128013.17080.001206
13-0.210343-1.61570.05575
140.0692660.5320.298348
150.0611070.46940.320268
16-0.014594-0.11210.455562
17-0.02468-0.18960.425147
18-0.065955-0.50660.307159
19-0.056493-0.43390.332962
200.1012350.77760.219955
21-0.053884-0.41390.340228
22-0.139134-1.06870.144778
23-0.026165-0.2010.420705
24-0.100367-0.77090.221911
250.0322230.24750.402688
26-0.044826-0.34430.365916
270.0102170.07850.468856
280.0465510.35760.360972
29-0.167146-1.28390.102103
30-0.106472-0.81780.208374
31-0.042097-0.32340.373785
32-0.02904-0.22310.412129
33-0.031675-0.24330.404308
34-0.062042-0.47660.317721
350.0744450.57180.284807
360.0813480.62480.26724
37-0.126637-0.97270.167332
380.0099920.07680.46954
390.0717910.55140.291707
40-0.075125-0.5770.283051
410.0168330.12930.448783
42-0.015304-0.11760.453411
430.0210720.16190.435985
44-0.038878-0.29860.383137
450.0391280.30050.382409
460.0216450.16630.434262
47-0.036468-0.28010.390184
48-0.063107-0.48470.31483
490.039340.30220.38179
50-0.136342-1.04730.149625
51-0.03102-0.23830.406249
52-0.015029-0.11540.454243
53-0.040465-0.31080.378518
540.0773560.59420.27733
55-0.013971-0.10730.457453
56-0.082249-0.63180.264991
57-0.051794-0.39780.346093
580.0220130.16910.433154
59NANANA
60NANANA

\begin{tabular}{lllllllll}
\hline
Partial Autocorrelation Function \tabularnewline
Time lag k & PACF(k) & T-STAT & P-value \tabularnewline
1 & 0.189137 & 1.4528 & 0.07579 \tabularnewline
2 & -0.255096 & -1.9594 & 0.027396 \tabularnewline
3 & -0.278787 & -2.1414 & 0.018191 \tabularnewline
4 & -0.234411 & -1.8005 & 0.038443 \tabularnewline
5 & 0.115066 & 0.8838 & 0.190184 \tabularnewline
6 & -0.016431 & -0.1262 & 0.449997 \tabularnewline
7 & -0.12097 & -0.9292 & 0.178289 \tabularnewline
8 & -0.159264 & -1.2233 & 0.113034 \tabularnewline
9 & -0.059317 & -0.4556 & 0.325166 \tabularnewline
10 & -0.085273 & -0.655 & 0.257509 \tabularnewline
11 & -0.039395 & -0.3026 & 0.38163 \tabularnewline
12 & 0.412801 & 3.1708 & 0.001206 \tabularnewline
13 & -0.210343 & -1.6157 & 0.05575 \tabularnewline
14 & 0.069266 & 0.532 & 0.298348 \tabularnewline
15 & 0.061107 & 0.4694 & 0.320268 \tabularnewline
16 & -0.014594 & -0.1121 & 0.455562 \tabularnewline
17 & -0.02468 & -0.1896 & 0.425147 \tabularnewline
18 & -0.065955 & -0.5066 & 0.307159 \tabularnewline
19 & -0.056493 & -0.4339 & 0.332962 \tabularnewline
20 & 0.101235 & 0.7776 & 0.219955 \tabularnewline
21 & -0.053884 & -0.4139 & 0.340228 \tabularnewline
22 & -0.139134 & -1.0687 & 0.144778 \tabularnewline
23 & -0.026165 & -0.201 & 0.420705 \tabularnewline
24 & -0.100367 & -0.7709 & 0.221911 \tabularnewline
25 & 0.032223 & 0.2475 & 0.402688 \tabularnewline
26 & -0.044826 & -0.3443 & 0.365916 \tabularnewline
27 & 0.010217 & 0.0785 & 0.468856 \tabularnewline
28 & 0.046551 & 0.3576 & 0.360972 \tabularnewline
29 & -0.167146 & -1.2839 & 0.102103 \tabularnewline
30 & -0.106472 & -0.8178 & 0.208374 \tabularnewline
31 & -0.042097 & -0.3234 & 0.373785 \tabularnewline
32 & -0.02904 & -0.2231 & 0.412129 \tabularnewline
33 & -0.031675 & -0.2433 & 0.404308 \tabularnewline
34 & -0.062042 & -0.4766 & 0.317721 \tabularnewline
35 & 0.074445 & 0.5718 & 0.284807 \tabularnewline
36 & 0.081348 & 0.6248 & 0.26724 \tabularnewline
37 & -0.126637 & -0.9727 & 0.167332 \tabularnewline
38 & 0.009992 & 0.0768 & 0.46954 \tabularnewline
39 & 0.071791 & 0.5514 & 0.291707 \tabularnewline
40 & -0.075125 & -0.577 & 0.283051 \tabularnewline
41 & 0.016833 & 0.1293 & 0.448783 \tabularnewline
42 & -0.015304 & -0.1176 & 0.453411 \tabularnewline
43 & 0.021072 & 0.1619 & 0.435985 \tabularnewline
44 & -0.038878 & -0.2986 & 0.383137 \tabularnewline
45 & 0.039128 & 0.3005 & 0.382409 \tabularnewline
46 & 0.021645 & 0.1663 & 0.434262 \tabularnewline
47 & -0.036468 & -0.2801 & 0.390184 \tabularnewline
48 & -0.063107 & -0.4847 & 0.31483 \tabularnewline
49 & 0.03934 & 0.3022 & 0.38179 \tabularnewline
50 & -0.136342 & -1.0473 & 0.149625 \tabularnewline
51 & -0.03102 & -0.2383 & 0.406249 \tabularnewline
52 & -0.015029 & -0.1154 & 0.454243 \tabularnewline
53 & -0.040465 & -0.3108 & 0.378518 \tabularnewline
54 & 0.077356 & 0.5942 & 0.27733 \tabularnewline
55 & -0.013971 & -0.1073 & 0.457453 \tabularnewline
56 & -0.082249 & -0.6318 & 0.264991 \tabularnewline
57 & -0.051794 & -0.3978 & 0.346093 \tabularnewline
58 & 0.022013 & 0.1691 & 0.433154 \tabularnewline
59 & NA & NA & NA \tabularnewline
60 & NA & NA & NA \tabularnewline
\hline
\end{tabular}
%Source: https://freestatistics.org/blog/index.php?pk=65189&T=2

[TABLE]
[ROW][C]Partial Autocorrelation Function[/C][/ROW]
[ROW][C]Time lag k[/C][C]PACF(k)[/C][C]T-STAT[/C][C]P-value[/C][/ROW]
[ROW][C]1[/C][C]0.189137[/C][C]1.4528[/C][C]0.07579[/C][/ROW]
[ROW][C]2[/C][C]-0.255096[/C][C]-1.9594[/C][C]0.027396[/C][/ROW]
[ROW][C]3[/C][C]-0.278787[/C][C]-2.1414[/C][C]0.018191[/C][/ROW]
[ROW][C]4[/C][C]-0.234411[/C][C]-1.8005[/C][C]0.038443[/C][/ROW]
[ROW][C]5[/C][C]0.115066[/C][C]0.8838[/C][C]0.190184[/C][/ROW]
[ROW][C]6[/C][C]-0.016431[/C][C]-0.1262[/C][C]0.449997[/C][/ROW]
[ROW][C]7[/C][C]-0.12097[/C][C]-0.9292[/C][C]0.178289[/C][/ROW]
[ROW][C]8[/C][C]-0.159264[/C][C]-1.2233[/C][C]0.113034[/C][/ROW]
[ROW][C]9[/C][C]-0.059317[/C][C]-0.4556[/C][C]0.325166[/C][/ROW]
[ROW][C]10[/C][C]-0.085273[/C][C]-0.655[/C][C]0.257509[/C][/ROW]
[ROW][C]11[/C][C]-0.039395[/C][C]-0.3026[/C][C]0.38163[/C][/ROW]
[ROW][C]12[/C][C]0.412801[/C][C]3.1708[/C][C]0.001206[/C][/ROW]
[ROW][C]13[/C][C]-0.210343[/C][C]-1.6157[/C][C]0.05575[/C][/ROW]
[ROW][C]14[/C][C]0.069266[/C][C]0.532[/C][C]0.298348[/C][/ROW]
[ROW][C]15[/C][C]0.061107[/C][C]0.4694[/C][C]0.320268[/C][/ROW]
[ROW][C]16[/C][C]-0.014594[/C][C]-0.1121[/C][C]0.455562[/C][/ROW]
[ROW][C]17[/C][C]-0.02468[/C][C]-0.1896[/C][C]0.425147[/C][/ROW]
[ROW][C]18[/C][C]-0.065955[/C][C]-0.5066[/C][C]0.307159[/C][/ROW]
[ROW][C]19[/C][C]-0.056493[/C][C]-0.4339[/C][C]0.332962[/C][/ROW]
[ROW][C]20[/C][C]0.101235[/C][C]0.7776[/C][C]0.219955[/C][/ROW]
[ROW][C]21[/C][C]-0.053884[/C][C]-0.4139[/C][C]0.340228[/C][/ROW]
[ROW][C]22[/C][C]-0.139134[/C][C]-1.0687[/C][C]0.144778[/C][/ROW]
[ROW][C]23[/C][C]-0.026165[/C][C]-0.201[/C][C]0.420705[/C][/ROW]
[ROW][C]24[/C][C]-0.100367[/C][C]-0.7709[/C][C]0.221911[/C][/ROW]
[ROW][C]25[/C][C]0.032223[/C][C]0.2475[/C][C]0.402688[/C][/ROW]
[ROW][C]26[/C][C]-0.044826[/C][C]-0.3443[/C][C]0.365916[/C][/ROW]
[ROW][C]27[/C][C]0.010217[/C][C]0.0785[/C][C]0.468856[/C][/ROW]
[ROW][C]28[/C][C]0.046551[/C][C]0.3576[/C][C]0.360972[/C][/ROW]
[ROW][C]29[/C][C]-0.167146[/C][C]-1.2839[/C][C]0.102103[/C][/ROW]
[ROW][C]30[/C][C]-0.106472[/C][C]-0.8178[/C][C]0.208374[/C][/ROW]
[ROW][C]31[/C][C]-0.042097[/C][C]-0.3234[/C][C]0.373785[/C][/ROW]
[ROW][C]32[/C][C]-0.02904[/C][C]-0.2231[/C][C]0.412129[/C][/ROW]
[ROW][C]33[/C][C]-0.031675[/C][C]-0.2433[/C][C]0.404308[/C][/ROW]
[ROW][C]34[/C][C]-0.062042[/C][C]-0.4766[/C][C]0.317721[/C][/ROW]
[ROW][C]35[/C][C]0.074445[/C][C]0.5718[/C][C]0.284807[/C][/ROW]
[ROW][C]36[/C][C]0.081348[/C][C]0.6248[/C][C]0.26724[/C][/ROW]
[ROW][C]37[/C][C]-0.126637[/C][C]-0.9727[/C][C]0.167332[/C][/ROW]
[ROW][C]38[/C][C]0.009992[/C][C]0.0768[/C][C]0.46954[/C][/ROW]
[ROW][C]39[/C][C]0.071791[/C][C]0.5514[/C][C]0.291707[/C][/ROW]
[ROW][C]40[/C][C]-0.075125[/C][C]-0.577[/C][C]0.283051[/C][/ROW]
[ROW][C]41[/C][C]0.016833[/C][C]0.1293[/C][C]0.448783[/C][/ROW]
[ROW][C]42[/C][C]-0.015304[/C][C]-0.1176[/C][C]0.453411[/C][/ROW]
[ROW][C]43[/C][C]0.021072[/C][C]0.1619[/C][C]0.435985[/C][/ROW]
[ROW][C]44[/C][C]-0.038878[/C][C]-0.2986[/C][C]0.383137[/C][/ROW]
[ROW][C]45[/C][C]0.039128[/C][C]0.3005[/C][C]0.382409[/C][/ROW]
[ROW][C]46[/C][C]0.021645[/C][C]0.1663[/C][C]0.434262[/C][/ROW]
[ROW][C]47[/C][C]-0.036468[/C][C]-0.2801[/C][C]0.390184[/C][/ROW]
[ROW][C]48[/C][C]-0.063107[/C][C]-0.4847[/C][C]0.31483[/C][/ROW]
[ROW][C]49[/C][C]0.03934[/C][C]0.3022[/C][C]0.38179[/C][/ROW]
[ROW][C]50[/C][C]-0.136342[/C][C]-1.0473[/C][C]0.149625[/C][/ROW]
[ROW][C]51[/C][C]-0.03102[/C][C]-0.2383[/C][C]0.406249[/C][/ROW]
[ROW][C]52[/C][C]-0.015029[/C][C]-0.1154[/C][C]0.454243[/C][/ROW]
[ROW][C]53[/C][C]-0.040465[/C][C]-0.3108[/C][C]0.378518[/C][/ROW]
[ROW][C]54[/C][C]0.077356[/C][C]0.5942[/C][C]0.27733[/C][/ROW]
[ROW][C]55[/C][C]-0.013971[/C][C]-0.1073[/C][C]0.457453[/C][/ROW]
[ROW][C]56[/C][C]-0.082249[/C][C]-0.6318[/C][C]0.264991[/C][/ROW]
[ROW][C]57[/C][C]-0.051794[/C][C]-0.3978[/C][C]0.346093[/C][/ROW]
[ROW][C]58[/C][C]0.022013[/C][C]0.1691[/C][C]0.433154[/C][/ROW]
[ROW][C]59[/C][C]NA[/C][C]NA[/C][C]NA[/C][/ROW]
[ROW][C]60[/C][C]NA[/C][C]NA[/C][C]NA[/C][/ROW]
[/TABLE]
Source: https://freestatistics.org/blog/index.php?pk=65189&T=2

Globally Unique Identifier (entire table): ba.freestatistics.org/blog/index.php?pk=65189&T=2

As an alternative you can also use a QR Code:  

The GUIDs for individual cells are displayed in the table below:

Partial Autocorrelation Function
Time lag kPACF(k)T-STATP-value
10.1891371.45280.07579
2-0.255096-1.95940.027396
3-0.278787-2.14140.018191
4-0.234411-1.80050.038443
50.1150660.88380.190184
6-0.016431-0.12620.449997
7-0.12097-0.92920.178289
8-0.159264-1.22330.113034
9-0.059317-0.45560.325166
10-0.085273-0.6550.257509
11-0.039395-0.30260.38163
120.4128013.17080.001206
13-0.210343-1.61570.05575
140.0692660.5320.298348
150.0611070.46940.320268
16-0.014594-0.11210.455562
17-0.02468-0.18960.425147
18-0.065955-0.50660.307159
19-0.056493-0.43390.332962
200.1012350.77760.219955
21-0.053884-0.41390.340228
22-0.139134-1.06870.144778
23-0.026165-0.2010.420705
24-0.100367-0.77090.221911
250.0322230.24750.402688
26-0.044826-0.34430.365916
270.0102170.07850.468856
280.0465510.35760.360972
29-0.167146-1.28390.102103
30-0.106472-0.81780.208374
31-0.042097-0.32340.373785
32-0.02904-0.22310.412129
33-0.031675-0.24330.404308
34-0.062042-0.47660.317721
350.0744450.57180.284807
360.0813480.62480.26724
37-0.126637-0.97270.167332
380.0099920.07680.46954
390.0717910.55140.291707
40-0.075125-0.5770.283051
410.0168330.12930.448783
42-0.015304-0.11760.453411
430.0210720.16190.435985
44-0.038878-0.29860.383137
450.0391280.30050.382409
460.0216450.16630.434262
47-0.036468-0.28010.390184
48-0.063107-0.48470.31483
490.039340.30220.38179
50-0.136342-1.04730.149625
51-0.03102-0.23830.406249
52-0.015029-0.11540.454243
53-0.040465-0.31080.378518
540.0773560.59420.27733
55-0.013971-0.10730.457453
56-0.082249-0.63180.264991
57-0.051794-0.39780.346093
580.0220130.16910.433154
59NANANA
60NANANA


Parameters (Session):
par1 = 60 ; par2 = 1 ; par3 = 1 ; par4 = 0 ; par5 = 12 ; par6 = White Noise ; par7 = 0.95 ;
Parameters (R input):
par1 = 60 ; par2 = 1 ; par3 = 1 ; par4 = 0 ; par5 = 12 ; par6 = White Noise ; par7 = 0.95 ;
R code (references can be found in the software module):
if (par1 == 'Default') {
par1 = 10*log10(length(x))
} else {
par1 <- as.numeric(par1)
}
par2 <- as.numeric(par2)
par3 <- as.numeric(par3)
par4 <- as.numeric(par4)
par5 <- as.numeric(par5)
if (par6 == 'White Noise') par6 <- 'white' else par6 <- 'ma'
par7 <- as.numeric(par7)
if (par2 == 0) {
x <- log(x)
} else {
x <- (x ^ par2 - 1) / par2
}
if (par3 > 0) x <- diff(x,lag=1,difference=par3)
if (par4 > 0) x <- diff(x,lag=par5,difference=par4)
bitmap(file='pic1.png')
racf <- acf(x, par1, main='Autocorrelation', xlab='time lag', ylab='ACF', ci.type=par6, ci=par7, sub=paste('(lambda=',par2,', d=',par3,', D=',par4,', CI=', par7, ', CI type=',par6,')',sep=''))
dev.off()
bitmap(file='pic2.png')
rpacf <- pacf(x,par1,main='Partial Autocorrelation',xlab='lags',ylab='PACF')
dev.off()
(myacf <- c(racf$acf))
(mypacf <- c(rpacf$acf))
lengthx <- length(x)
sqrtn <- sqrt(lengthx)
load(file='createtable')
a<-table.start()
a<-table.row.start(a)
a<-table.element(a,'Autocorrelation Function',4,TRUE)
a<-table.row.end(a)
a<-table.row.start(a)
a<-table.element(a,'Time lag k',header=TRUE)
a<-table.element(a,hyperlink('basics.htm','ACF(k)','click here for more information about the Autocorrelation Function'),header=TRUE)
a<-table.element(a,'T-STAT',header=TRUE)
a<-table.element(a,'P-value',header=TRUE)
a<-table.row.end(a)
for (i in 2:(par1+1)) {
a<-table.row.start(a)
a<-table.element(a,i-1,header=TRUE)
a<-table.element(a,round(myacf[i],6))
mytstat <- myacf[i]*sqrtn
a<-table.element(a,round(mytstat,4))
a<-table.element(a,round(1-pt(abs(mytstat),lengthx),6))
a<-table.row.end(a)
}
a<-table.end(a)
table.save(a,file='mytable.tab')
a<-table.start()
a<-table.row.start(a)
a<-table.element(a,'Partial Autocorrelation Function',4,TRUE)
a<-table.row.end(a)
a<-table.row.start(a)
a<-table.element(a,'Time lag k',header=TRUE)
a<-table.element(a,hyperlink('basics.htm','PACF(k)','click here for more information about the Partial Autocorrelation Function'),header=TRUE)
a<-table.element(a,'T-STAT',header=TRUE)
a<-table.element(a,'P-value',header=TRUE)
a<-table.row.end(a)
for (i in 1:par1) {
a<-table.row.start(a)
a<-table.element(a,i,header=TRUE)
a<-table.element(a,round(mypacf[i],6))
mytstat <- mypacf[i]*sqrtn
a<-table.element(a,round(mytstat,4))
a<-table.element(a,round(1-pt(abs(mytstat),lengthx),6))
a<-table.row.end(a)
}
a<-table.end(a)
table.save(a,file='mytable1.tab')