Free Statistics

of Irreproducible Research!

Author's title

Author*The author of this computation has been verified*
R Software Modulerwasp_autocorrelation.wasp
Title produced by software(Partial) Autocorrelation Function
Date of computationWed, 09 Dec 2009 13:01:36 -0700
Cite this page as followsStatistical Computations at FreeStatistics.org, Office for Research Development and Education, URL https://freestatistics.org/blog/index.php?v=date/2009/Dec/09/t12603889512pddu3xu6j9123g.htm/, Retrieved Mon, 29 Apr 2024 12:20:55 +0000
Statistical Computations at FreeStatistics.org, Office for Research Development and Education, URL https://freestatistics.org/blog/index.php?pk=65191, Retrieved Mon, 29 Apr 2024 12:20:55 +0000
QR Codes:

Original text written by user:
IsPrivate?No (this computation is public)
User-defined keywords
Estimated Impact97
Family? (F = Feedback message, R = changed R code, M = changed R Module, P = changed Parameters, D = changed Data)
-     [Univariate Explorative Data Analysis] [Run Sequence gebo...] [2008-12-12 13:32:37] [76963dc1903f0f612b6153510a3818cf]
- R  D  [Univariate Explorative Data Analysis] [Run Sequence gebo...] [2008-12-17 12:14:40] [76963dc1903f0f612b6153510a3818cf]
-         [Univariate Explorative Data Analysis] [Run Sequence Plot...] [2008-12-22 18:19:51] [1ce0d16c8f4225c977b42c8fa93bc163]
- RMP       [(Partial) Autocorrelation Function] [Identifying Integ...] [2009-11-22 12:26:39] [b98453cac15ba1066b407e146608df68]
-   PD          [(Partial) Autocorrelation Function] [paper] [2009-12-09 20:01:36] [d447d4b3e35da686436a520338c962fc] [Current]
Feedback Forum

Post a new message
Dataseries X:
595
591
612
595
597
589
584
573
567
569
621
629
628
593
588
566
557
590
580
574
573
573
620
626
620
561
527
510
514
549
532
526
511
499
555
565
542
517
506
502
516
508
493
490
469
478
528
534
518
528
533
536
537
524
536
587
597
581
564
558


Summary of computational transaction
Raw Inputview raw input (R code)
Raw Outputview raw output of R engine
Computing time1 seconds
R Server'Gwilym Jenkins' @ 72.249.127.135

\begin{tabular}{lllllllll}
\hline
Summary of computational transaction \tabularnewline
Raw Input & view raw input (R code)  \tabularnewline
Raw Output & view raw output of R engine  \tabularnewline
Computing time & 1 seconds \tabularnewline
R Server & 'Gwilym Jenkins' @ 72.249.127.135 \tabularnewline
\hline
\end{tabular}
%Source: https://freestatistics.org/blog/index.php?pk=65191&T=0

[TABLE]
[ROW][C]Summary of computational transaction[/C][/ROW]
[ROW][C]Raw Input[/C][C]view raw input (R code) [/C][/ROW]
[ROW][C]Raw Output[/C][C]view raw output of R engine [/C][/ROW]
[ROW][C]Computing time[/C][C]1 seconds[/C][/ROW]
[ROW][C]R Server[/C][C]'Gwilym Jenkins' @ 72.249.127.135[/C][/ROW]
[/TABLE]
Source: https://freestatistics.org/blog/index.php?pk=65191&T=0

Globally Unique Identifier (entire table): ba.freestatistics.org/blog/index.php?pk=65191&T=0

As an alternative you can also use a QR Code:  

The GUIDs for individual cells are displayed in the table below:

Summary of computational transaction
Raw Inputview raw input (R code)
Raw Outputview raw output of R engine
Computing time1 seconds
R Server'Gwilym Jenkins' @ 72.249.127.135


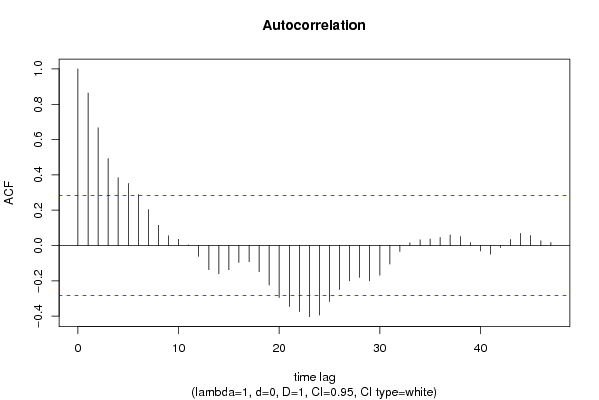
Autocorrelation Function
Time lag kACF(k)T-STATP-value
10.8637575.98430
20.6664274.61711.5e-05
30.4927433.41380.000655
40.3843352.66280.005258
50.3512342.43340.009365
60.2892132.00370.025381
70.2033611.40890.082651
80.115090.79740.214582
90.0545290.37780.353626
100.03520.24390.404185
110.0028270.01960.492229
12-0.062096-0.43020.334483
13-0.136927-0.94870.173773
14-0.160091-1.10910.136448
15-0.137015-0.94930.173619
16-0.09573-0.66320.255177
17-0.091671-0.63510.264185
18-0.148678-1.03010.154069
19-0.224347-1.55430.063338
20-0.295237-2.04550.023156
21-0.346179-2.39840.010201
22-0.374428-2.59410.006269
23-0.403139-2.7930.003739
24-0.394341-2.73210.004391
25-0.317958-2.20290.016219
26-0.249332-1.72740.045261
27-0.200068-1.38610.086059
28-0.181145-1.2550.107775
29-0.200149-1.38670.085974
30-0.168217-1.16540.124799
31-0.10507-0.72790.235092
32-0.033458-0.23180.408837
330.0148150.10260.459338
340.0322370.22330.412106
350.0365140.2530.400684
360.0458690.31780.376011
370.0597520.4140.34037
380.0507490.35160.363338
390.0162620.11270.455382
40-0.03105-0.21510.415291
41-0.049576-0.34350.366371
42-0.01166-0.08080.467975
430.0343970.23830.406327
440.0685670.4750.318454
450.0558460.38690.350265
460.0272180.18860.425611
470.016620.11510.454404
48NANANA
49NANANA
50NANANA
51NANANA
52NANANA
53NANANA
54NANANA
55NANANA
56NANANA
57NANANA
58NANANA
59NANANA
60NANANA

\begin{tabular}{lllllllll}
\hline
Autocorrelation Function \tabularnewline
Time lag k & ACF(k) & T-STAT & P-value \tabularnewline
1 & 0.863757 & 5.9843 & 0 \tabularnewline
2 & 0.666427 & 4.6171 & 1.5e-05 \tabularnewline
3 & 0.492743 & 3.4138 & 0.000655 \tabularnewline
4 & 0.384335 & 2.6628 & 0.005258 \tabularnewline
5 & 0.351234 & 2.4334 & 0.009365 \tabularnewline
6 & 0.289213 & 2.0037 & 0.025381 \tabularnewline
7 & 0.203361 & 1.4089 & 0.082651 \tabularnewline
8 & 0.11509 & 0.7974 & 0.214582 \tabularnewline
9 & 0.054529 & 0.3778 & 0.353626 \tabularnewline
10 & 0.0352 & 0.2439 & 0.404185 \tabularnewline
11 & 0.002827 & 0.0196 & 0.492229 \tabularnewline
12 & -0.062096 & -0.4302 & 0.334483 \tabularnewline
13 & -0.136927 & -0.9487 & 0.173773 \tabularnewline
14 & -0.160091 & -1.1091 & 0.136448 \tabularnewline
15 & -0.137015 & -0.9493 & 0.173619 \tabularnewline
16 & -0.09573 & -0.6632 & 0.255177 \tabularnewline
17 & -0.091671 & -0.6351 & 0.264185 \tabularnewline
18 & -0.148678 & -1.0301 & 0.154069 \tabularnewline
19 & -0.224347 & -1.5543 & 0.063338 \tabularnewline
20 & -0.295237 & -2.0455 & 0.023156 \tabularnewline
21 & -0.346179 & -2.3984 & 0.010201 \tabularnewline
22 & -0.374428 & -2.5941 & 0.006269 \tabularnewline
23 & -0.403139 & -2.793 & 0.003739 \tabularnewline
24 & -0.394341 & -2.7321 & 0.004391 \tabularnewline
25 & -0.317958 & -2.2029 & 0.016219 \tabularnewline
26 & -0.249332 & -1.7274 & 0.045261 \tabularnewline
27 & -0.200068 & -1.3861 & 0.086059 \tabularnewline
28 & -0.181145 & -1.255 & 0.107775 \tabularnewline
29 & -0.200149 & -1.3867 & 0.085974 \tabularnewline
30 & -0.168217 & -1.1654 & 0.124799 \tabularnewline
31 & -0.10507 & -0.7279 & 0.235092 \tabularnewline
32 & -0.033458 & -0.2318 & 0.408837 \tabularnewline
33 & 0.014815 & 0.1026 & 0.459338 \tabularnewline
34 & 0.032237 & 0.2233 & 0.412106 \tabularnewline
35 & 0.036514 & 0.253 & 0.400684 \tabularnewline
36 & 0.045869 & 0.3178 & 0.376011 \tabularnewline
37 & 0.059752 & 0.414 & 0.34037 \tabularnewline
38 & 0.050749 & 0.3516 & 0.363338 \tabularnewline
39 & 0.016262 & 0.1127 & 0.455382 \tabularnewline
40 & -0.03105 & -0.2151 & 0.415291 \tabularnewline
41 & -0.049576 & -0.3435 & 0.366371 \tabularnewline
42 & -0.01166 & -0.0808 & 0.467975 \tabularnewline
43 & 0.034397 & 0.2383 & 0.406327 \tabularnewline
44 & 0.068567 & 0.475 & 0.318454 \tabularnewline
45 & 0.055846 & 0.3869 & 0.350265 \tabularnewline
46 & 0.027218 & 0.1886 & 0.425611 \tabularnewline
47 & 0.01662 & 0.1151 & 0.454404 \tabularnewline
48 & NA & NA & NA \tabularnewline
49 & NA & NA & NA \tabularnewline
50 & NA & NA & NA \tabularnewline
51 & NA & NA & NA \tabularnewline
52 & NA & NA & NA \tabularnewline
53 & NA & NA & NA \tabularnewline
54 & NA & NA & NA \tabularnewline
55 & NA & NA & NA \tabularnewline
56 & NA & NA & NA \tabularnewline
57 & NA & NA & NA \tabularnewline
58 & NA & NA & NA \tabularnewline
59 & NA & NA & NA \tabularnewline
60 & NA & NA & NA \tabularnewline
\hline
\end{tabular}
%Source: https://freestatistics.org/blog/index.php?pk=65191&T=1

[TABLE]
[ROW][C]Autocorrelation Function[/C][/ROW]
[ROW][C]Time lag k[/C][C]ACF(k)[/C][C]T-STAT[/C][C]P-value[/C][/ROW]
[ROW][C]1[/C][C]0.863757[/C][C]5.9843[/C][C]0[/C][/ROW]
[ROW][C]2[/C][C]0.666427[/C][C]4.6171[/C][C]1.5e-05[/C][/ROW]
[ROW][C]3[/C][C]0.492743[/C][C]3.4138[/C][C]0.000655[/C][/ROW]
[ROW][C]4[/C][C]0.384335[/C][C]2.6628[/C][C]0.005258[/C][/ROW]
[ROW][C]5[/C][C]0.351234[/C][C]2.4334[/C][C]0.009365[/C][/ROW]
[ROW][C]6[/C][C]0.289213[/C][C]2.0037[/C][C]0.025381[/C][/ROW]
[ROW][C]7[/C][C]0.203361[/C][C]1.4089[/C][C]0.082651[/C][/ROW]
[ROW][C]8[/C][C]0.11509[/C][C]0.7974[/C][C]0.214582[/C][/ROW]
[ROW][C]9[/C][C]0.054529[/C][C]0.3778[/C][C]0.353626[/C][/ROW]
[ROW][C]10[/C][C]0.0352[/C][C]0.2439[/C][C]0.404185[/C][/ROW]
[ROW][C]11[/C][C]0.002827[/C][C]0.0196[/C][C]0.492229[/C][/ROW]
[ROW][C]12[/C][C]-0.062096[/C][C]-0.4302[/C][C]0.334483[/C][/ROW]
[ROW][C]13[/C][C]-0.136927[/C][C]-0.9487[/C][C]0.173773[/C][/ROW]
[ROW][C]14[/C][C]-0.160091[/C][C]-1.1091[/C][C]0.136448[/C][/ROW]
[ROW][C]15[/C][C]-0.137015[/C][C]-0.9493[/C][C]0.173619[/C][/ROW]
[ROW][C]16[/C][C]-0.09573[/C][C]-0.6632[/C][C]0.255177[/C][/ROW]
[ROW][C]17[/C][C]-0.091671[/C][C]-0.6351[/C][C]0.264185[/C][/ROW]
[ROW][C]18[/C][C]-0.148678[/C][C]-1.0301[/C][C]0.154069[/C][/ROW]
[ROW][C]19[/C][C]-0.224347[/C][C]-1.5543[/C][C]0.063338[/C][/ROW]
[ROW][C]20[/C][C]-0.295237[/C][C]-2.0455[/C][C]0.023156[/C][/ROW]
[ROW][C]21[/C][C]-0.346179[/C][C]-2.3984[/C][C]0.010201[/C][/ROW]
[ROW][C]22[/C][C]-0.374428[/C][C]-2.5941[/C][C]0.006269[/C][/ROW]
[ROW][C]23[/C][C]-0.403139[/C][C]-2.793[/C][C]0.003739[/C][/ROW]
[ROW][C]24[/C][C]-0.394341[/C][C]-2.7321[/C][C]0.004391[/C][/ROW]
[ROW][C]25[/C][C]-0.317958[/C][C]-2.2029[/C][C]0.016219[/C][/ROW]
[ROW][C]26[/C][C]-0.249332[/C][C]-1.7274[/C][C]0.045261[/C][/ROW]
[ROW][C]27[/C][C]-0.200068[/C][C]-1.3861[/C][C]0.086059[/C][/ROW]
[ROW][C]28[/C][C]-0.181145[/C][C]-1.255[/C][C]0.107775[/C][/ROW]
[ROW][C]29[/C][C]-0.200149[/C][C]-1.3867[/C][C]0.085974[/C][/ROW]
[ROW][C]30[/C][C]-0.168217[/C][C]-1.1654[/C][C]0.124799[/C][/ROW]
[ROW][C]31[/C][C]-0.10507[/C][C]-0.7279[/C][C]0.235092[/C][/ROW]
[ROW][C]32[/C][C]-0.033458[/C][C]-0.2318[/C][C]0.408837[/C][/ROW]
[ROW][C]33[/C][C]0.014815[/C][C]0.1026[/C][C]0.459338[/C][/ROW]
[ROW][C]34[/C][C]0.032237[/C][C]0.2233[/C][C]0.412106[/C][/ROW]
[ROW][C]35[/C][C]0.036514[/C][C]0.253[/C][C]0.400684[/C][/ROW]
[ROW][C]36[/C][C]0.045869[/C][C]0.3178[/C][C]0.376011[/C][/ROW]
[ROW][C]37[/C][C]0.059752[/C][C]0.414[/C][C]0.34037[/C][/ROW]
[ROW][C]38[/C][C]0.050749[/C][C]0.3516[/C][C]0.363338[/C][/ROW]
[ROW][C]39[/C][C]0.016262[/C][C]0.1127[/C][C]0.455382[/C][/ROW]
[ROW][C]40[/C][C]-0.03105[/C][C]-0.2151[/C][C]0.415291[/C][/ROW]
[ROW][C]41[/C][C]-0.049576[/C][C]-0.3435[/C][C]0.366371[/C][/ROW]
[ROW][C]42[/C][C]-0.01166[/C][C]-0.0808[/C][C]0.467975[/C][/ROW]
[ROW][C]43[/C][C]0.034397[/C][C]0.2383[/C][C]0.406327[/C][/ROW]
[ROW][C]44[/C][C]0.068567[/C][C]0.475[/C][C]0.318454[/C][/ROW]
[ROW][C]45[/C][C]0.055846[/C][C]0.3869[/C][C]0.350265[/C][/ROW]
[ROW][C]46[/C][C]0.027218[/C][C]0.1886[/C][C]0.425611[/C][/ROW]
[ROW][C]47[/C][C]0.01662[/C][C]0.1151[/C][C]0.454404[/C][/ROW]
[ROW][C]48[/C][C]NA[/C][C]NA[/C][C]NA[/C][/ROW]
[ROW][C]49[/C][C]NA[/C][C]NA[/C][C]NA[/C][/ROW]
[ROW][C]50[/C][C]NA[/C][C]NA[/C][C]NA[/C][/ROW]
[ROW][C]51[/C][C]NA[/C][C]NA[/C][C]NA[/C][/ROW]
[ROW][C]52[/C][C]NA[/C][C]NA[/C][C]NA[/C][/ROW]
[ROW][C]53[/C][C]NA[/C][C]NA[/C][C]NA[/C][/ROW]
[ROW][C]54[/C][C]NA[/C][C]NA[/C][C]NA[/C][/ROW]
[ROW][C]55[/C][C]NA[/C][C]NA[/C][C]NA[/C][/ROW]
[ROW][C]56[/C][C]NA[/C][C]NA[/C][C]NA[/C][/ROW]
[ROW][C]57[/C][C]NA[/C][C]NA[/C][C]NA[/C][/ROW]
[ROW][C]58[/C][C]NA[/C][C]NA[/C][C]NA[/C][/ROW]
[ROW][C]59[/C][C]NA[/C][C]NA[/C][C]NA[/C][/ROW]
[ROW][C]60[/C][C]NA[/C][C]NA[/C][C]NA[/C][/ROW]
[/TABLE]
Source: https://freestatistics.org/blog/index.php?pk=65191&T=1

Globally Unique Identifier (entire table): ba.freestatistics.org/blog/index.php?pk=65191&T=1

As an alternative you can also use a QR Code:  

The GUIDs for individual cells are displayed in the table below:

Autocorrelation Function
Time lag kACF(k)T-STATP-value
10.8637575.98430
20.6664274.61711.5e-05
30.4927433.41380.000655
40.3843352.66280.005258
50.3512342.43340.009365
60.2892132.00370.025381
70.2033611.40890.082651
80.115090.79740.214582
90.0545290.37780.353626
100.03520.24390.404185
110.0028270.01960.492229
12-0.062096-0.43020.334483
13-0.136927-0.94870.173773
14-0.160091-1.10910.136448
15-0.137015-0.94930.173619
16-0.09573-0.66320.255177
17-0.091671-0.63510.264185
18-0.148678-1.03010.154069
19-0.224347-1.55430.063338
20-0.295237-2.04550.023156
21-0.346179-2.39840.010201
22-0.374428-2.59410.006269
23-0.403139-2.7930.003739
24-0.394341-2.73210.004391
25-0.317958-2.20290.016219
26-0.249332-1.72740.045261
27-0.200068-1.38610.086059
28-0.181145-1.2550.107775
29-0.200149-1.38670.085974
30-0.168217-1.16540.124799
31-0.10507-0.72790.235092
32-0.033458-0.23180.408837
330.0148150.10260.459338
340.0322370.22330.412106
350.0365140.2530.400684
360.0458690.31780.376011
370.0597520.4140.34037
380.0507490.35160.363338
390.0162620.11270.455382
40-0.03105-0.21510.415291
41-0.049576-0.34350.366371
42-0.01166-0.08080.467975
430.0343970.23830.406327
440.0685670.4750.318454
450.0558460.38690.350265
460.0272180.18860.425611
470.016620.11510.454404
48NANANA
49NANANA
50NANANA
51NANANA
52NANANA
53NANANA
54NANANA
55NANANA
56NANANA
57NANANA
58NANANA
59NANANA
60NANANA


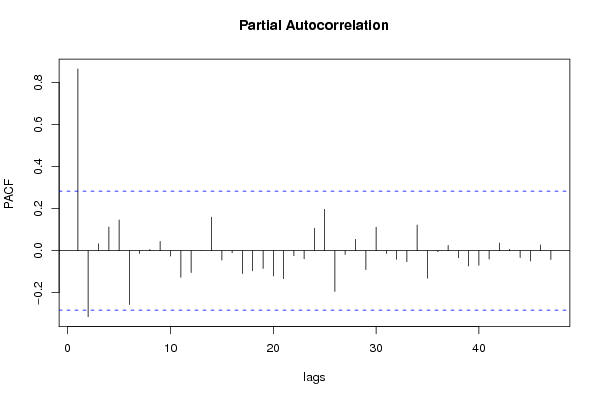
Partial Autocorrelation Function
Time lag kPACF(k)T-STATP-value
10.8637575.98430
2-0.31367-2.17320.017367
30.032710.22660.41084
40.1123210.77820.220139
50.1457891.01010.158767
6-0.256106-1.77440.041173
7-0.013758-0.09530.462229
80.0061010.04230.483229
90.0439750.30470.380968
10-0.025834-0.1790.429352
11-0.126419-0.87590.192735
12-0.104147-0.72160.237035
130.0011930.00830.496721
140.1589581.10130.13813
15-0.044582-0.30890.379378
16-0.009677-0.0670.473411
17-0.109072-0.75570.226769
18-0.095943-0.66470.254708
19-0.084721-0.5870.279988
20-0.120311-0.83350.204335
21-0.133011-0.92150.180691
22-0.023802-0.16490.434855
23-0.038933-0.26970.39426
240.1066020.73860.231886
250.1963141.36010.090076
26-0.193528-1.34080.093148
27-0.018082-0.12530.450414
280.054090.37470.354749
29-0.089917-0.6230.268129
300.1117420.77420.221312
31-0.013885-0.09620.461882
32-0.04086-0.28310.389164
33-0.052164-0.36140.359692
340.1216910.84310.201677
35-0.130592-0.90480.185053
36-0.005143-0.03560.485863
370.0245720.17020.43277
38-0.0341-0.23630.40712
39-0.072315-0.5010.309325
40-0.069917-0.48440.315153
41-0.039742-0.27530.392119
420.0363910.25210.40101
430.0062730.04350.482756
44-0.03305-0.2290.409931
45-0.048589-0.33660.36893
460.0273460.18950.425265
47-0.04237-0.29350.385186
48NANANA
49NANANA
50NANANA
51NANANA
52NANANA
53NANANA
54NANANA
55NANANA
56NANANA
57NANANA
58NANANA
59NANANA
60NANANA

\begin{tabular}{lllllllll}
\hline
Partial Autocorrelation Function \tabularnewline
Time lag k & PACF(k) & T-STAT & P-value \tabularnewline
1 & 0.863757 & 5.9843 & 0 \tabularnewline
2 & -0.31367 & -2.1732 & 0.017367 \tabularnewline
3 & 0.03271 & 0.2266 & 0.41084 \tabularnewline
4 & 0.112321 & 0.7782 & 0.220139 \tabularnewline
5 & 0.145789 & 1.0101 & 0.158767 \tabularnewline
6 & -0.256106 & -1.7744 & 0.041173 \tabularnewline
7 & -0.013758 & -0.0953 & 0.462229 \tabularnewline
8 & 0.006101 & 0.0423 & 0.483229 \tabularnewline
9 & 0.043975 & 0.3047 & 0.380968 \tabularnewline
10 & -0.025834 & -0.179 & 0.429352 \tabularnewline
11 & -0.126419 & -0.8759 & 0.192735 \tabularnewline
12 & -0.104147 & -0.7216 & 0.237035 \tabularnewline
13 & 0.001193 & 0.0083 & 0.496721 \tabularnewline
14 & 0.158958 & 1.1013 & 0.13813 \tabularnewline
15 & -0.044582 & -0.3089 & 0.379378 \tabularnewline
16 & -0.009677 & -0.067 & 0.473411 \tabularnewline
17 & -0.109072 & -0.7557 & 0.226769 \tabularnewline
18 & -0.095943 & -0.6647 & 0.254708 \tabularnewline
19 & -0.084721 & -0.587 & 0.279988 \tabularnewline
20 & -0.120311 & -0.8335 & 0.204335 \tabularnewline
21 & -0.133011 & -0.9215 & 0.180691 \tabularnewline
22 & -0.023802 & -0.1649 & 0.434855 \tabularnewline
23 & -0.038933 & -0.2697 & 0.39426 \tabularnewline
24 & 0.106602 & 0.7386 & 0.231886 \tabularnewline
25 & 0.196314 & 1.3601 & 0.090076 \tabularnewline
26 & -0.193528 & -1.3408 & 0.093148 \tabularnewline
27 & -0.018082 & -0.1253 & 0.450414 \tabularnewline
28 & 0.05409 & 0.3747 & 0.354749 \tabularnewline
29 & -0.089917 & -0.623 & 0.268129 \tabularnewline
30 & 0.111742 & 0.7742 & 0.221312 \tabularnewline
31 & -0.013885 & -0.0962 & 0.461882 \tabularnewline
32 & -0.04086 & -0.2831 & 0.389164 \tabularnewline
33 & -0.052164 & -0.3614 & 0.359692 \tabularnewline
34 & 0.121691 & 0.8431 & 0.201677 \tabularnewline
35 & -0.130592 & -0.9048 & 0.185053 \tabularnewline
36 & -0.005143 & -0.0356 & 0.485863 \tabularnewline
37 & 0.024572 & 0.1702 & 0.43277 \tabularnewline
38 & -0.0341 & -0.2363 & 0.40712 \tabularnewline
39 & -0.072315 & -0.501 & 0.309325 \tabularnewline
40 & -0.069917 & -0.4844 & 0.315153 \tabularnewline
41 & -0.039742 & -0.2753 & 0.392119 \tabularnewline
42 & 0.036391 & 0.2521 & 0.40101 \tabularnewline
43 & 0.006273 & 0.0435 & 0.482756 \tabularnewline
44 & -0.03305 & -0.229 & 0.409931 \tabularnewline
45 & -0.048589 & -0.3366 & 0.36893 \tabularnewline
46 & 0.027346 & 0.1895 & 0.425265 \tabularnewline
47 & -0.04237 & -0.2935 & 0.385186 \tabularnewline
48 & NA & NA & NA \tabularnewline
49 & NA & NA & NA \tabularnewline
50 & NA & NA & NA \tabularnewline
51 & NA & NA & NA \tabularnewline
52 & NA & NA & NA \tabularnewline
53 & NA & NA & NA \tabularnewline
54 & NA & NA & NA \tabularnewline
55 & NA & NA & NA \tabularnewline
56 & NA & NA & NA \tabularnewline
57 & NA & NA & NA \tabularnewline
58 & NA & NA & NA \tabularnewline
59 & NA & NA & NA \tabularnewline
60 & NA & NA & NA \tabularnewline
\hline
\end{tabular}
%Source: https://freestatistics.org/blog/index.php?pk=65191&T=2

[TABLE]
[ROW][C]Partial Autocorrelation Function[/C][/ROW]
[ROW][C]Time lag k[/C][C]PACF(k)[/C][C]T-STAT[/C][C]P-value[/C][/ROW]
[ROW][C]1[/C][C]0.863757[/C][C]5.9843[/C][C]0[/C][/ROW]
[ROW][C]2[/C][C]-0.31367[/C][C]-2.1732[/C][C]0.017367[/C][/ROW]
[ROW][C]3[/C][C]0.03271[/C][C]0.2266[/C][C]0.41084[/C][/ROW]
[ROW][C]4[/C][C]0.112321[/C][C]0.7782[/C][C]0.220139[/C][/ROW]
[ROW][C]5[/C][C]0.145789[/C][C]1.0101[/C][C]0.158767[/C][/ROW]
[ROW][C]6[/C][C]-0.256106[/C][C]-1.7744[/C][C]0.041173[/C][/ROW]
[ROW][C]7[/C][C]-0.013758[/C][C]-0.0953[/C][C]0.462229[/C][/ROW]
[ROW][C]8[/C][C]0.006101[/C][C]0.0423[/C][C]0.483229[/C][/ROW]
[ROW][C]9[/C][C]0.043975[/C][C]0.3047[/C][C]0.380968[/C][/ROW]
[ROW][C]10[/C][C]-0.025834[/C][C]-0.179[/C][C]0.429352[/C][/ROW]
[ROW][C]11[/C][C]-0.126419[/C][C]-0.8759[/C][C]0.192735[/C][/ROW]
[ROW][C]12[/C][C]-0.104147[/C][C]-0.7216[/C][C]0.237035[/C][/ROW]
[ROW][C]13[/C][C]0.001193[/C][C]0.0083[/C][C]0.496721[/C][/ROW]
[ROW][C]14[/C][C]0.158958[/C][C]1.1013[/C][C]0.13813[/C][/ROW]
[ROW][C]15[/C][C]-0.044582[/C][C]-0.3089[/C][C]0.379378[/C][/ROW]
[ROW][C]16[/C][C]-0.009677[/C][C]-0.067[/C][C]0.473411[/C][/ROW]
[ROW][C]17[/C][C]-0.109072[/C][C]-0.7557[/C][C]0.226769[/C][/ROW]
[ROW][C]18[/C][C]-0.095943[/C][C]-0.6647[/C][C]0.254708[/C][/ROW]
[ROW][C]19[/C][C]-0.084721[/C][C]-0.587[/C][C]0.279988[/C][/ROW]
[ROW][C]20[/C][C]-0.120311[/C][C]-0.8335[/C][C]0.204335[/C][/ROW]
[ROW][C]21[/C][C]-0.133011[/C][C]-0.9215[/C][C]0.180691[/C][/ROW]
[ROW][C]22[/C][C]-0.023802[/C][C]-0.1649[/C][C]0.434855[/C][/ROW]
[ROW][C]23[/C][C]-0.038933[/C][C]-0.2697[/C][C]0.39426[/C][/ROW]
[ROW][C]24[/C][C]0.106602[/C][C]0.7386[/C][C]0.231886[/C][/ROW]
[ROW][C]25[/C][C]0.196314[/C][C]1.3601[/C][C]0.090076[/C][/ROW]
[ROW][C]26[/C][C]-0.193528[/C][C]-1.3408[/C][C]0.093148[/C][/ROW]
[ROW][C]27[/C][C]-0.018082[/C][C]-0.1253[/C][C]0.450414[/C][/ROW]
[ROW][C]28[/C][C]0.05409[/C][C]0.3747[/C][C]0.354749[/C][/ROW]
[ROW][C]29[/C][C]-0.089917[/C][C]-0.623[/C][C]0.268129[/C][/ROW]
[ROW][C]30[/C][C]0.111742[/C][C]0.7742[/C][C]0.221312[/C][/ROW]
[ROW][C]31[/C][C]-0.013885[/C][C]-0.0962[/C][C]0.461882[/C][/ROW]
[ROW][C]32[/C][C]-0.04086[/C][C]-0.2831[/C][C]0.389164[/C][/ROW]
[ROW][C]33[/C][C]-0.052164[/C][C]-0.3614[/C][C]0.359692[/C][/ROW]
[ROW][C]34[/C][C]0.121691[/C][C]0.8431[/C][C]0.201677[/C][/ROW]
[ROW][C]35[/C][C]-0.130592[/C][C]-0.9048[/C][C]0.185053[/C][/ROW]
[ROW][C]36[/C][C]-0.005143[/C][C]-0.0356[/C][C]0.485863[/C][/ROW]
[ROW][C]37[/C][C]0.024572[/C][C]0.1702[/C][C]0.43277[/C][/ROW]
[ROW][C]38[/C][C]-0.0341[/C][C]-0.2363[/C][C]0.40712[/C][/ROW]
[ROW][C]39[/C][C]-0.072315[/C][C]-0.501[/C][C]0.309325[/C][/ROW]
[ROW][C]40[/C][C]-0.069917[/C][C]-0.4844[/C][C]0.315153[/C][/ROW]
[ROW][C]41[/C][C]-0.039742[/C][C]-0.2753[/C][C]0.392119[/C][/ROW]
[ROW][C]42[/C][C]0.036391[/C][C]0.2521[/C][C]0.40101[/C][/ROW]
[ROW][C]43[/C][C]0.006273[/C][C]0.0435[/C][C]0.482756[/C][/ROW]
[ROW][C]44[/C][C]-0.03305[/C][C]-0.229[/C][C]0.409931[/C][/ROW]
[ROW][C]45[/C][C]-0.048589[/C][C]-0.3366[/C][C]0.36893[/C][/ROW]
[ROW][C]46[/C][C]0.027346[/C][C]0.1895[/C][C]0.425265[/C][/ROW]
[ROW][C]47[/C][C]-0.04237[/C][C]-0.2935[/C][C]0.385186[/C][/ROW]
[ROW][C]48[/C][C]NA[/C][C]NA[/C][C]NA[/C][/ROW]
[ROW][C]49[/C][C]NA[/C][C]NA[/C][C]NA[/C][/ROW]
[ROW][C]50[/C][C]NA[/C][C]NA[/C][C]NA[/C][/ROW]
[ROW][C]51[/C][C]NA[/C][C]NA[/C][C]NA[/C][/ROW]
[ROW][C]52[/C][C]NA[/C][C]NA[/C][C]NA[/C][/ROW]
[ROW][C]53[/C][C]NA[/C][C]NA[/C][C]NA[/C][/ROW]
[ROW][C]54[/C][C]NA[/C][C]NA[/C][C]NA[/C][/ROW]
[ROW][C]55[/C][C]NA[/C][C]NA[/C][C]NA[/C][/ROW]
[ROW][C]56[/C][C]NA[/C][C]NA[/C][C]NA[/C][/ROW]
[ROW][C]57[/C][C]NA[/C][C]NA[/C][C]NA[/C][/ROW]
[ROW][C]58[/C][C]NA[/C][C]NA[/C][C]NA[/C][/ROW]
[ROW][C]59[/C][C]NA[/C][C]NA[/C][C]NA[/C][/ROW]
[ROW][C]60[/C][C]NA[/C][C]NA[/C][C]NA[/C][/ROW]
[/TABLE]
Source: https://freestatistics.org/blog/index.php?pk=65191&T=2

Globally Unique Identifier (entire table): ba.freestatistics.org/blog/index.php?pk=65191&T=2

As an alternative you can also use a QR Code:  

The GUIDs for individual cells are displayed in the table below:

Partial Autocorrelation Function
Time lag kPACF(k)T-STATP-value
10.8637575.98430
2-0.31367-2.17320.017367
30.032710.22660.41084
40.1123210.77820.220139
50.1457891.01010.158767
6-0.256106-1.77440.041173
7-0.013758-0.09530.462229
80.0061010.04230.483229
90.0439750.30470.380968
10-0.025834-0.1790.429352
11-0.126419-0.87590.192735
12-0.104147-0.72160.237035
130.0011930.00830.496721
140.1589581.10130.13813
15-0.044582-0.30890.379378
16-0.009677-0.0670.473411
17-0.109072-0.75570.226769
18-0.095943-0.66470.254708
19-0.084721-0.5870.279988
20-0.120311-0.83350.204335
21-0.133011-0.92150.180691
22-0.023802-0.16490.434855
23-0.038933-0.26970.39426
240.1066020.73860.231886
250.1963141.36010.090076
26-0.193528-1.34080.093148
27-0.018082-0.12530.450414
280.054090.37470.354749
29-0.089917-0.6230.268129
300.1117420.77420.221312
31-0.013885-0.09620.461882
32-0.04086-0.28310.389164
33-0.052164-0.36140.359692
340.1216910.84310.201677
35-0.130592-0.90480.185053
36-0.005143-0.03560.485863
370.0245720.17020.43277
38-0.0341-0.23630.40712
39-0.072315-0.5010.309325
40-0.069917-0.48440.315153
41-0.039742-0.27530.392119
420.0363910.25210.40101
430.0062730.04350.482756
44-0.03305-0.2290.409931
45-0.048589-0.33660.36893
460.0273460.18950.425265
47-0.04237-0.29350.385186
48NANANA
49NANANA
50NANANA
51NANANA
52NANANA
53NANANA
54NANANA
55NANANA
56NANANA
57NANANA
58NANANA
59NANANA
60NANANA


Parameters (Session):
par1 = 60 ; par2 = 1 ; par3 = 0 ; par4 = 1 ; par5 = 12 ; par6 = White Noise ; par7 = 0.95 ;
Parameters (R input):
par1 = 60 ; par2 = 1 ; par3 = 0 ; par4 = 1 ; par5 = 12 ; par6 = White Noise ; par7 = 0.95 ;
R code (references can be found in the software module):
if (par1 == 'Default') {
par1 = 10*log10(length(x))
} else {
par1 <- as.numeric(par1)
}
par2 <- as.numeric(par2)
par3 <- as.numeric(par3)
par4 <- as.numeric(par4)
par5 <- as.numeric(par5)
if (par6 == 'White Noise') par6 <- 'white' else par6 <- 'ma'
par7 <- as.numeric(par7)
if (par2 == 0) {
x <- log(x)
} else {
x <- (x ^ par2 - 1) / par2
}
if (par3 > 0) x <- diff(x,lag=1,difference=par3)
if (par4 > 0) x <- diff(x,lag=par5,difference=par4)
bitmap(file='pic1.png')
racf <- acf(x, par1, main='Autocorrelation', xlab='time lag', ylab='ACF', ci.type=par6, ci=par7, sub=paste('(lambda=',par2,', d=',par3,', D=',par4,', CI=', par7, ', CI type=',par6,')',sep=''))
dev.off()
bitmap(file='pic2.png')
rpacf <- pacf(x,par1,main='Partial Autocorrelation',xlab='lags',ylab='PACF')
dev.off()
(myacf <- c(racf$acf))
(mypacf <- c(rpacf$acf))
lengthx <- length(x)
sqrtn <- sqrt(lengthx)
load(file='createtable')
a<-table.start()
a<-table.row.start(a)
a<-table.element(a,'Autocorrelation Function',4,TRUE)
a<-table.row.end(a)
a<-table.row.start(a)
a<-table.element(a,'Time lag k',header=TRUE)
a<-table.element(a,hyperlink('basics.htm','ACF(k)','click here for more information about the Autocorrelation Function'),header=TRUE)
a<-table.element(a,'T-STAT',header=TRUE)
a<-table.element(a,'P-value',header=TRUE)
a<-table.row.end(a)
for (i in 2:(par1+1)) {
a<-table.row.start(a)
a<-table.element(a,i-1,header=TRUE)
a<-table.element(a,round(myacf[i],6))
mytstat <- myacf[i]*sqrtn
a<-table.element(a,round(mytstat,4))
a<-table.element(a,round(1-pt(abs(mytstat),lengthx),6))
a<-table.row.end(a)
}
a<-table.end(a)
table.save(a,file='mytable.tab')
a<-table.start()
a<-table.row.start(a)
a<-table.element(a,'Partial Autocorrelation Function',4,TRUE)
a<-table.row.end(a)
a<-table.row.start(a)
a<-table.element(a,'Time lag k',header=TRUE)
a<-table.element(a,hyperlink('basics.htm','PACF(k)','click here for more information about the Partial Autocorrelation Function'),header=TRUE)
a<-table.element(a,'T-STAT',header=TRUE)
a<-table.element(a,'P-value',header=TRUE)
a<-table.row.end(a)
for (i in 1:par1) {
a<-table.row.start(a)
a<-table.element(a,i,header=TRUE)
a<-table.element(a,round(mypacf[i],6))
mytstat <- mypacf[i]*sqrtn
a<-table.element(a,round(mytstat,4))
a<-table.element(a,round(1-pt(abs(mytstat),lengthx),6))
a<-table.row.end(a)
}
a<-table.end(a)
table.save(a,file='mytable1.tab')